
A note on lower timeframe confirming price action…
Waiting for lower timeframe confirmation is our main tool to confirm strength within higher timeframe zones, and has really been the key to our trading success. It takes a little time to understand the subtle nuances, however, as each trade is never the same, but once you master the rhythm so to speak, you will be saved from countless unnecessary losing trades. The following is a list of what we look for:
- A break/retest of supply or demand dependent on which way you’re trading.
- A trendline break/retest.
- Buying/selling tails/wicks – essentially we look for a cluster of very obvious spikes off of lower timeframe support and resistance levels within the higher timeframe zone.
- Candlestick patterns. We tend to only stick with pin bars and engulfing bars as these have proven to be the most effective.
We search for lower timeframe confirmation between the M15 the H1 timeframes, since most of our higher-timeframe areas begin with the H4. Stops are usually placed 5-10 pips beyond confirming structures.
EUR/USD:
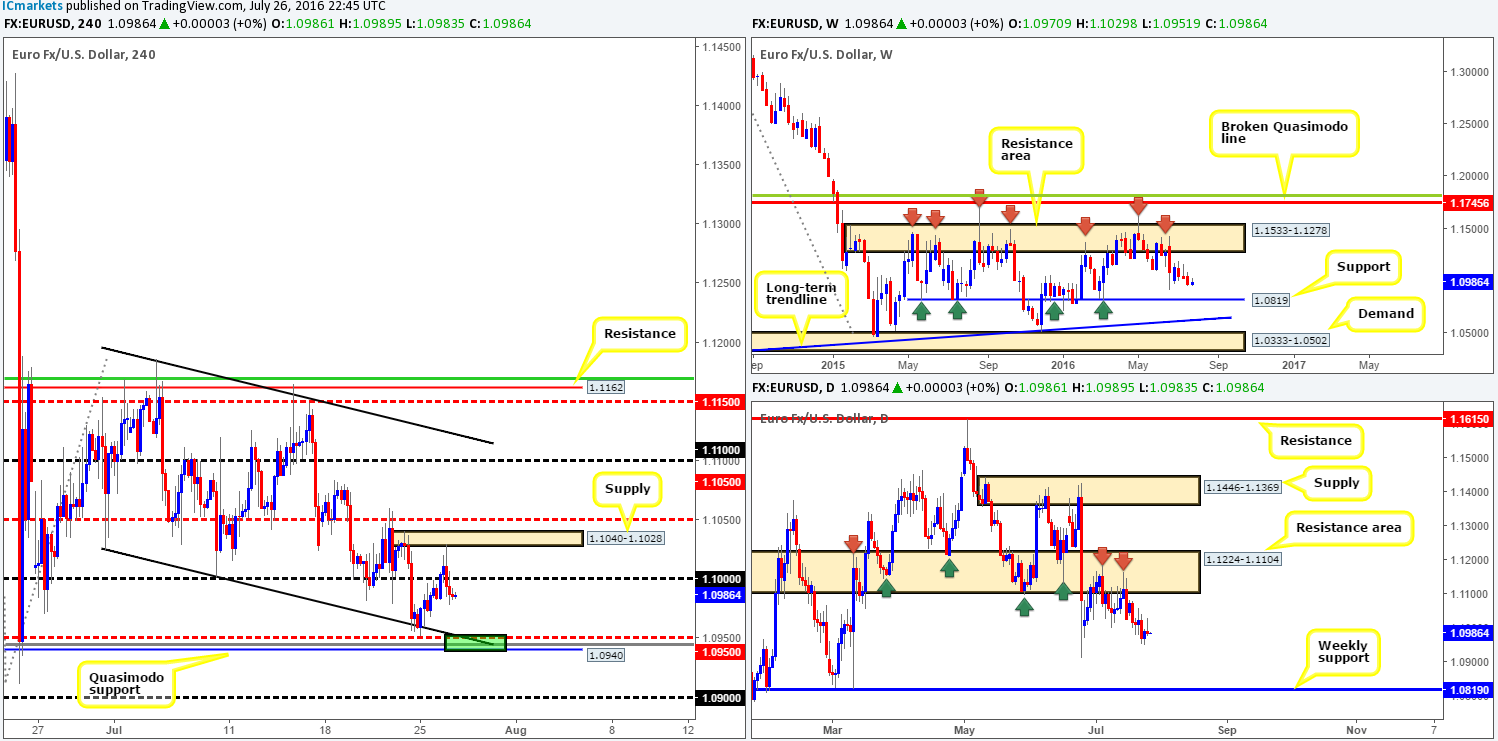
As can be seen from the H4 chart this morning, the EUR/USD managed to chalk up a close above the key figure 1.10 early on in yesterday’s sessions. However, once London opened their doors for business, price tagged a small H4 supply zone at 1.1040-1.1028 and rotated south, consequently closing back below 1.10. Given this recent action, today’s spotlight is still firmly focused on the H4 Quasimodo line at 1.0940. This barrier is backed by a deep H4 88.6% Fib retracement level at 1.0945, a H4 mid-way support at 1.0950 and a H4 channel support extended from the low 1.1023 (green zone).
Although this region does boast a nice collection of merging structures, we feel this area may be only good for a short-term bounce. The reason being is weekly action shows little support in the market stopping price from reaching a long-term weekly support level coming in at 1.0819. Furthermore, down on the daily chart, apart from the referendum low seen at 1.0911, there’s also little support stopping price from connecting with the aforementioned weekly support level.
Our suggestions: Watch for a bounce from the 1.0940/1.0950 H4 zone today. Whether one waits for lower timeframe confirmation or simply enters at market is of course down to the individual trader. In regard to targets, the most we see this pair bouncing to from here is 1.10, maybe at a stretch to the H4 supply at 1.1040-1.1028.
Levels to watch/live orders:
- Buys: 1.0940/1.0950 [Tentative – confirmation required] (Stop loss: dependent on where one confirms this area).
- Sells: Flat (Stop loss: N/A).
GBP/USD:
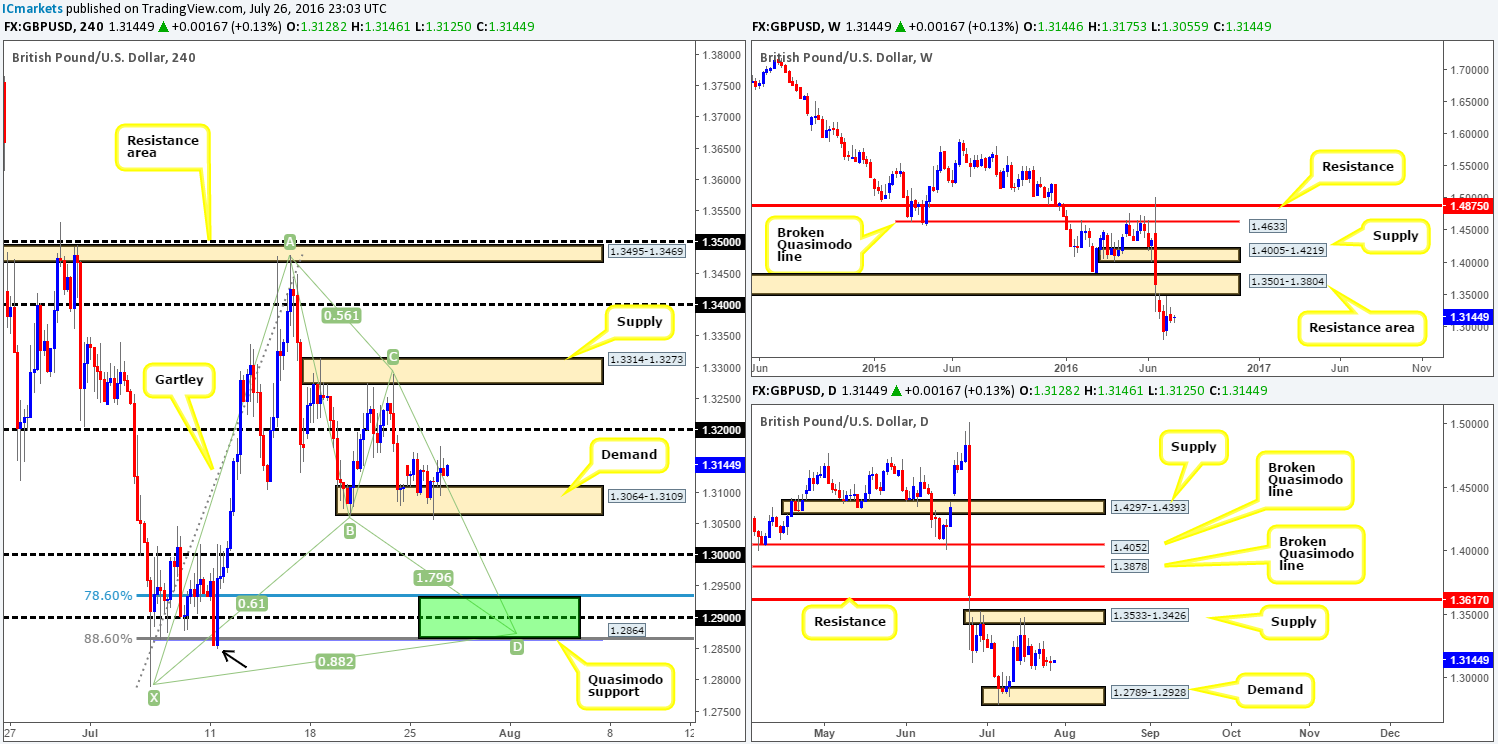
The balance of bids to offers appears to be relatively even right now, as cable continues to consolidate within Monday’s range around a H4 demand zone at 1.3064-1.3109.
With this in mind, our prime focus remains on the green H4 zone this week at 1.2868/1.2929, comprising of a H4 harmonic Gartley reversal zone, a 1.29 handle, a H4 Quasimodo support line at 1.2864 and also a supporting daily demand area at 1.2789-1.2928.
Although there is a strong possibility that the GBP could head much lower according to the weekly chart (to the downside little support is seen to the left of current price until the market reaches the 1.20 region [we had revisit 1986 to find this]), we feel that this H4 harmonic zone will produce a decent-sized bounce given its merging structures!
Our suggestions: Our team remains confident in the H4 harmonic zone mentioned above, so a pending buy order has been placed at 1.2940. In regard to stops we see the following: aggressive traders could place stops below the H4 Quasimodo low marked with a black arrow at 1.2847, or for the more conservative trader, the stop might be best placed below the X point of the H4 harmonic pattern at 1.2789.
In that the bounce could be short lived here, we have opted for the more aggressive stop loss in this case.
Levels to watch/live orders:
- Buys: 1.2940 [Pending order] (Stop loss: 1.2847).
- Sells: Flat (Stop loss: N/A).
AUD/USD:
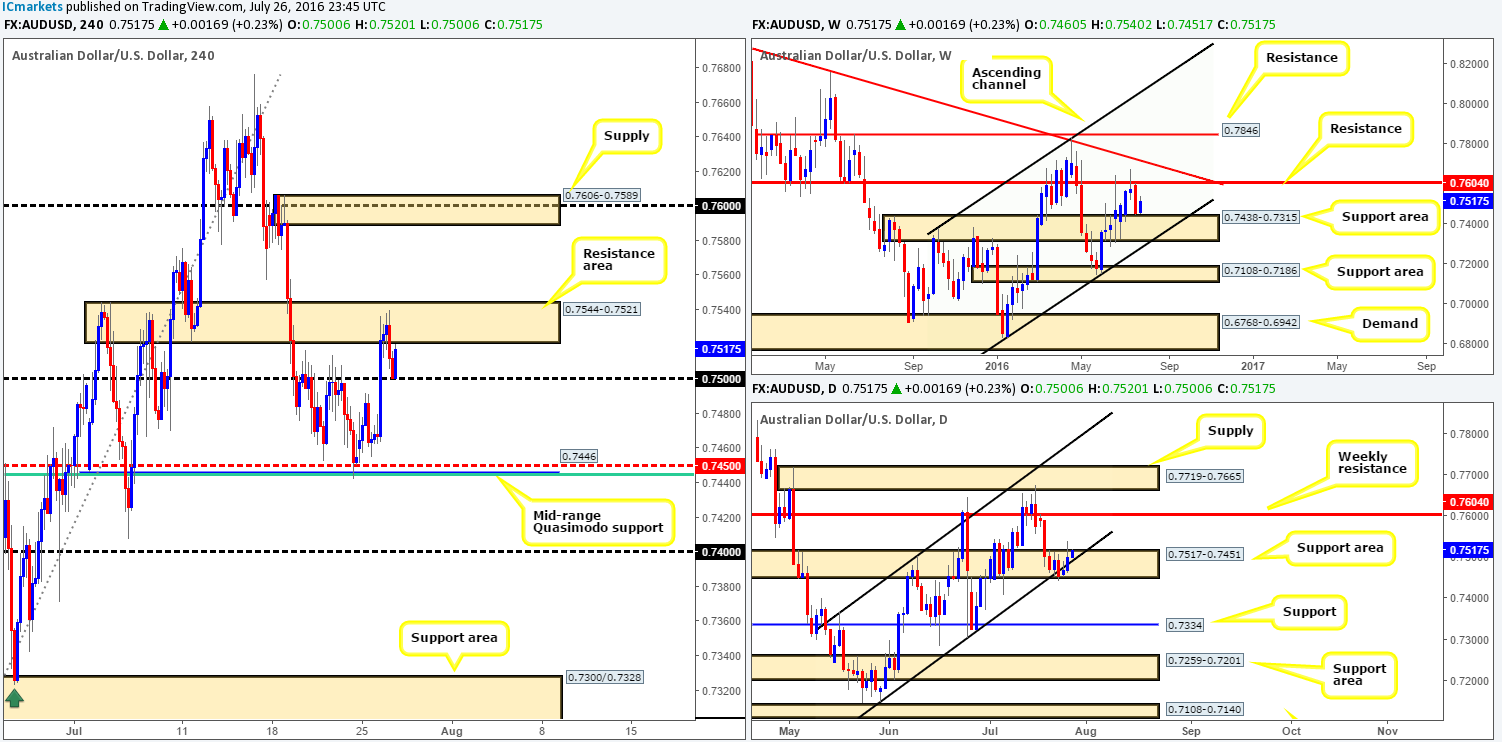
From the top this morning, we can see that the weekly bulls are currently making an appearance just ahead of a weekly support area drawn from 0.7438-0.7315. From a technical standpoint, our team sees very little stopping the commodity-linked currency from retesting the weekly resistance line at 0.7604. Lower down the curve on the daily chart, the major closed back within the daily ascending channel formation (0.7148/0.7366) yesterday, and considering that price is also bolstered by a daily support area registered at 0.7517-0.7451, further upside is likely on the cards this week.
Over on the H4 chart, however, buying right now is problematic. Despite the Aussie recently finding support at the 0.75 handle, there’s an overhead H4 resistance area penciled in at 0.7544-0.7521. With this being the case, our team will not become buyers in this market until the aforementioned H4 resistance area is engulfed and subsequently retested as demand. While we believe this a technically sound approach, in less than two hours Aussie CPI data will hit the wire, so remain vigilant as technicals may take a back seat at this time!
Our suggestions: Watch for price to close above and retest the H4 resistance area at 0.7544-0.7521 as demand. Following a successful retest, one could look to enter long with their stops placed below the traded area. To our way of seeing things, there’s only one target to be had on this trade: the H4 supply zone coming in at 0.7606-0.7589 which envelopes the weekly resistance level mentioned above at 0.7604.
Levels to watch/live orders:
- Buys: Watch for price to close above the H4 resistance area at 0.7544-0.7521 and look to trade any retest seen thereafter (Stop loss: 0.7515).
- Sells: Flat (Stop loss: N/A).
USDJPY:
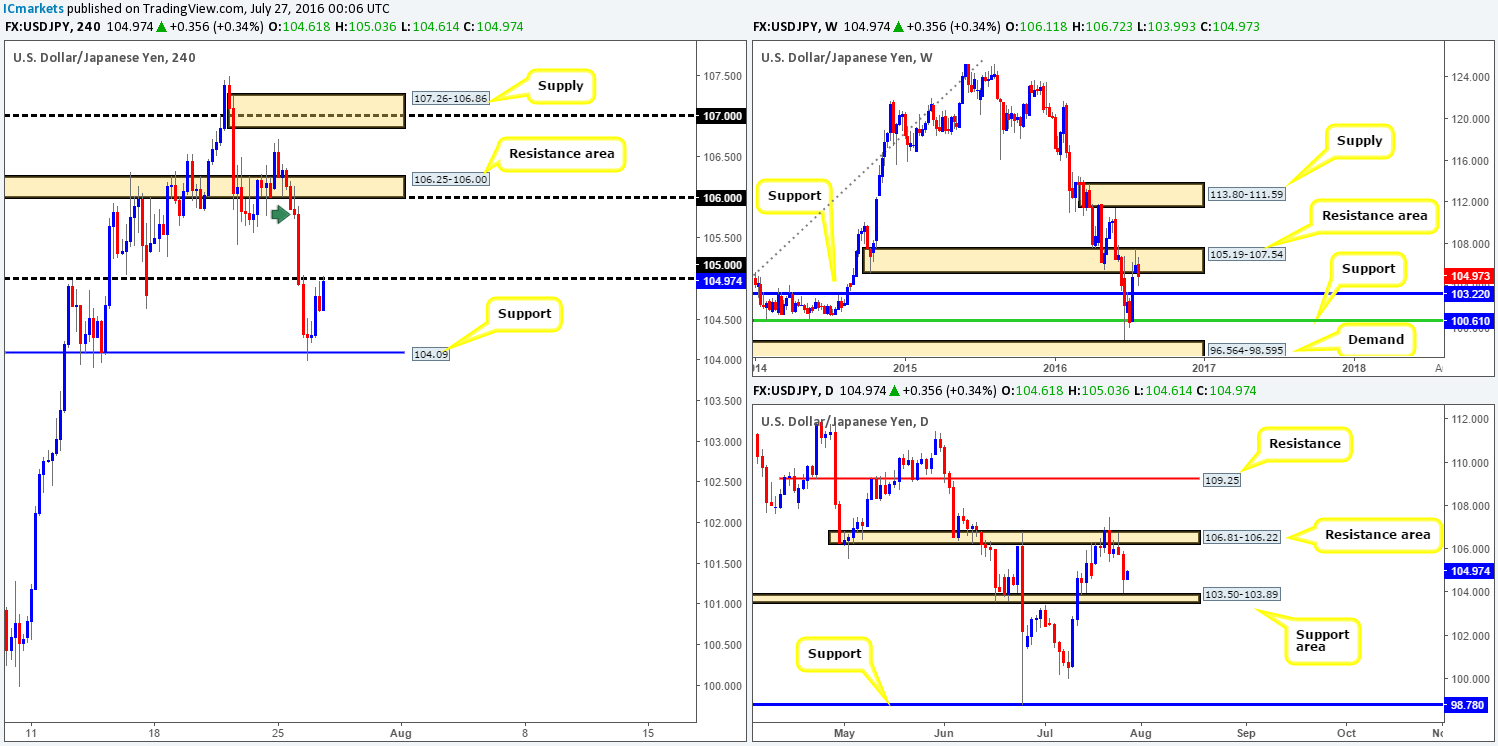
For those who read our previous report (see link below) you may recall that our team entered short at 105.70 yesterday, following the close of a H4 bearish selling wick (green arrow), with a stop set just above at 106.17. Well done to any of our readers who also jumped aboard this train as price very quickly hit the 105 region which was the pre-determined take-profit target!
Pushing forward, we see further downside is still possible on the weekly chart from the weekly resistance area at 105.19-107.54, down to weekly support penciled in at 103.22. Looking down to the daily chart, nevertheless, price came within shouting distance of connecting with a daily support area yesterday at 103.50-103.89. This – coupled with H4 action now retesting the underside of 105, where does one go from here?
Our suggestions: A sell from 105 is a viable option today given that weekly price shows room to depreciate further. However, we would not advise entering short from here without the backing of lower timeframe confirmation (see the top of this report), since daily buyers are presently making an appearance, and also due to the fact that psychological numbers are prone to some very nasty fakeouts!
http://www.icmarkets.com/blog/tuesday-26th-july-daily-technical-outlook-and-review/
- Buys: Flat (Stop loss: N/A).
- Sells: 105 region [Tentative – confirmation required] (Stop loss: dependent on where one confirms this area).
USD/CAD:
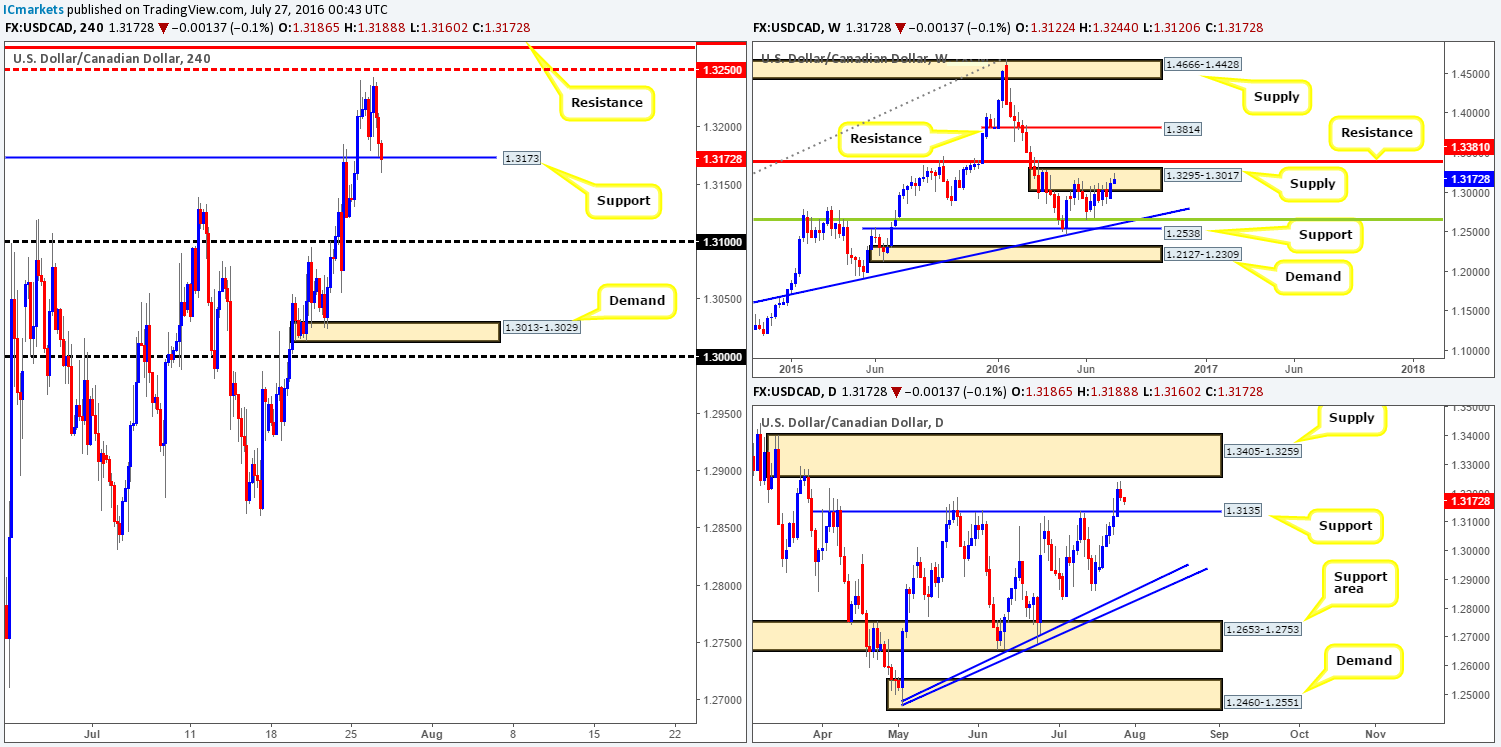
Benefiting from oil prices finding modest support around 42.48 yesterday, the USD/CAD topped out just ahead of the H4 mid-way resistance 1.3250 going into US trading. This, as can be seen from the H4 chart, forced the commodity currency south, resulting in price testing H4 support at 1.3173 by the day’s end.
Now, in that weekly action is trading from within a weekly supply base at 1.3295-1.3017, this recent drive lower should not really comes as much of a surprise. Alongside this, the daily shows price peaked just ahead of a daily supply zone coming in at 1.3405-1.3259, and now looks to be heading in the direction of a daily support line drawn from 1.3135.
Our suggestions: Buying from the current H4 support is not really something that our team would label a high-probability zone for a bounce. The reason comes from both the weekly and daily charts suggesting price will likely dive lower (see above). An alternative approach, however, is to see if price can close below this line and then attempt to trade any retest seen thereafter, with the backing of a lower timeframe sell signal (see the top of this report). Downside targets from here would be the daily support at 1.3135, followed closely by the 1.31 handle.
Levels to watch/live orders:
- Buys: Flat (Stop loss: N/A).
- Sells: Watch for price to close below the H4 support at 1.3173 and look to trade any retest seen thereafter (lower timeframe confirmation required).
USD/CHF:
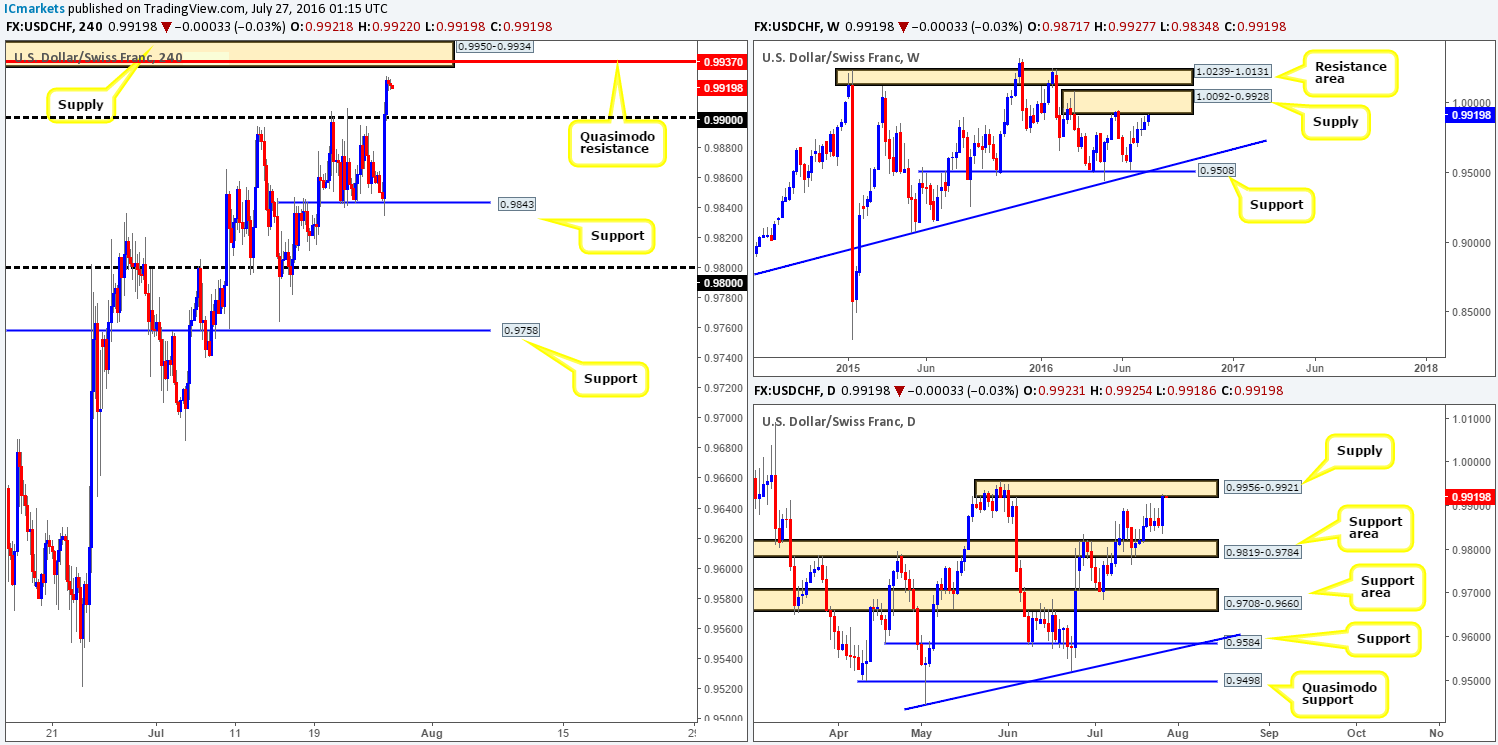
As London buyers entered the fray yesterday the Swissy pair rocketed over eighty pips north, reaching highs of 0.9927 on the day! This, as you can see, pushed price up to within striking distance of a H4 supply zone drawn at 0.9950-0.9934, which boasts a nice-looking H4 Quasimodo resistance line at 0.9937. What this recent drive north also did was push daily price into supply at 0.9956-0.9921 and weekly action into the underside of a weekly supply zone at 1.0092-0.9928. This – coupled with the EUR/USD (an inversely correlated market to the USD/CHF) also drawing up a H4 buy zone between 1.0940/1.0950, makes the Swissy H4 supply a wonderful area to short from today.
Our suggestions: In light of the above points, our team has placed a pending sell order at 0.9933, with a stop placed just above at 0.9960. If the above order is filled today, we’ll look to reduce risk around the 0.99 handle and take 50% off the table, and then attempt to let the rest run down to H4 support at 0.9843.
Levels to watch/live orders:
- Buys: Flat (Stop loss: N/A).
- Sells: 0.9933 [Pending order] (Stop loss: 0.9960).
DOW 30:
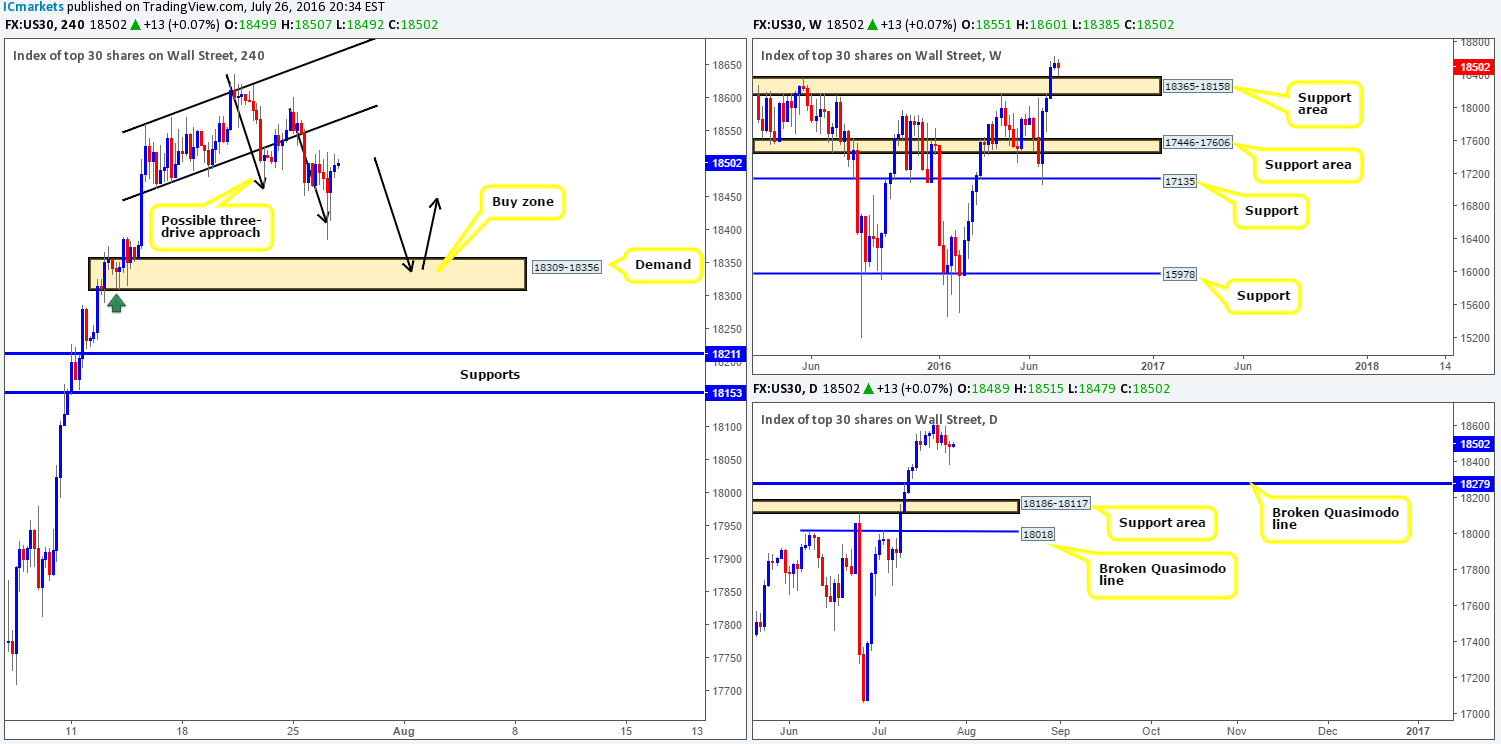
Beginning with a quick look at the weekly chart today, we can see that the index came within an ant’s hair of striking the top-side of a weekly support area at 18365-18158. According to daily price action, however, the DOW can potentially push lower to a broken daily Quasimodo level at 18279, which as you can probably see, is positioned within the above said weekly support area.
Much the same as yesterday’s report guys, here is what we’re looking at on the H4 chart:
- Possible H4 three-drive approach forming en route to a H4 demand zone coming in at 18309-18356 (see black arrows).
- The tails seen marked on the H4 chart with a green arrow represent buying interest around this neighborhood, thus there is a strong possibility that there are unfilled orders still residing here.
- The current H4 demand base is also housed within a weekly support area drawn from 18365-18158, and sits just above a broken daily Quasimodo level at 18279.
Our suggestions: Despite the confluence seen around this H4 demand area, our team would still require a lower timeframe buy entry to form prior to risking capital, due to the possibility that price may fake beyond the aforementioned H4 demand into the broken daily Quasimodo line. What we mean by lower timeframe confirmation is simply either an engulf of supply followed by a subsequent retest, a trendline break/retest or simply a collection of well-defined buying tails around the higher timeframe zone. Stops are usually placed 5-10 pips beyond the confirming structure.
Levels to watch/live orders:
- Buys: 18309-18356 [Tentative – confirmation required] (Stop loss: dependent on where one confirms this area).
- Sells: Flat (Stop loss: N/A).
GOLD:
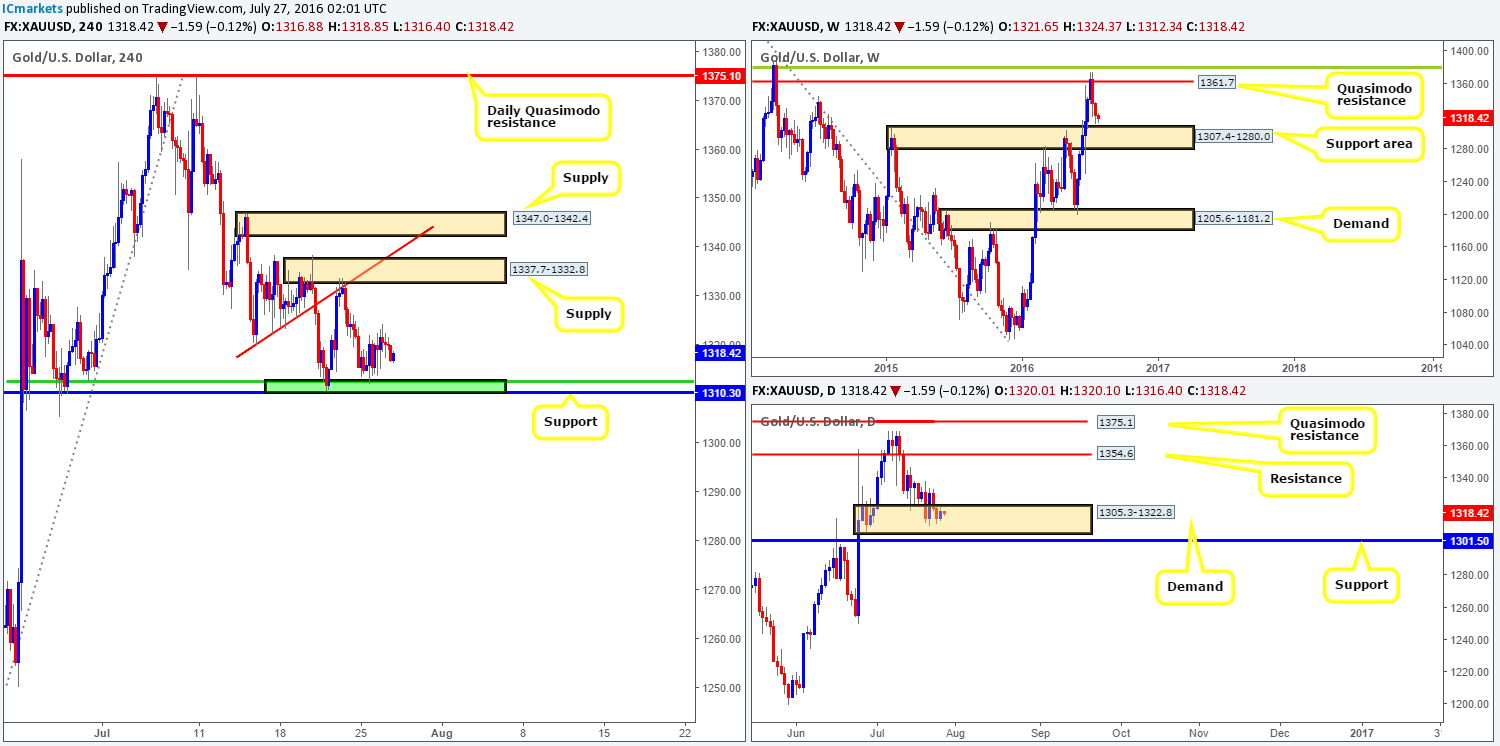
In recent sessions, we can see that the yellow metal was unable to close beyond Monday’s trading range. Seeing as how gold remains loitering above a reasonably decent-looking H4 buy zone at 1310.3-1312.4 (comprises of a H4 support and a H4 50.0% Fib support), much of the following analysis will echo similar thoughts put forward in Tuesday’s report.
Scooting up to the weekly chart, it’s reasonably easy to see who’s in control at the moment. However, as we mentioned yesterday, downside momentum is likely to diminish soon, since the yellow metal is now seen loitering just ahead of a weekly support area coming in at 1307.4-1280.0. Lower down the curve on the daily chart, however, the buyers and sellers remain battling for position within the confines of a daily demand area carved from 1305.3-1322.8.
Our suggestions: This is quite a tricky market to trade in our opinion. On the one hand, the metal is seen trading firmly within a daily demand base, but on the other hand, weekly movement shows further selling is still possible. If one is interested in buying from the current H4 buy zone, despite what the weekly picture is suggesting, we would recommend waiting for lower timeframe confirmation to form before risking capital. For lower timeframe entry techniques, please see the top of this report.
For us personally, we’re going to take a back seat for the time being, as we’d much prefer to trade knowing weekly flow is on our side!
Levels to watch/live orders:
- Buys: 1310.3-1312.4 [Tentative – confirmation required] (Stop loss: dependent on where one confirms this area).
- Sells: Flat (Stop loss: N/A).


