
EUR/USD:
Pressured by declining US Treasury yields, the US dollar Index (calculated by factoring in the exchange rates of six major world currencies) extended losses Tuesday, shaking hands with its lowest level in three weeks at 95.95.
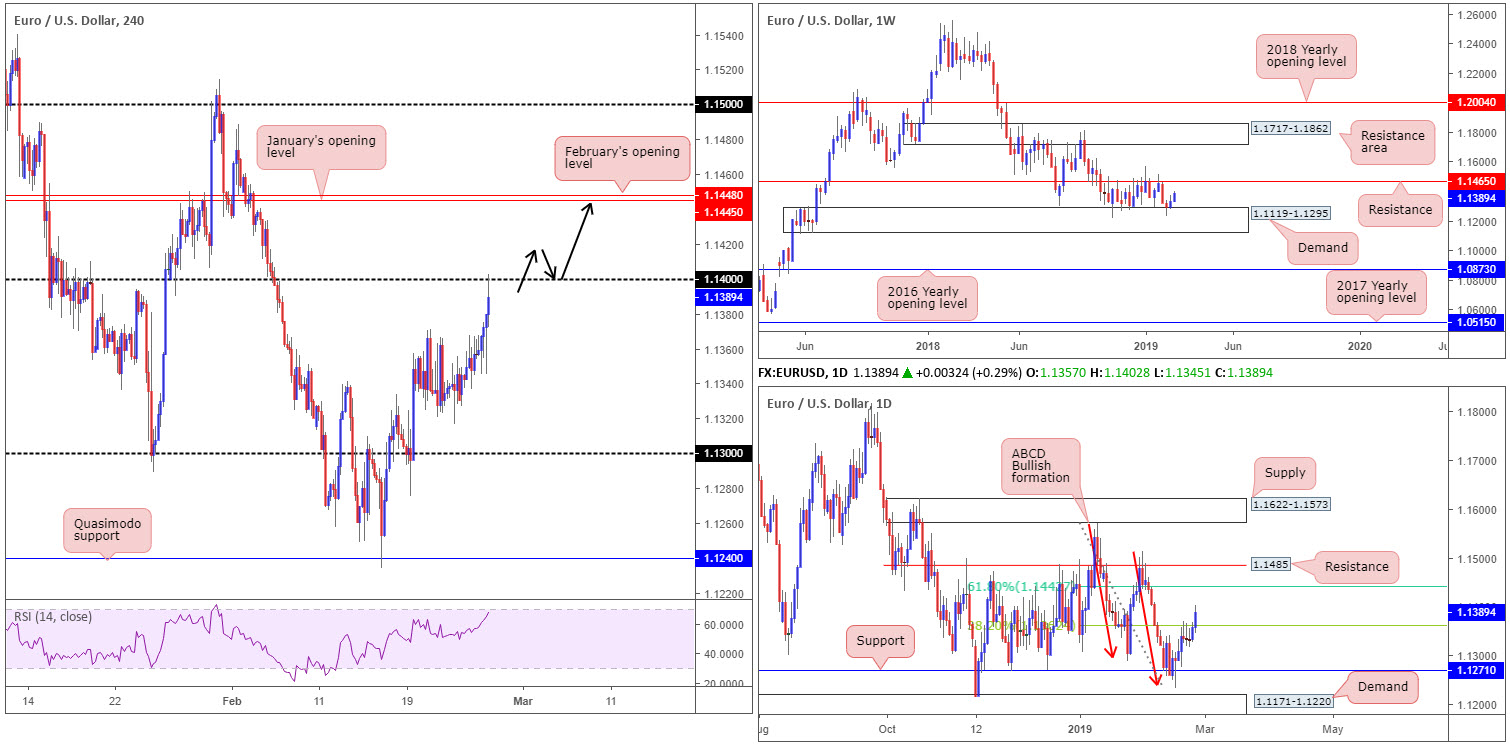
Consequence to a waning greenback, the euro charged higher yesterday. Breaking last Wednesday’s high at 1.1371, the pathway unlocked for a run towards 1.14 which, as you can see, is holding form as a resistance. Beyond this number, nevertheless, the research team notes January’s opening level at 1.1445, shadowed closely by February’s opening level at 1.1448.
On more of a broader perspective, weekly buyers remain in fine form after crossing swords with the top edge of demand coming in at 1.1119-1.1295. The next upside target from here falls in around a long-standing support/resistance at 1.1465. In conjunction with weekly flow, the daily timeframe recently crossed above its 38.2% Fibonacci resistance value at 1.1362. This level, as highlighted in previous reports, is the first take-profit target for many traders long the daily ABCD bullish completion point (red arrows) around 1.1240. Above this barrier, we have the 61.8% Fibonacci resistance value at 1.1442 in the spotlight – considered the second take-profit target off the ABCD pattern.
Areas of consideration:
Overall, the research team remains biased to the upside this week, largely due to the combination of both weekly and daily charts pointing to further buying.
With the above in mind, a simple break/retest play might be worth keeping an eye on around 1.14 (black arrows). For conservative traders, waiting and seeing if a H4 bullish candlestick formation develops on the retest is an option. That way, not only have you additional confirmation buyers may be interested, you also have entry and stop parameters to work with based on the candlestick structure.
In terms of upside targets from 1.14, the daily 61.8% Fibonacci resistance value mentioned above at 1.1442 can be an initial take-profit zone, followed closely by the monthly opening levels highlighted above around 1.1448/45.
Today’s data points: German Buba President Weidmann Speaks; Fed Chair Powell Testifies.
GBP/USD:
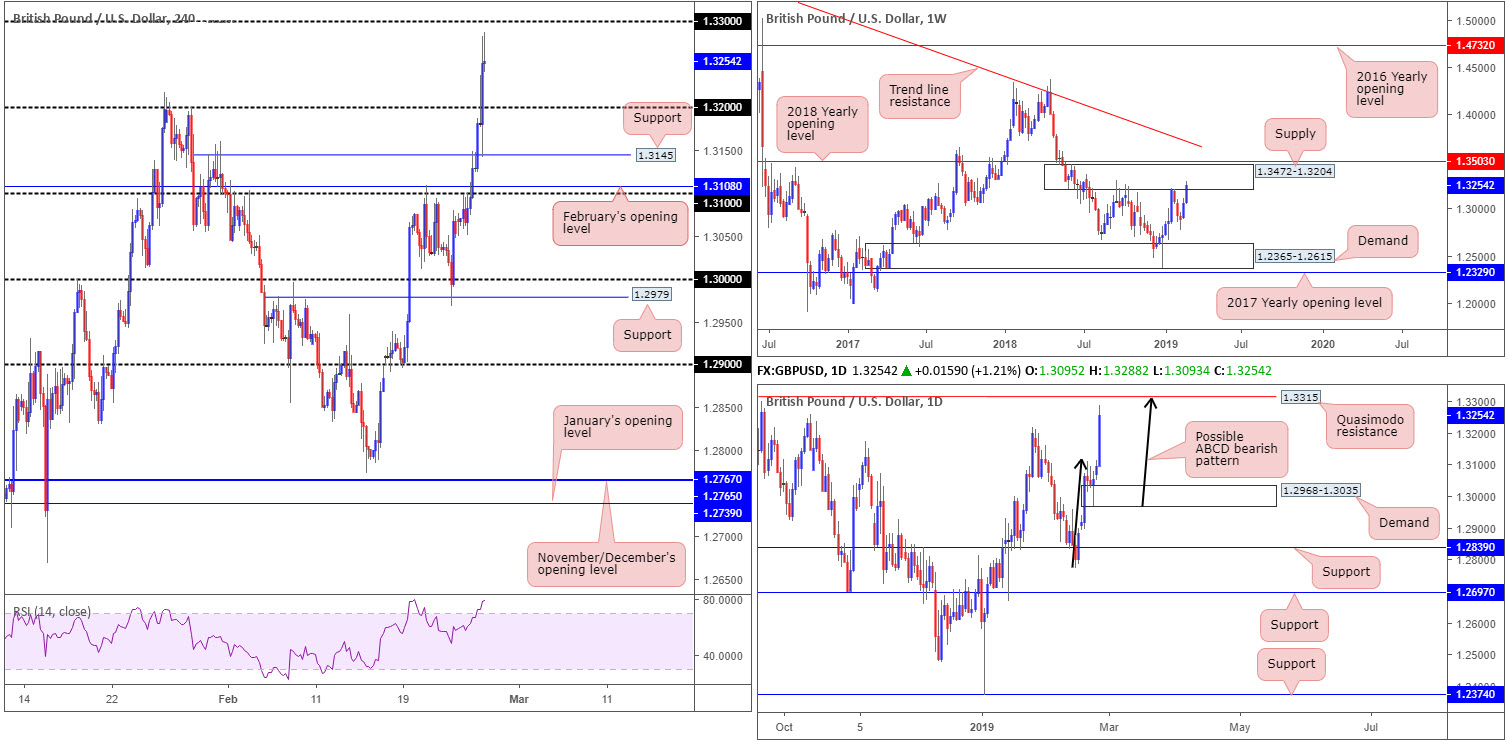
Cable set a fresh 2019 high (1.3283) Tuesday following reports UK PM May is to offer a vote on extending Article 50 (as well as offering a vote on a no deal Brexit) if her deal doesn’t pass Parliament on 12 March.
Based on weekly structure, recent upside hauled the market into the walls of a supply zone drawn from 1.3472-1.3204. As you can see, this area already held price action lower once in early September 2018, therefore there’s a chance history may repeat itself. A closer reading on the daily timeframe reveals the unit trades within striking distance of Quasimodo resistance at 1.3315. Adding weight to a potential correction from here is the approach: an ABCD bearish formation (black arrows).
The story over on the H4 timeframe, shows the unit mildly pared gains just south of the 1.33 handle. Note the 1.33 handle held price strongly lower in late September 2018. It is also worth noting the number is sited within the current weekly supply, and also merges close by the daily Quasimodo resistance underlined above at 1.3315.
Areas of consideration:
Active sellers likely reside around 1.33 in light of its surrounding confluence on the higher timeframes. Selling from here, however, when both H4 and daily timeframes exhibit strong uptrends, is difficult. An alternative might be to wait and see how H4 action responds from 1.33 before considering a sell. A H4 pin-bar bearish candlestick formation, for example, highlights seller intent as well as provides entry and stop levels to trade.
The first take-profit target sub 1.33 falls in around 1.32.
Today’s data points: Fed Chair Powell Testifies.
AUD/USD:
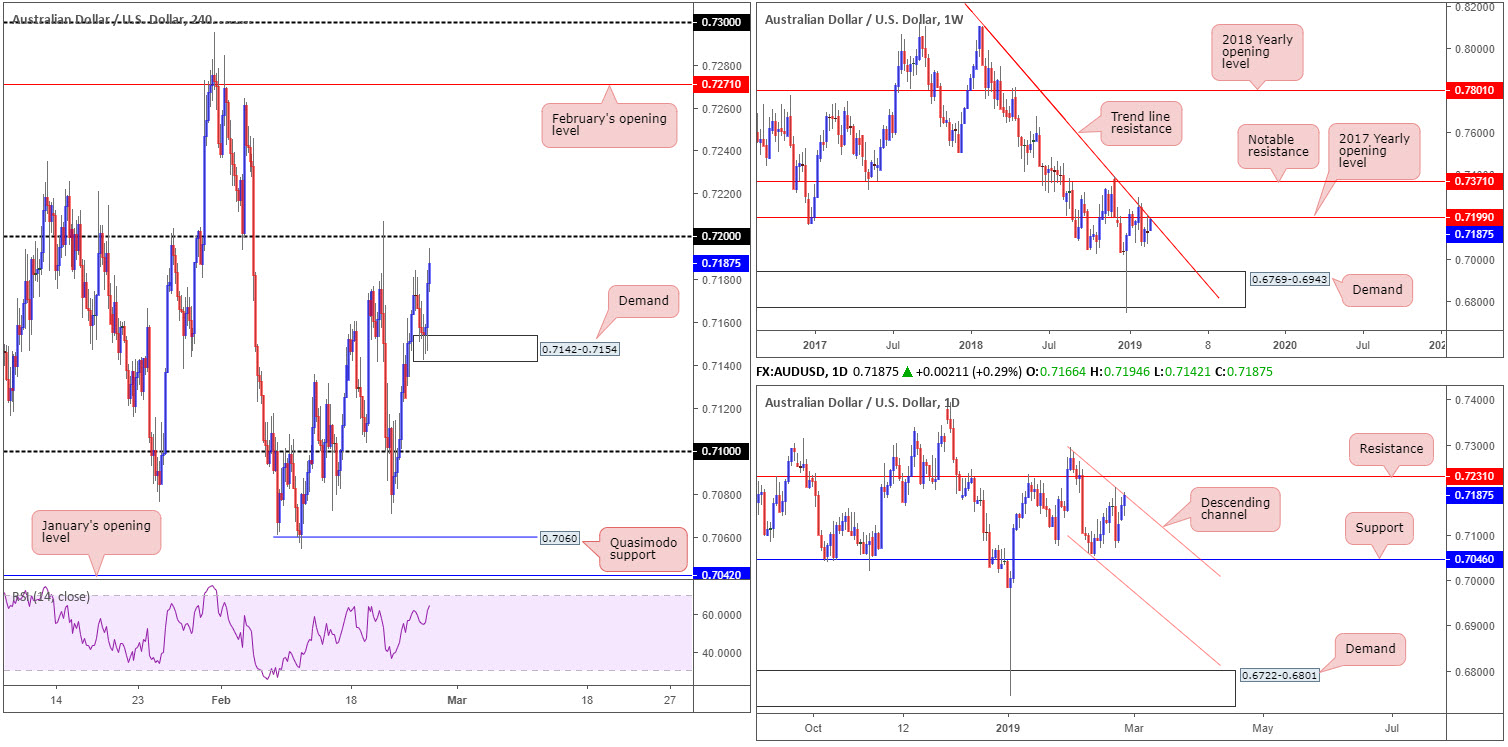
Greenback weakness continued to benefit the commodity currency Tuesday, pulling the H4 candles nearby its 0.72 handle. Although above this barrier scope to push higher is possible until February’s opening level at 0.7271, 0.72 is a MAJOR resistance.
Besides offering resistance as a round number, 0.72 fuses with 0.7199 on the weekly timeframe: the 2017 yearly opening level, as well as merging trend line resistance (taken from the 2018 yearly high of 0.8135). Further adding weight to 0.72, nearby resistance on the daily timeframe is seen in the shape of a channel formation (taken from the high 0.7295), and a resistance parked overhead at 0.7231.
Therefore, until we FIRMLY cross above 0.72, this remains a bearish market despite recent buying.
Areas of consideration:
0.72, for reasons stated above, is a key number in this market today. A rejection from here by way of a notable bearish candlestick pattern (entry/stop parameters can be defined according to its structure) offers traders a high-probability entry to sell, targeting H4 demand at 0.7142-0.7154 as the initial port of call.
A break above 0.72 today, nonetheless, may call for a retest play to emerge, targeting February’s opening level at 0.7271.
Today’s data points: Fed Chair Powell Testifies.
USD/JPY:
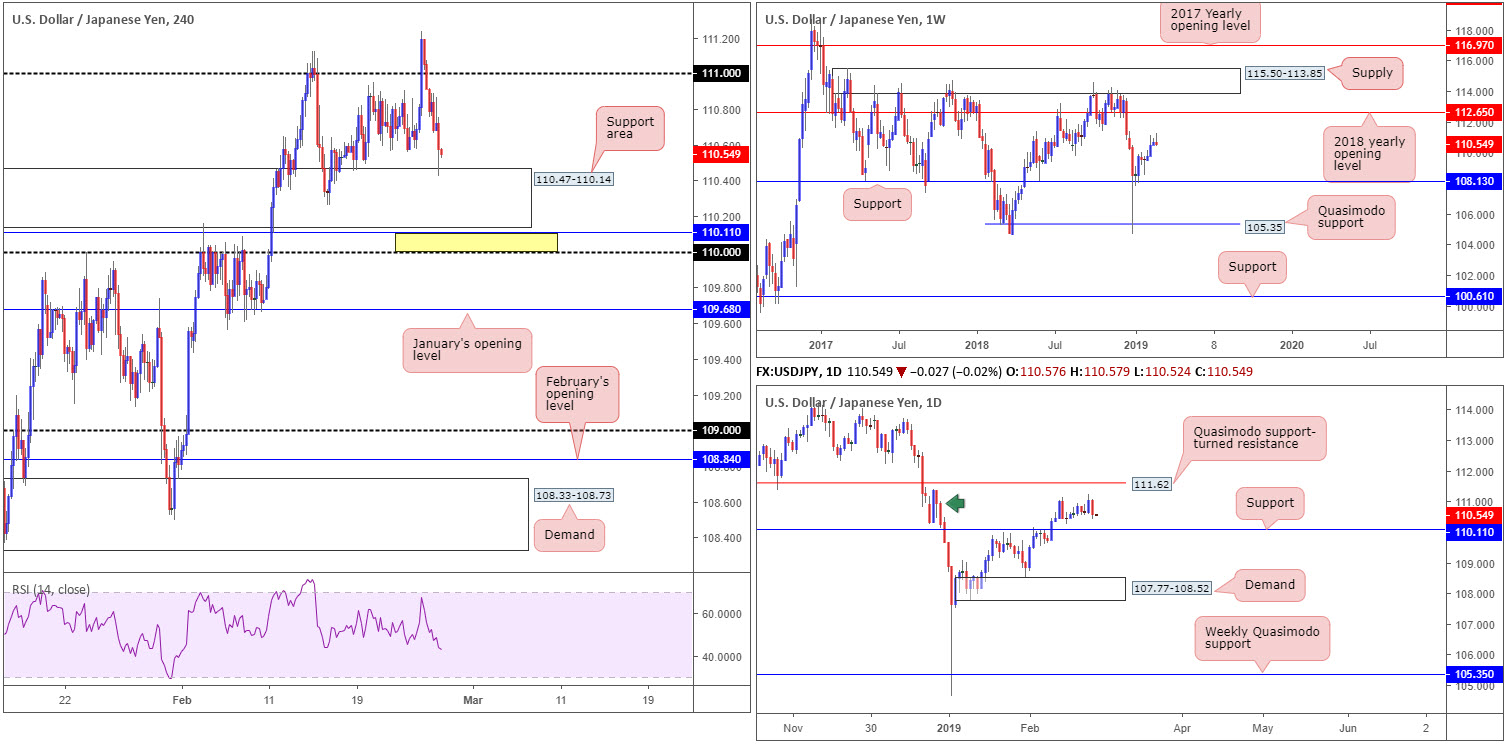
The steep descent observed in US Treasury yields, along with a lacklustre US equity market, weighed on the USD/JPY Tuesday, erasing all of Monday’s gains in the process.
The early hours of yesterday’s session witnessed a strong move below 111, which resumed into the US session and eventually clocked an overall daily low of 110.42. As is evident on the H4 timeframe, a rather large support area at 110.47-110.14 was pulled back into the mix yesterday, which, according to our technical reading, was the area behind the move to fresh 2019 highs at 111.23.
Beneath the current H4 support zone, the 110 handle rests nearby, as does daily support coming in at 110.11 (yellow). The combination of these two levels, along with stop-loss orders plotted below the H4 support zone offering liquidity to buyers, this is an area of interest today.
Areas of consideration:
110/110.11, as noted, is a striking zone. Be that as it may, a couple of red flags are present. Firstly, weekly price displays room to press beyond this area, as the next support on that timeframe does not enter the field until support at 108.13. Secondly, round numbers such as 110 are prone to fakeouts in order to run stops.
In light of the above, waiting for additional confirmation to develop is recommended before pulling the trigger. This could be anything from a bullish candlestick pattern, an EMA crossover or a resistance-turned support setup on the lower timeframes.
Today’s data points: Fed Chair Powell Testifies.
USD/CAD:
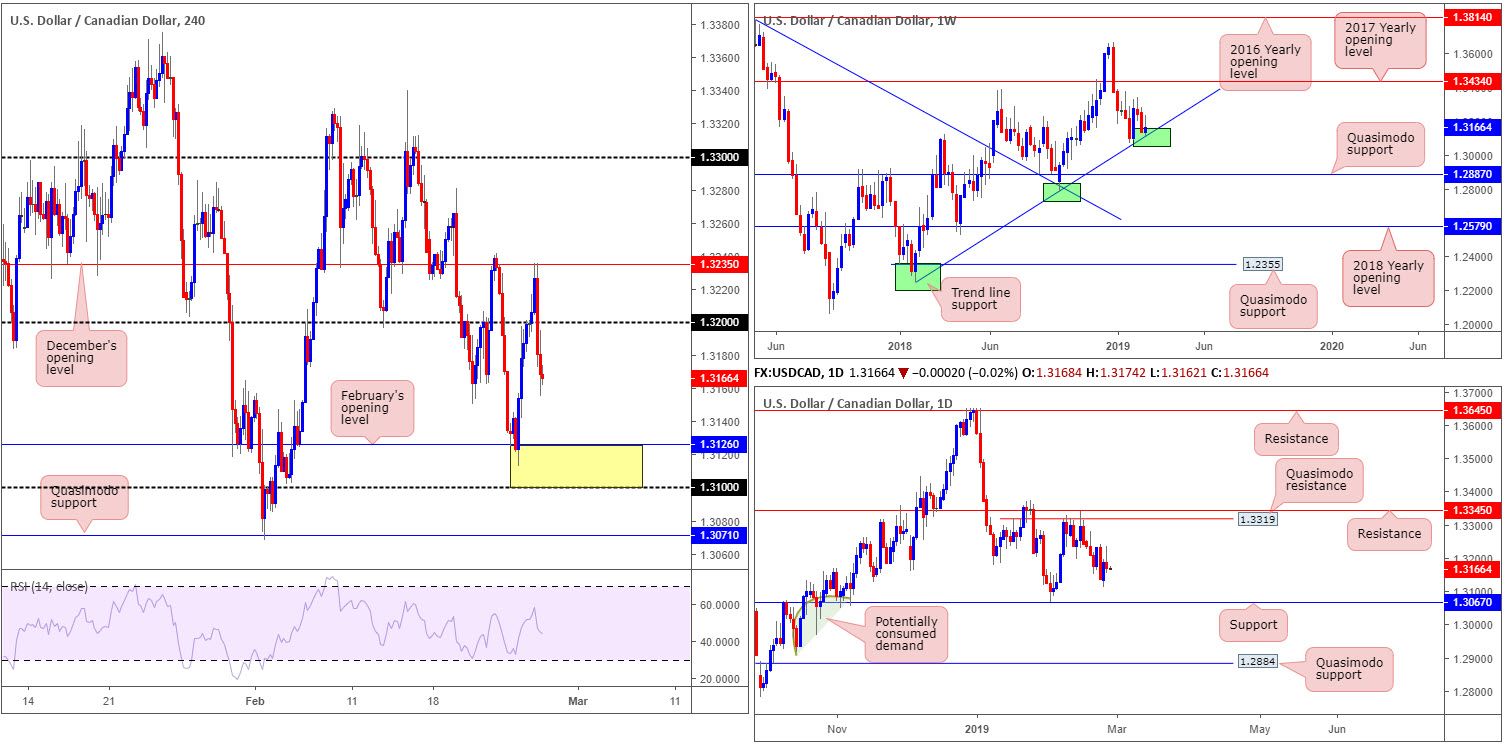
Kicking things off from the weekly timeframe, the research team notes weekly price trading from a trend line support (etched from the low 1.2247). A rejection could lead to an approach towards the 2017 yearly opening level at 1.3434 over the coming weeks.
Daily movement, on the other hand, reveals we have room to potentially push as far south as support coming in at 1.3067. In the event the market turns higher, though, obvious resistance stands at 1.3319 in the form of a Quasimodo, shadowed closely by another resistance pencilled in at 1.3345.
US hours saw the H4 candles fade December’s opening level at 1.3235 Tuesday, and overthrow 1.32 to the downside. By and of itself, this exposes February’s opening level at 1.3126 as the next viable support.
Areas of consideration:
Shorting at current price, or even on a retest of 1.32, is chancy knowing where we’re trading from on the weekly timeframe: trend line support. Therefore, traders may find use in February’s opening level mentioned above at 1.3126 as support today, though do bear in mind the unit may surpass this level in favour of the round number 1.31. As such, it may be sensible to combine 1.31 and 1.3126 as a support zone (yellow) and look for trading opportunities around this area.
Today’s data points: Fed Chair Powell Testifies; Canadian CPI m/m.
USD/CHF:
Outlook remains unchanged.
Despite the EUR/USD exploring higher ground Tuesday (an inversely correlated market), the USD/CHF remains sedated around its 1.0000 figure (parity). With this being the case, much of the following piece will bring forward thoughts echoed in previous reports.
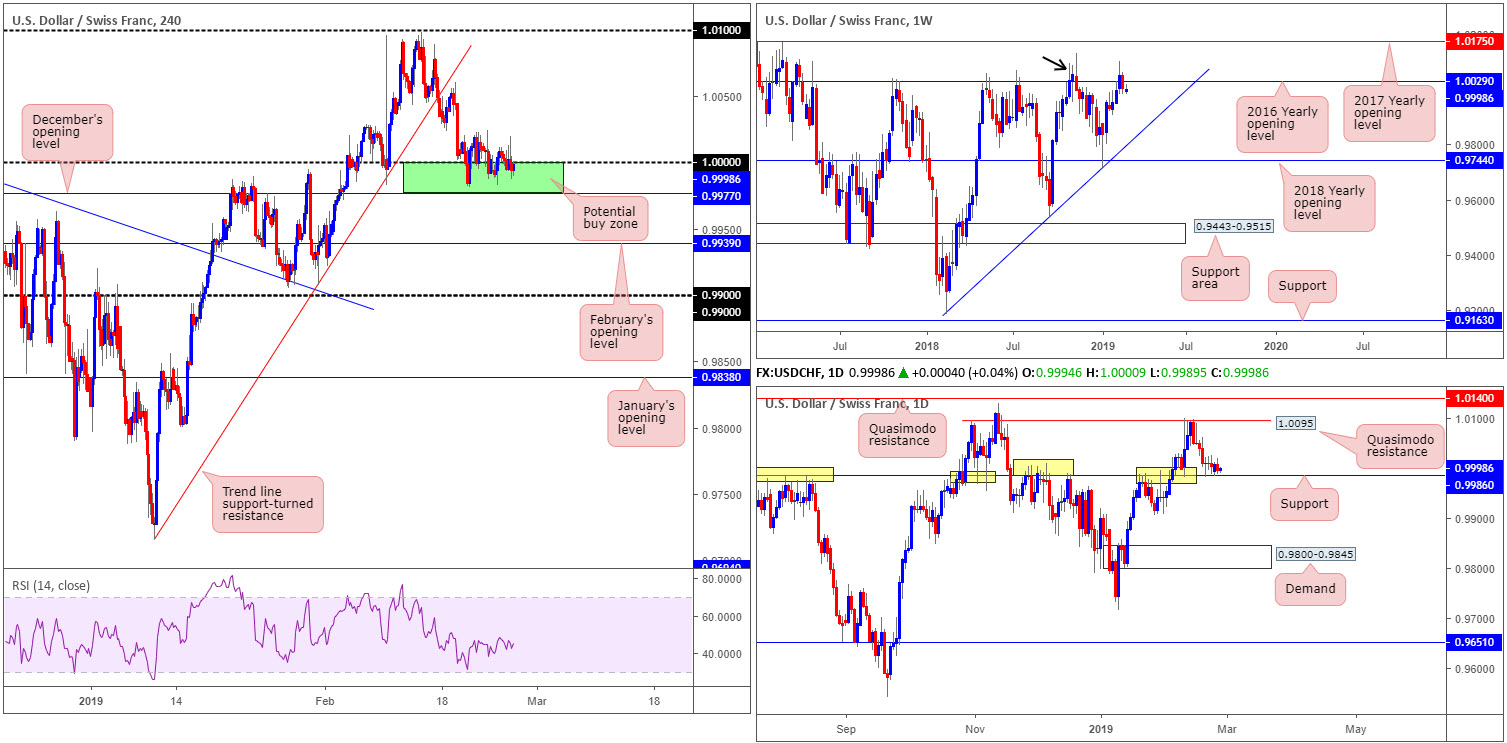
Weekly buyers struggled to gain a foothold above its 2016 yearly opening level at 1.0029 last week, consequently clawing back prior week gains and breaking a three-week bullish run. As highlighted in the previous weekly briefing, the barrier’s history as a resistance may still draw in sellers as it did in November 2018 (black arrow).
A closer look at price action on the daily timeframe turns the spotlight towards notable support seen at 0.9986. The level’s history (yellow) is a prominent feature on this chart, and therefore could hinder weekly sellers from 1.0029 this week.
Alongside 1.0000 on the H4 timeframe, December’s opening level at 0.9977 as well as daily support coming in at 0.9986, collectively forms an appealing range of support (green). As highlighted in previous analysis, while 0.9977/1.0000 may be a tempting location to consider buying this market from in view of its construction, traders are urged to take into account weekly price trading beneath its 2016 yearly opening level at 1.0029.
Areas of consideration:
The combination of daily support mentioned above at 0.9986, December’s opening level at 0.9977 and 1.0000 has likely enticed buyers into the market, despite the threat of weekly sellers residing above.
For those currently long this market, with stop-loss orders likely tucked underneath December’s opening level, the initial upside target around 1.0050 appears a reasonably logical starting point, followed by the daily Quasimodo resistance at 1.0095 (the next upside target on the daily scale).
Today’s data points: Fed Chair Powell Testifies.
Dow Jones Industrial Average:
Outlook remains unchanged.
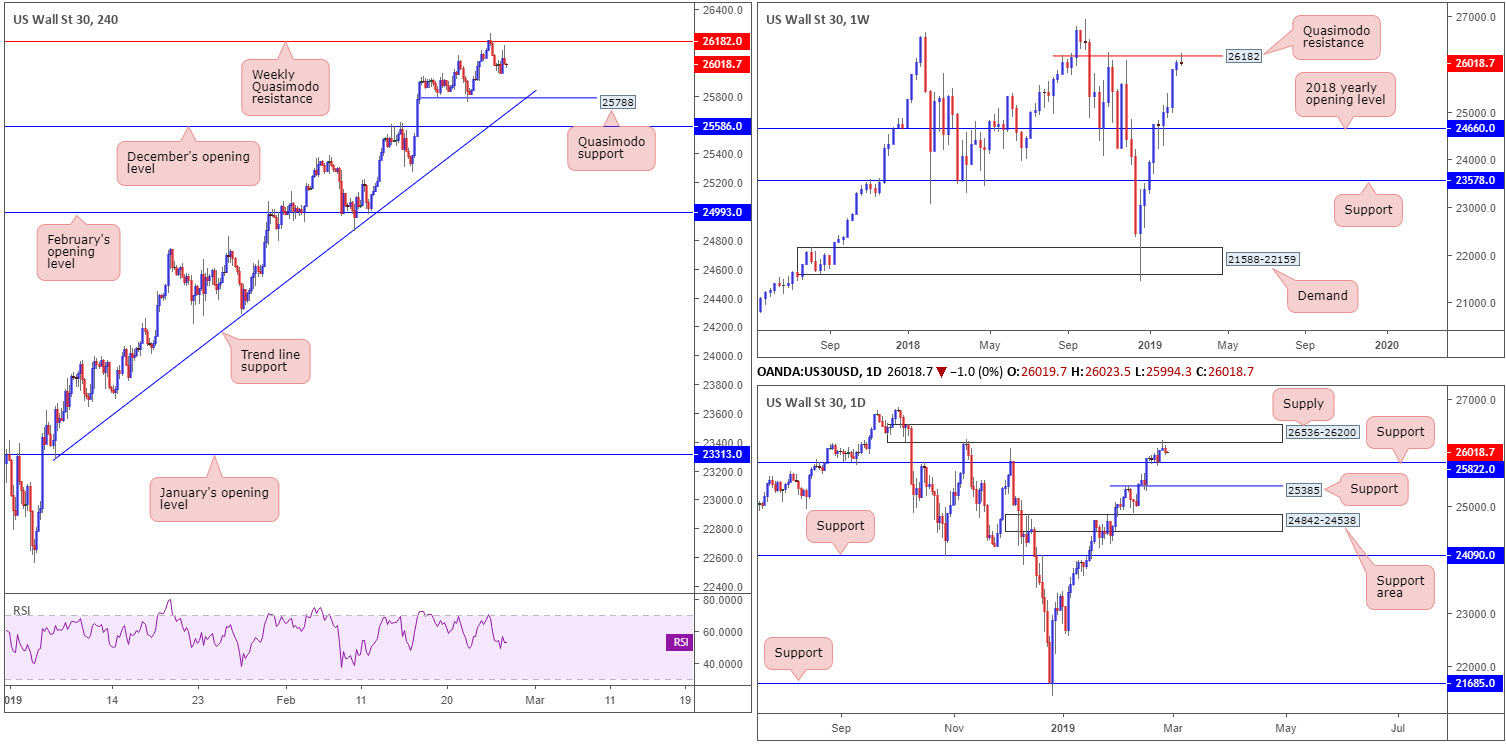
US equities concluded Tuesday’s segment dipping its toe into negative territory, down 0.24%. Follow-through selling, technically speaking, is likely due to where we’re trading from on the weekly timeframe: a Quasimodo resistance level at 26182.
Adding weigh to the sellers’ position, though, was a daily bearish pin-bar formation printed off the underside of daily supply coming in at 26536-26200. The next downside target on the daily remains sited around support at 25822. As highlighted in Tuesday’s briefing, there was not much to add in terms of structure on the H4 timeframe, aside from the next support target on this scale being seen a few points south of daily support at 25788: a Quasimodo support level.
Areas of consideration:
Traders who read Tuesday’s report may recall the piece underlining a possible sell, basing entry and risk levels off the daily bearish pin-bar pattern. Well done to any of our readers who are short, as traders have more than a 1:1 risk/reward ratio to the daily support level mentioned above at 25822.
Today’s data points: Fed Chair Powell Testifies.
XAU/USD (GOLD):
Outlook remains unchanged.
Bullion, once again, was little changed in recent trade, up 0.13% vs. its US counterpart. In view of this, the research team’s outlook remains unchanged going forward…
As is evident from the H4 timeframe, the candles are enveloped between a supply drawn from 1337.3-1333.2 and a rather interesting area of support (yellow) at 1315.5/1321.0 (comprised of H4 support at 1315.5, the 61.8% H4 Fibonacci support value at 1319.4 and February’s opening level at 1321.0).
Higher up on the curve, weekly flow left resistance at 1357.6 unchallenged last week and faded highs of 1346.7, concluding the week by way of a bearish pin-bar formation. This has likely caught the eye of candlestick traders, and could potentially entice sellers into the market this week towards the 2018 yearly opening level at 1302.5.
A notch lower, on the other hand, daily price is seen hovering ahead of support at 1322.1 that is currently housed within an ascending channel support (1196.4/1298.5). Therefore, this may hinder downside activity on the weekly timeframe this week.
Areas of consideration:
With the above in mind, traders may find use in the yellow zone marked on the H4 timeframe at 1315.5/1321.0 as a possible buy zone today. Note this area is also seen a few pips south of daily support at 1322.1.
Despite 1315.5/1321.0 housing reasonably attractive confluence, do bear in mind weekly price shows room to potentially press beyond this area. For that reason, waiting for additional forms of confirmation to take shape out of the zone is recommended before pulling the trigger. One such example is a H4 bullish candlestick signal. An alternative to this is drilling down to the lower timeframes and trading a resistance-turned support setup.

The accuracy, completeness and timeliness of the information contained on this site cannot be guaranteed. IC Markets does not warranty, guarantee or make any representations, or assume any liability with regard to financial results based on the use of the information in the site.
News, views, opinions, recommendations and other information obtained from sources outside of www.icmarkets.com.au, used in this site are believed to be reliable, but we cannot guarantee their accuracy or completeness. All such information is subject to change at any time without notice. IC Markets assumes no responsibility for the content of any linked site. The fact that such links may exist does not indicate approval or endorsement of any material contained on any linked site.
IC Markets is not liable for any harm caused by the transmission, through accessing the services or information on this site, of a computer virus, or other computer code or programming device that might be used to access, delete, damage, disable, disrupt or otherwise impede in any manner, the operation of the site or of any user’s software, hardware, data or property.


