
A note on lower timeframe confirming price action…
Waiting for lower timeframe confirmation is our main tool to confirm strength within higher timeframe zones, and has really been the key to our trading success. It takes a little time to understand the subtle nuances, however, as each trade is never the same, but once you master the rhythm so to speak, you will be saved from countless unnecessary losing trades. The following is a list of what we look for:
- A break/retest of supply or demand dependent on which way you’re trading.
- A trendline break/retest.
- Buying/selling tails/wicks – essentially we look for a cluster of very obvious spikes off of lower timeframe support and resistance levels within the higher timeframe zone.
- Candlestick patterns. We tend to stick with pin bars and engulfing bars as these have proven to be the most effective.
We search for lower timeframe confirmation between the M15 and H1 timeframes, since most of our higher-timeframe areas begin with the H4. Stops are usually placed 5-10 pips beyond confirming structures.
EUR/USD:
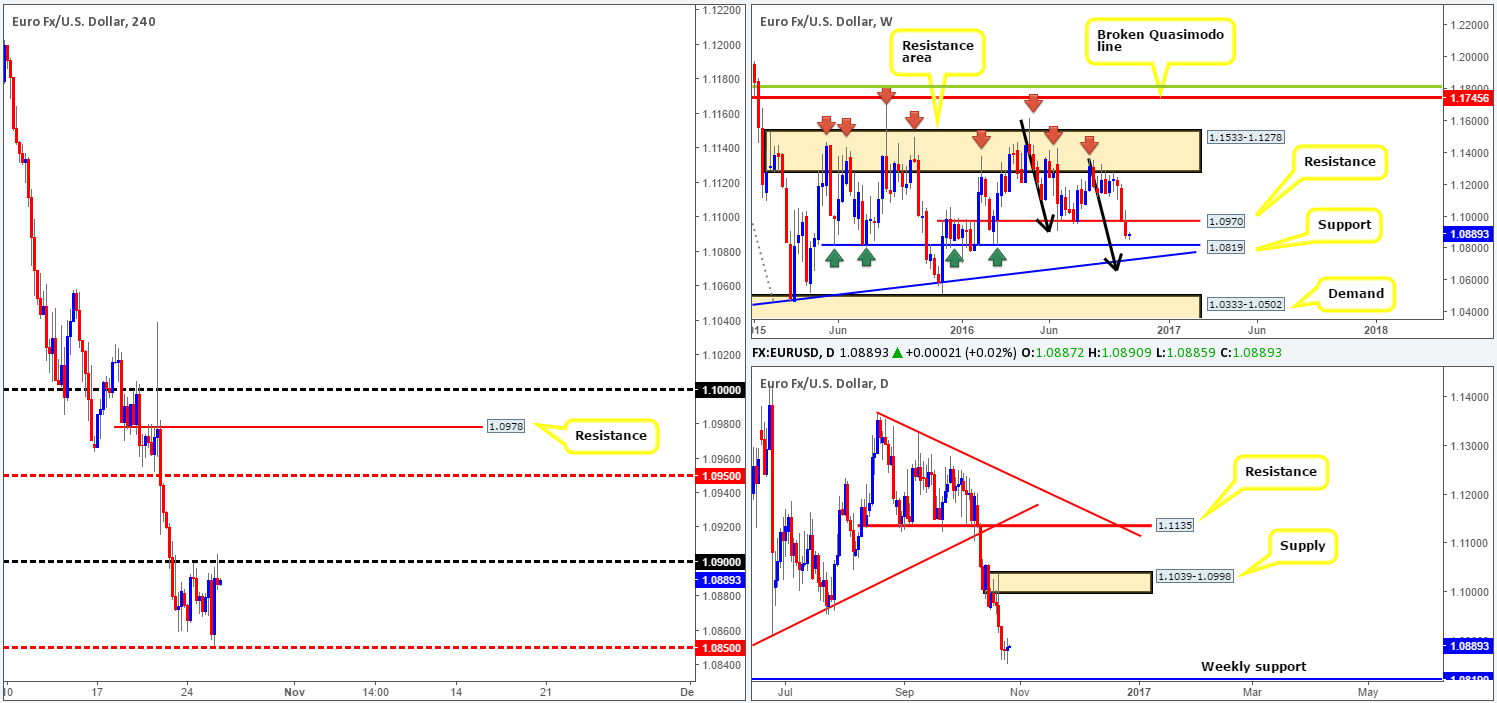
Beginning with a look at the weekly timeframe this morning, the EUR is still seen trading nearby a major support barrier drawn from 1.0819. However, as mentioned in Monday’s weekly outlook, although a bounce from this barrier is likely, just below it we see a long-term trendline support taken from the low 0.8231 and an AB=CD completion point around the 1.0667ish area (black arrows). Therefore, a whipsaw through 1.0819 is something we should all be prepared for prior to serious buyers step in.
Looking down to the daily chart, we can also see that the path south is clear for a drive into the above said weekly support. Perhaps the most compelling factor here is the recent back-to-back indecision candles, which correspondingly represents a bullish engulfing formation.
Stepping across to the H4 chart, the candles appear as though they’re forming somewhat of a consolidation between the 1.09 handle and mid-way support level at 1.0850. Given that both the weekly and daily charts show the path is clear for price to touch gloves with the aforementioned weekly support, we feel, despite the daily bullish engulfing pattern, that price will eventually break below 1.0850 and connect with 1.0819.
Our suggestions: In light of the recently closed H4 candle chalking up a bearish selling wick off the 1.09 mark, we have taken a small position (30% of our usual position) short at 1.0887, hoping that price will, once again, visit the 1.0850 region and maybe even the weekly support 1.0819. Our stop has been set above the wick of the H4 bearish candle at 1.0906.
Levels to watch/live orders:
- Buys: Flat (Stop loss: N/A).
- Sells: 1.0887 ([live] Stop loss: 1.0906).
GBP/USD:
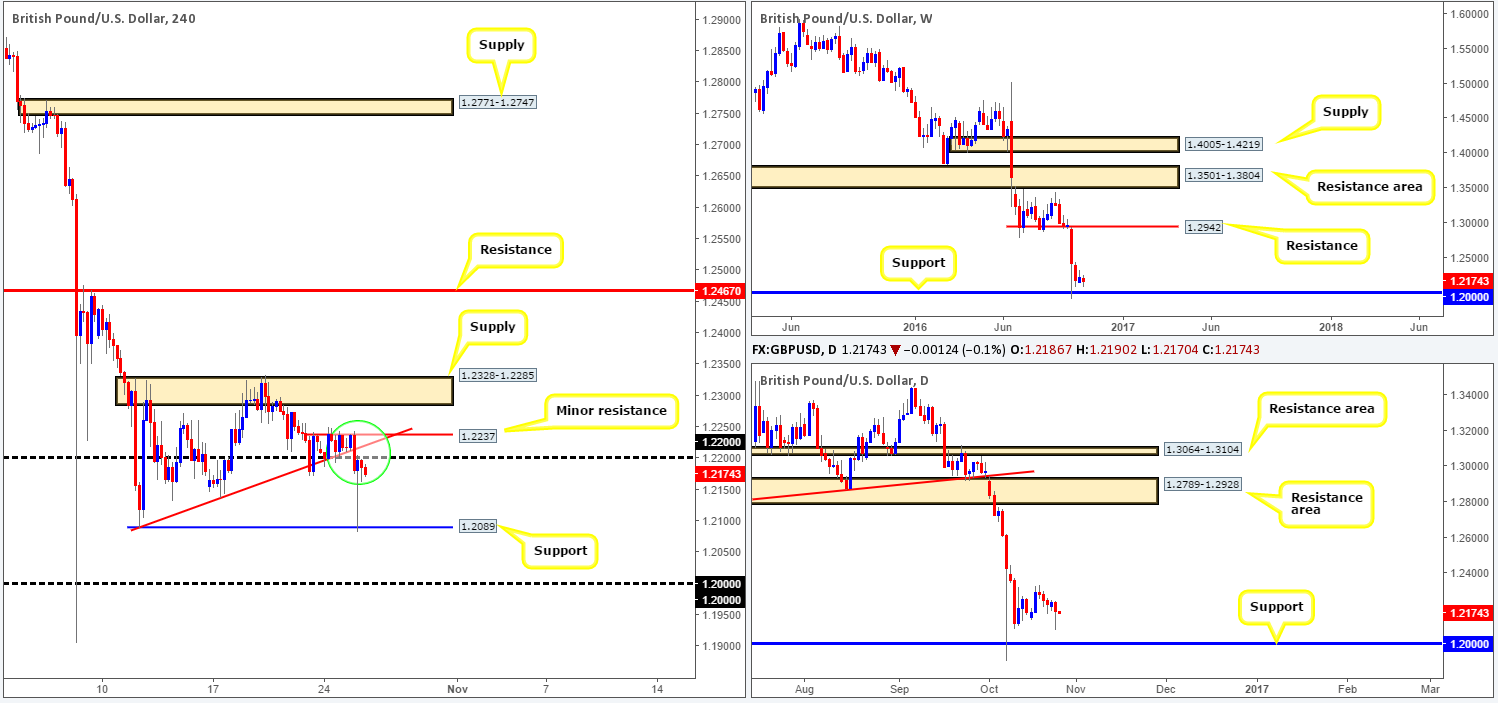
In recent trading, the pound came under fresh pressure mid-way through yesterday’s London session, dropping close to 150 pips in an hour! To our way of seeing things, there were no fundamental catalysts behind the move, other than a muscular dollar (see the US dollar index). As price came into contact with the H4 support at 1.2089, nonetheless, the tables began to turn as the BoE’s Gov. Mark Carney spoke at 2.35pm GMT. Carney suggested that inflation could pick up in early 2017, thus, helping to bid prices higher.
The story on the bigger picture, as we explained in yesterday’s report, is an interesting one. While the majority of market players likely believe the pound could head further south in the future, and we’re not saying it couldn’t, let’s keep in mind that on the monthly chart price has touched base with a major demand, with 1.20 representing the top edge http://fxtop.com/en/historical-exchange-rates-graph-zoom.php?C1=GBP&C2=USD&A=1&DD1=07&MM1=10&YYYY1=1960&DD2=14&MM2=10&YYYY2=2016&LARGE=1&LANG=en&VAR=0&MM1M=0&MM3M=0&MM1Y=0
With that being said, however, we cannot ignore the fact that the GBP’s weekly and daily charts show very little standing in the way of a move back down to 1.20, as well as the trend on this pair clearly pointing in a southerly direction.
Our suggestions: In view of the path south being relatively clear for a push down to 1.20, we really like the minor H4 resistance 1.2237/1.22 handle area for shorts, as it also boasts H4 trendline confluence drawn from the low 1.2089 (green circle). Nevertheless, seeing as we know that sterling has connected with the top edge of a monthly demand, selling this market is considered risky. Therefore, the approach we recommend taking is simply waiting for a reasonably sized H4 bearish candle to form before placing your order. This will at least give some confirmation that the bears have interest here.
Levels to watch/live orders:
- Buys: Flat (Stop loss: N/A).
- Sells: 1.2237/1.22 region ([H4 bearish close required prior to pulling the trigger] Stop loss: ideally beyond the trigger candle).
AUD/USD:
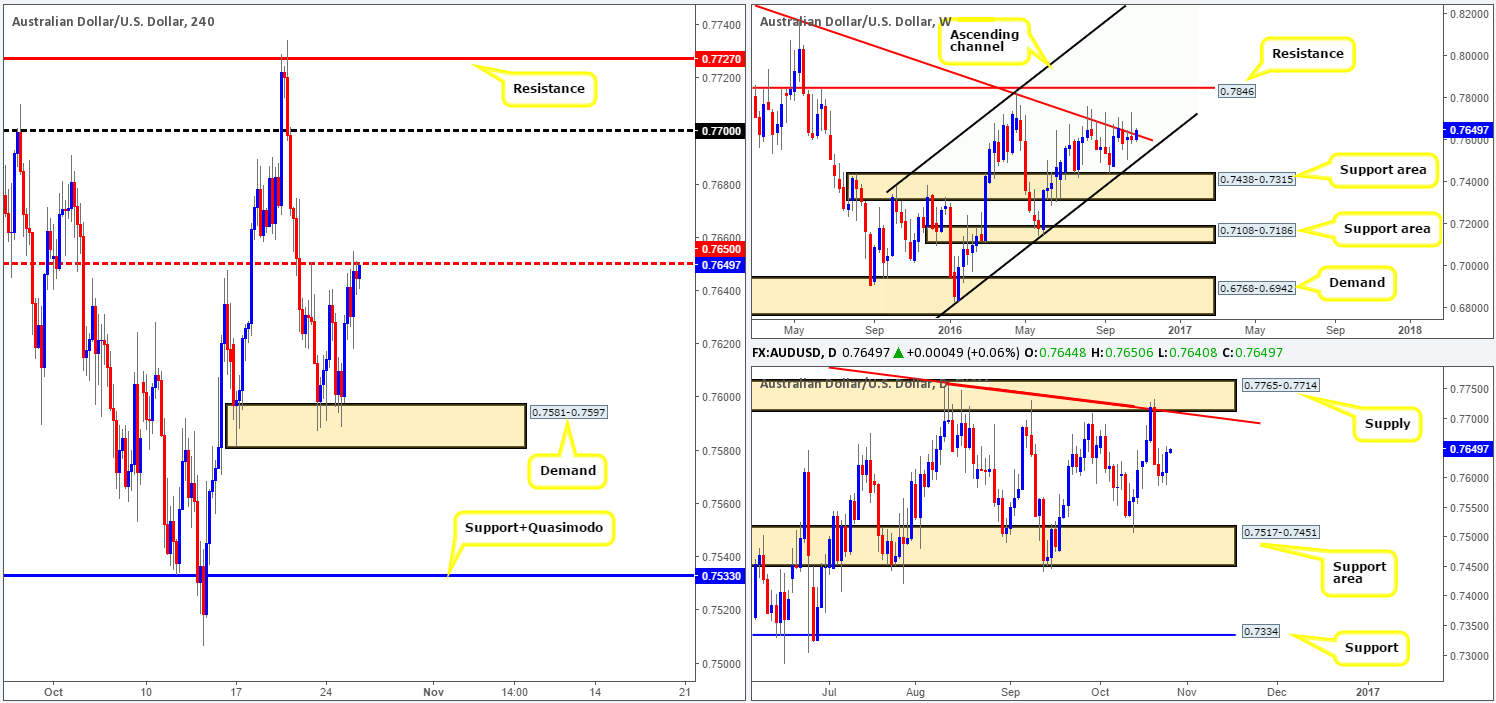
The buyers managed to find their feet early on in the day yesterday, as the Aussie rallied nicely from a H4 demand base coming in at 0.7581-0.7597.The move from this barrier, bolstered by an advance over in the gold market, saw price shake hands with the H4 mid-way resistance 0.7650 going into the US segment.
What this recent bout of buying also did was chalk up a daily bullish engulfing candle mid-way between a daily support area at 0.7517-0.7451 and a daily supply zone given at 0.7765-0.7714 (intersects with a daily trendline resistance taken from the high 0.7835). Furthermore, the weekly candle is now seen trading beyond the weekly trendline resistance extended from the high 0.8295.
Our suggestions: In less than 30 minutes, traders will turn their focus to the Aussie CPI print for the third quarter, which is considered a high-impacting event. Therefore, we would recommend laying low for the time being and reassessing 30 or so minutes post release.
Technically, however, there is room beyond 0.7650 up to the 0.77 handle and H4 resistance at 0.7727, which, as you can probably see, fuses with the above said daily supply area. Therefore, a close above 0.7650 could be considered a bullish cue to trade north towards the 0.77 region. Moreover, 0.77/0.7727 could also be considered an area to take a short position from. These setups, although technically valid, depend on how price action responds to the upcoming Australian inflation data.
Levels to watch/live orders:
- Buys: Flat (Stop loss: N/A).
- Sells: Flat (Stop loss: N/A).
USD/JPY:
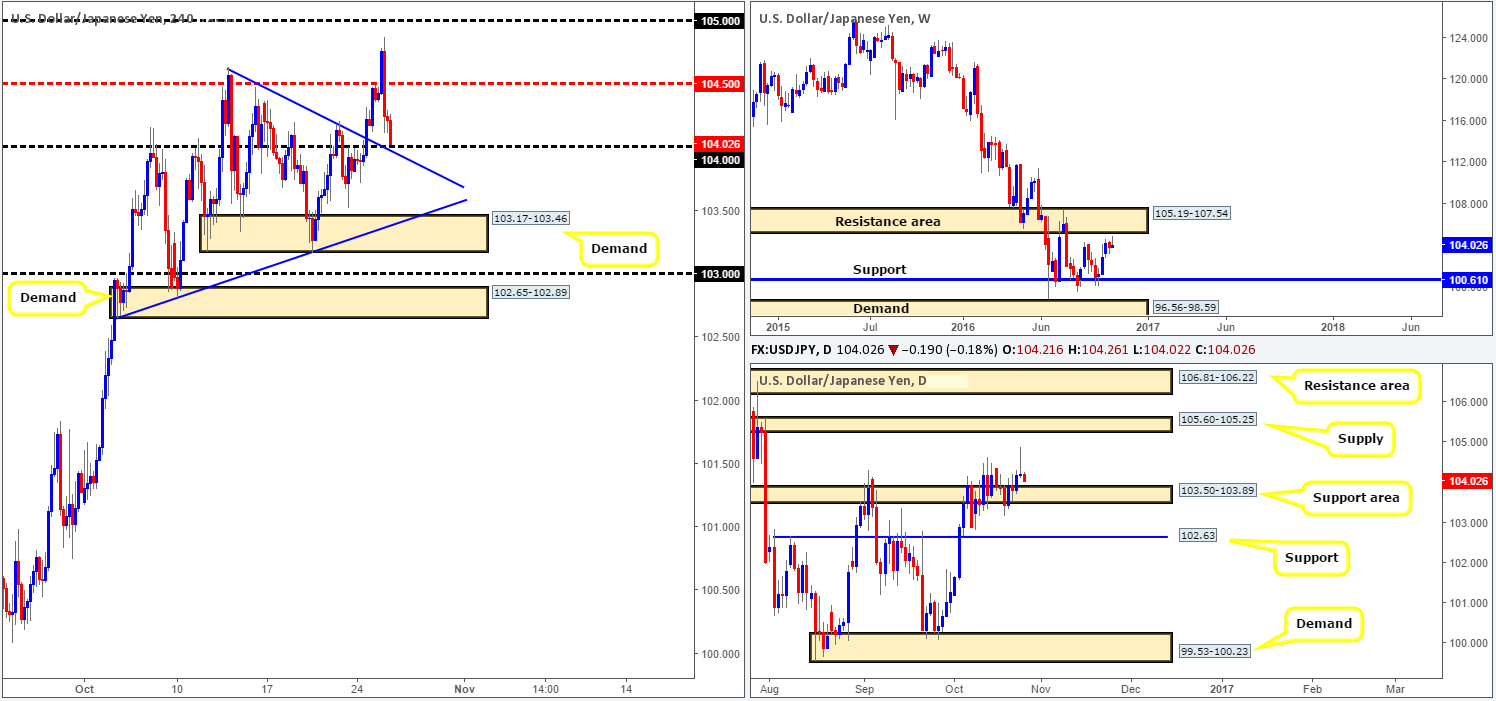
The aftermath of yesterday’s disappointing US consumer confidence data saw the USD/JPY tumble lower, consequently breaking back below the H4 mid-way support 104.50, and closing the day just ahead of the 104 handle (intersects with trendline support taken from the high 104.63).
Yesterday’s action clocked a high of 104.87, thirty pips shy of the weekly resistance area coming in at 105.19-107.54, before turning south. This, as you can see from the daily chart, printed a beautiful-looking daily bearish selling wick. However, as tempting as this pin-bar may appear, the important thing to consider here is that this pattern formed just ahead of a daily support area at 103.50-103.89.
Our suggestions: This is a relatively difficult market to read at the moment. On the one hand, given how close price came to connecting with the above said weekly resistance area, we could say that the bears may have taken control and will likely push on lower. On the other hand, the 104 handle that intersects with the aforementioned H4 trendline support could be an area where price may bounce from, since it is positioned above the daily support area at 103.50-103.89.
Ideally, we would like to see price rally from its current position to connect with the daily supply at 105.60-105.25. Since this area is located within the above said weekly resistance area, we would be confident to begin hunting for shorting opportunities. However, at current price, we feel remaining on the sidelines might be the better path to take today due to the conflicting signals seen between the three timeframes.
Levels to watch/live orders:
- Buys: Flat (Stop loss: N/A).
- Sells: Flat (Stop loss: N/A).
USD/CAD:
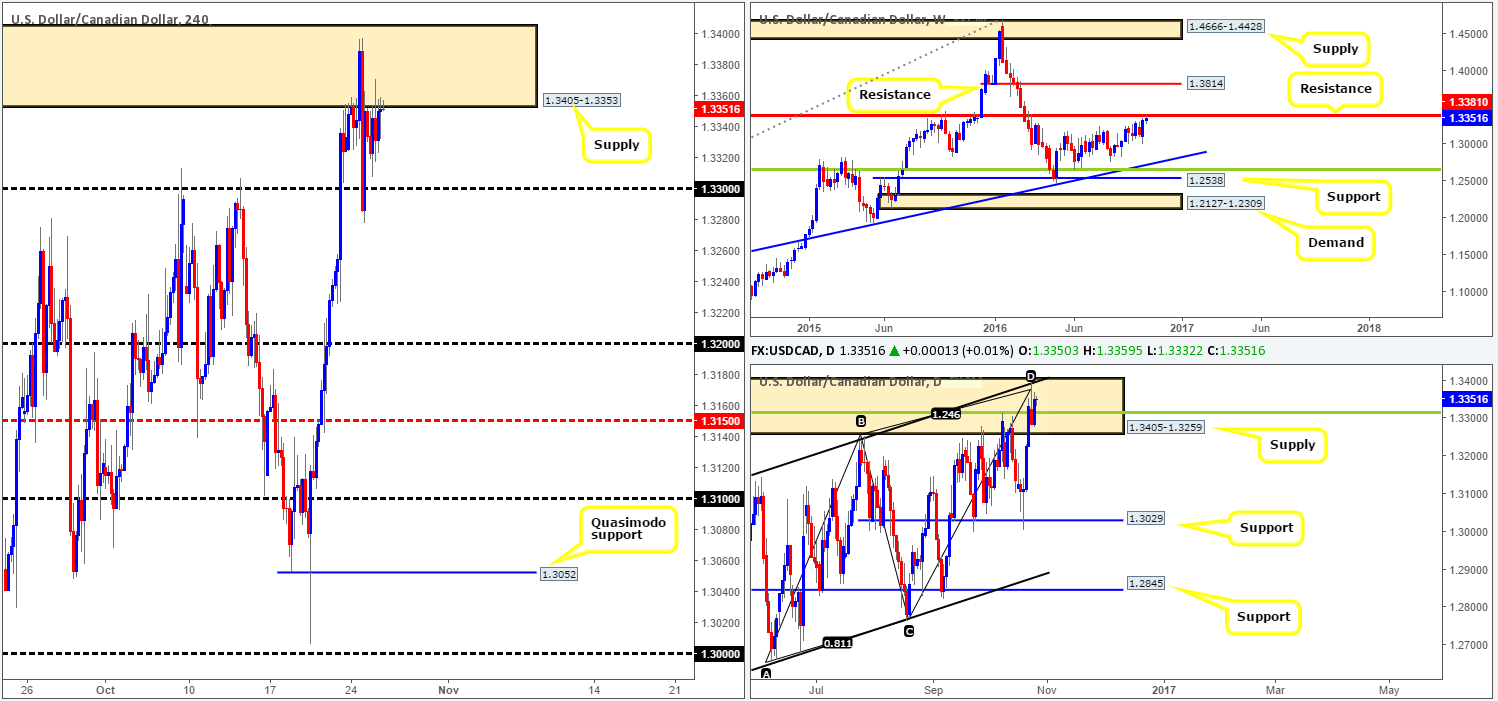
After price nudged back into the underside of the H4 supply at 1.3405-1.3353 on Monday, the action has somewhat stagnated. Despite this, our team remains short at 1.3315 with the stop positioned above the daily supply (1.3405-1.3259) at 1.3407, as we feel this market is overbought. The reasoning largely comes from the higher-timeframe structures. Weekly price recently locked horns with a resistance level coming in at 1.3381, as well as daily price seen trading deep within a supply zone at 1.3405-1.3259. Furthermore, there’s a strong-looking daily convergence point seen within this supply made up of: a 38.2% Fib resistance level at 1.3315 (green line), the weekly resistance level at 1.3381, a channel resistance taken from the high 1.3241 and an AB=CD completion point around the 1.3376ish range.
Our suggestions: Due to the lackluster performance seen yesterday, the outlook for the loonie remains the same. For traders who also believe that the pair is overbought, we would advise waiting for a close below 1.33 to confirm downside. Following this, a retest to the underside of this number along with a reasonably sized H4 bearish candle would, in our view, make for a beautiful shorting opportunity down to 1.32. Should this come to fruition, we will also look to pyramid our current position.
On the data front, we have the Crude oil inventories release due at 2.30pm GMT today. Due to Canada being a large exporter of oil to the US, this indicator can affect the pair’s exchange rate, so remain vigilant during this time.
Levels to watch/live orders:
- Buys: Flat (Stop loss: N/A).
- Sells: 1.3315 ([live] Stop loss: 1.3407). Watch for a close below the 1.33 handle and then look to trade any retest seen thereafter (H4 bearish close required prior to pulling the trigger).
USD/CHF:
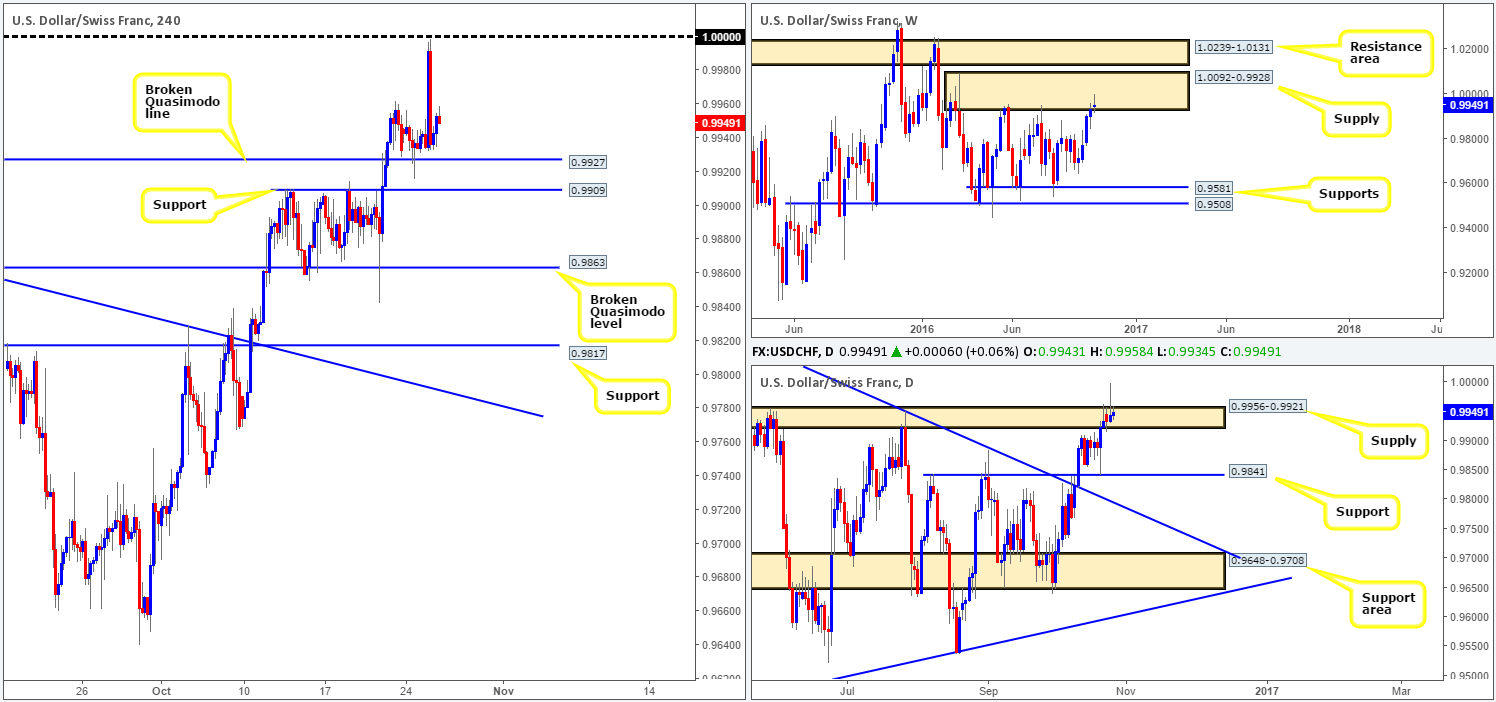
As the US dollar edged higher against the majority of its major counterparts, the USD/CHF managed to reach highs of 0.9998 going into the early hours of the US session (two pips shy of parity [1.0000]), before selling off on the back of disappointing US consumer data. From a technical standpoint, both the weekly and daily charts denote overbought trading conditions. Up on the weekly chart, the candles are trading around the lower edge of a supply zone fixed at 1.0092-0.9928, while down on the daily chart, the Swissy is now trading from within a supply area formed from 0.9956-0.9921, along with a bearish selling wick printed during yesterday’s action.
While the bigger picture suggests lower prices may be on the cards, selling right now would not be something our team would sign off on. Reason being is simply because the pair is trading nearby a H4 broken Quasimodo line at 0.9927 and a H4 support just below that at 0.9909.
Our suggestions: To become sellers, we require a decisive close below the H4 support at 0.9909. As far as entry is concerned, a retest to the underside of 0.9909 is required followed by a H4 bearish close before pulling the trigger, with a target objective seen at 0.9863: a H4 broken Quasimodo line – located just above a daily support at 0.9841.
Levels to watch/live orders:
- Buys: Flat (Stop loss: N/A).
- Sells: Watch for a close below the H4 support at 0.9909 and then look to trade any retest seen thereafter (H4 bearish close required prior to pulling the trigger).
DOW 30:
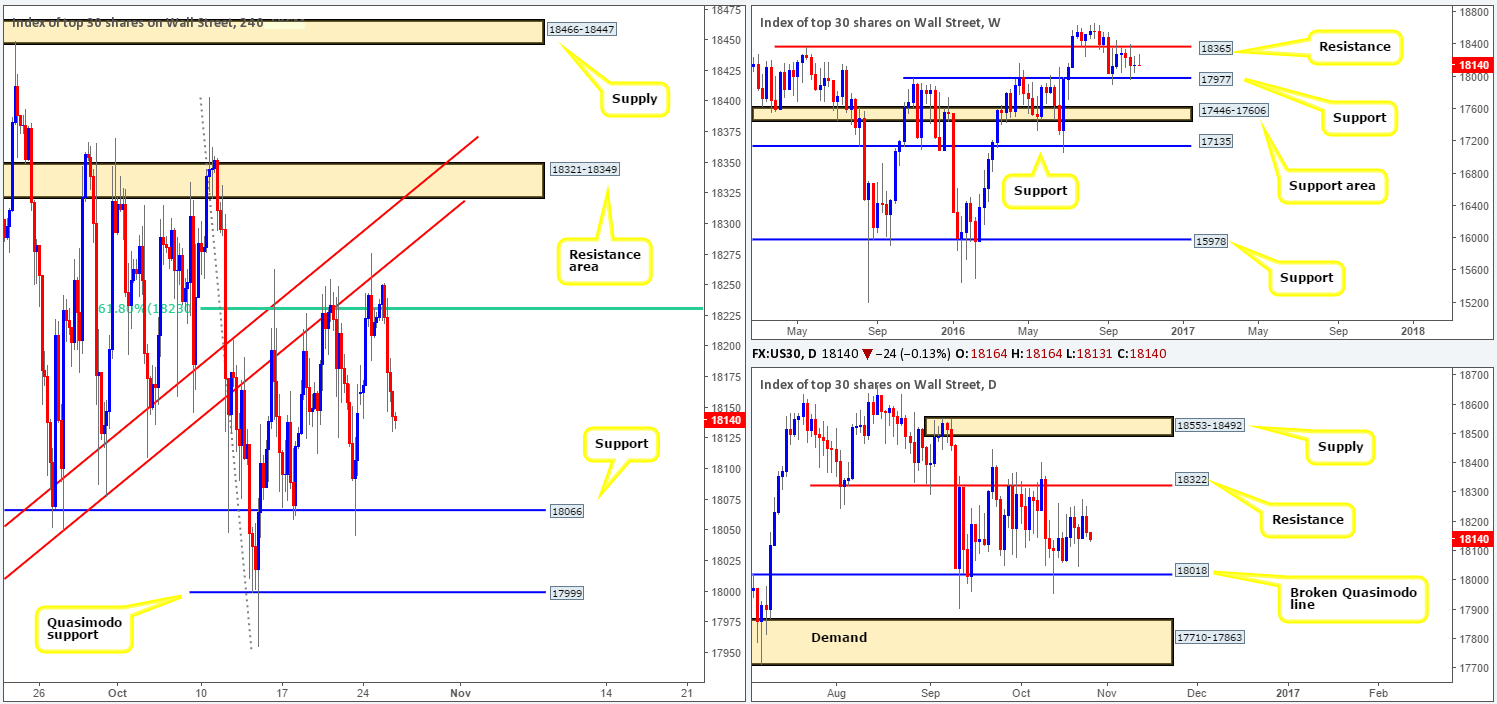
At the time of writing, the DOW remains locked between a H4 61.8% Fib resistance level at 18230 (bolstered by a trendline resistance chalked up from the low 17959) and a H4 support registered at 18066. According to Bloomberg, the latest selloff was due to disappointing results from fast-food chains to makers of appliances, sports apparel and home-renovation products.
With the H4 candles looking as though they’re on course to collide with the above said support, where do we stand in the bigger picture? Well, since September 12, the weekly candles have been sandwiched between a resistance drawn from 18365 and a support level coming in at 17977. If this support is consumed, the support area at 17446-17606 would likely be the next objective to reach. A push above the resistance level on the other hand, could signal that the bulls are ready to strike fresh highs and continue trading northbound. In a similar fashion to the weekly chart, the daily candles are seen consolidating between a resistance at 18322 and a broken Quasimodo line penciled in at 18018. A violation of this Quasimodo boundary would likely lead to a test of the demand base seen at 17710-17863, whereas a break above the resistance could force price to connect with supply carved from 18553-18492.
Our suggestions: Despite the consolidating price action we’re seeing in this market, we have no interest in trying to trade the H4 range edges, since they boast little higher-timeframe confluence. Instead, as we have mentioned several times in previous reports, the only areas we have interest in at the moment is the H4 Quasimodo support at 17999 and the H4 resistance area at 18321-18349. The Quasimodo is attractive because it fuses with nearby weekly support at 17977 and also the daily broken Quasimodo line at 18018.The resistance zone, however, is equally attractive since it houses the daily resistance level at 18322 and is located just below weekly resistance at 18365.
However, to avoid being stopped out by one of those dreaded whipsaws; we’d recommend waiting for a H4 close prior to risking capital at these areas.
Levels to watch/live orders:
- Buys: 17999 ([H4 bullish close required prior to pulling the trigger] Stop loss: ideally beyond the trigger candle).
- Sells: 18321-18349 ([H4 bearish close required prior to pulling the trigger] Stop loss: ideally beyond the trigger candle).
GOLD:
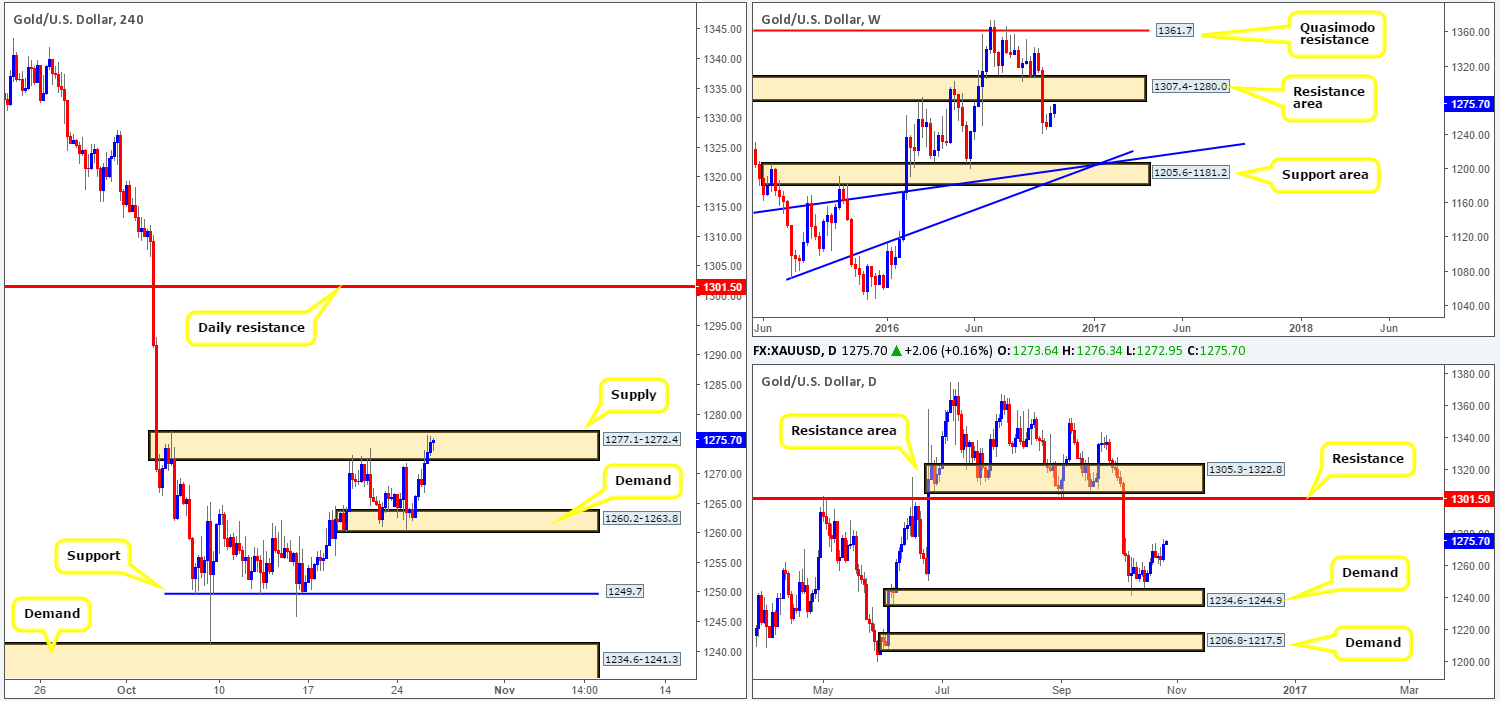
Recent action shows that the yellow metal extended its bounce north from H4 demand at 1260.2-1263.8 up to the H4 supply base coming in at 1277.1-1272.4, where the buyers and sellers are currently seen battling for position. This recent advance can likely be credited to safe-haven buying amid uncertainty surrounding the US equity market, and speculation that demand will be boosted by the Diwali festival in India, the world’s largest bullion-consuming country after China, according to Bloomberg.
To explain our thoughts regarding this market, we feel it’s best to begin from the top. The weekly candle is now within shouting distance of testing the underside of a resistance area drawn from 1307.4-1280.0. Our read on the daily chart shows that demand at 1234.6-1244.9 is currently providing this market with support. In the event that bullion continues to be favored here, we may see price shake hands with resistance at 1301.5, seen located relatively deep within the above mentioned weekly resistance area.
A break above the H4 supply at 1277.1-1272.4 is something our team is interested in seeing. The reason being is that beyond this barrier, the pathway north on the H4 is clear up to the aforementioned daily resistance. As such, should price retest this boundary as demand (after a close higher) followed by a reasonably sized H4 bull candle, one could look to go long from here targeting the daily level. However, do remain aware that by entering long from here, even with the confirmation of a H4 bull candle, you’re effectively buying directly into a weekly resistance area.
Our suggestions: Buying above the current H4 supply is, we agree, a risky trade. The buyers, however, are clearly growing in confidence here, and could potentially push prices up to the daily resistance given the river of space seen beyond current H4 supply area.
Levels to watch/live orders:
- Buys: Watch for a close above the H4 supply at 1277.1-1272.4 and then look to trade any retest seen thereafter (H4 bullish close required prior to pulling the trigger).
- Sells: Flat (Stop loss: N/A).


