
Key risk events today:
Australia Construction Work Done q/q; US Core Durable Goods Orders m/m and Durable Goods Orders m/m; (CAD) Gov. Council Member Wilkins Speaks; Crude Oil Inventories.
(Previous analysis as well as outside sources – italics).
EUR/USD:
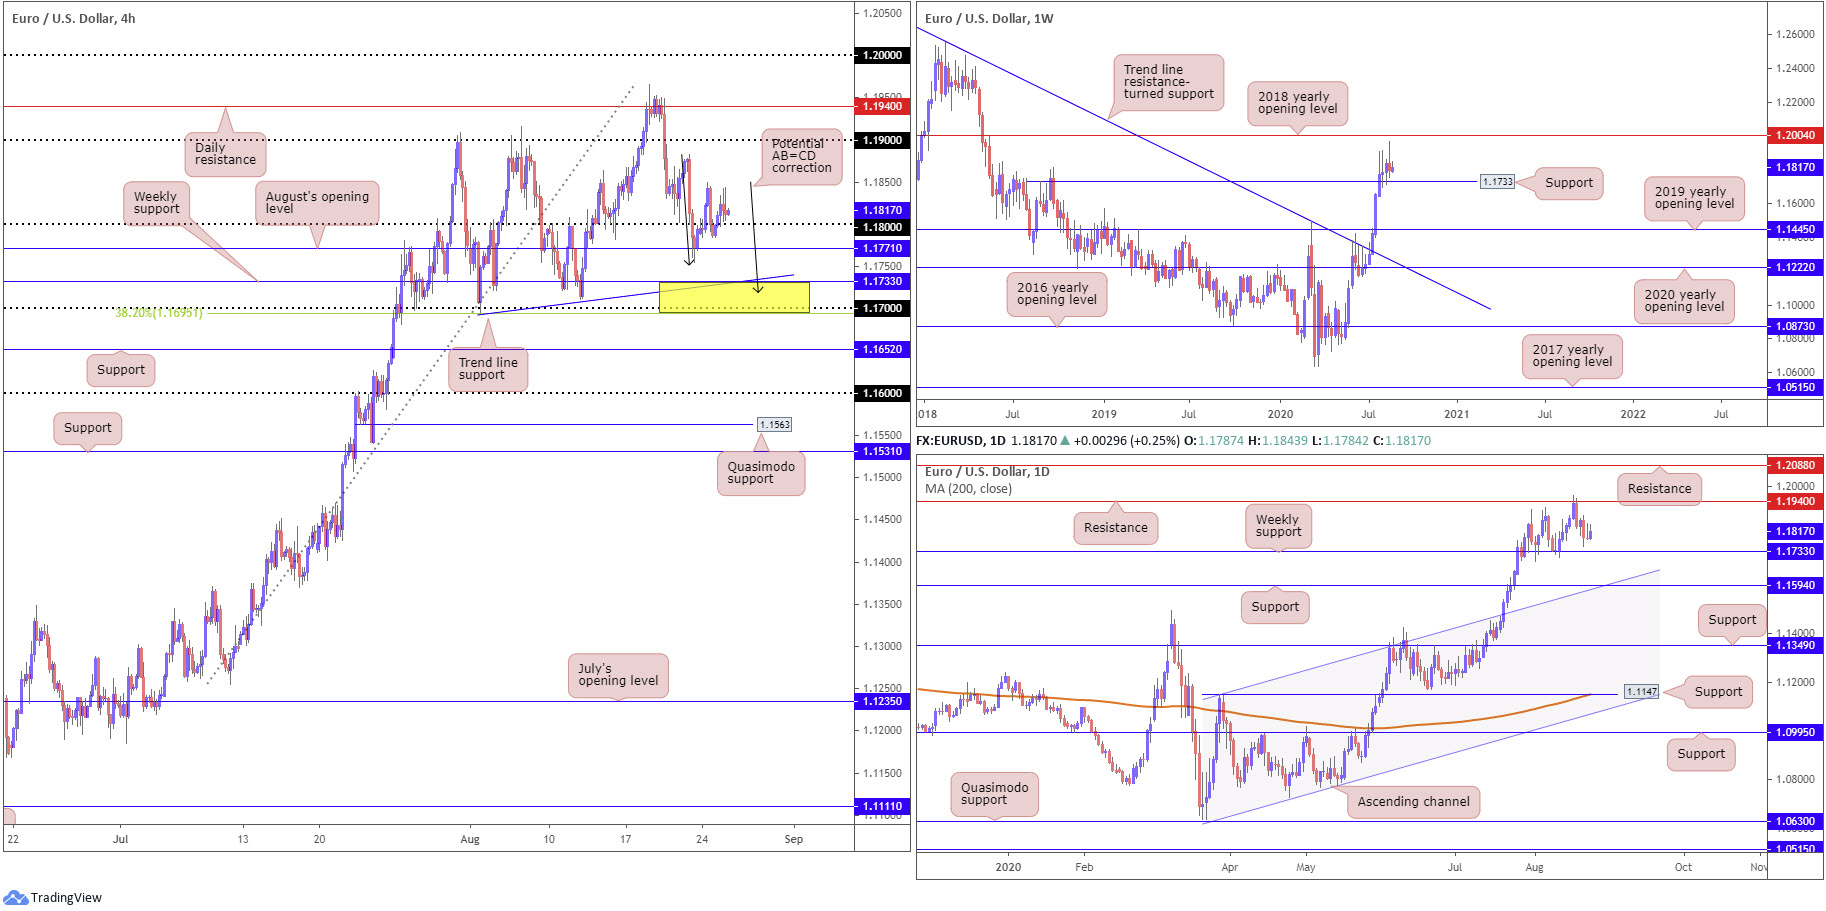
Europe’s shared currency pencilled in a modest upside bias Tuesday amid renewed USD selling, despite US Treasury yields circling higher.
While Tuesday took EUR/USD back above 1.18, off August’s opening level at 1.1771, buyers clearly lack enthusiasm on the H4 timeframe. To the upside, we can see last Friday’s peak at 1.1882 in place as potential resistance, followed by the 1.19 handle.
Assuming we reconnect with 1.1771, dipping to weekly support at 1.1733 may be in the offing. Based on the H4 timeframe, there are a number of technical elements that support the current weekly level, such as trend line support, extended from the low 1.1695, a possible AB=CD correction (black arrows) at 1.1716, the round number 1.17 and a 38.2% Fibonacci retracement ratio plotted at 1.1695.
Technical structure on the weekly timeframe still remains unchanged – here’s a reminder of Monday’s technical briefing:
Having the US dollar index mildly snap an eight-week bearish phase, EUR/USD curled south of the 2018 yearly opening level at 1.2004 last week, also modestly snapping an eight-week bullish phase.
Support at 1.1733, a prior Quasimodo resistance level, therefore, is now back on the radar, which may be of interest to buyers, considering the recent break of trendline resistance (July 13), extended from the high 1.2555. A 1.1733 breach, on the other hand, unlocks a possible bearish theme towards the 2019 yearly opening level at 1.1445.
Although Tuesday popped higher, the technical picture also remains unchanged from Monday on the daily timeframe:
Resistance at 1.1940 was brought to attention during mid-week trade last week, putting an end to a six-day bullish phase. Deprived of notable support, Friday headed lower and concluded the week within striking distance of weekly support mentioned above at 1.1733. Breaking 1.1733 on the daily timeframe may witness sellers strengthen their grip and approach support coming in at 1.1594, a level fusing with channel resistance-turned support, taken from the high 1.1147.
Areas of consideration:
Outlook unchanged.
While August’s opening level at 1.1771 or even the 1.18 band on the H4 may contain downside today, the more prominent area of support, as underscored in Monday’s technical briefing, rests between the 1.1695/1.1733 region (yellow). Not only does the zone gift appealing H4/weekly confluence (see above), the current trend in this market points north.
GBP/USD:
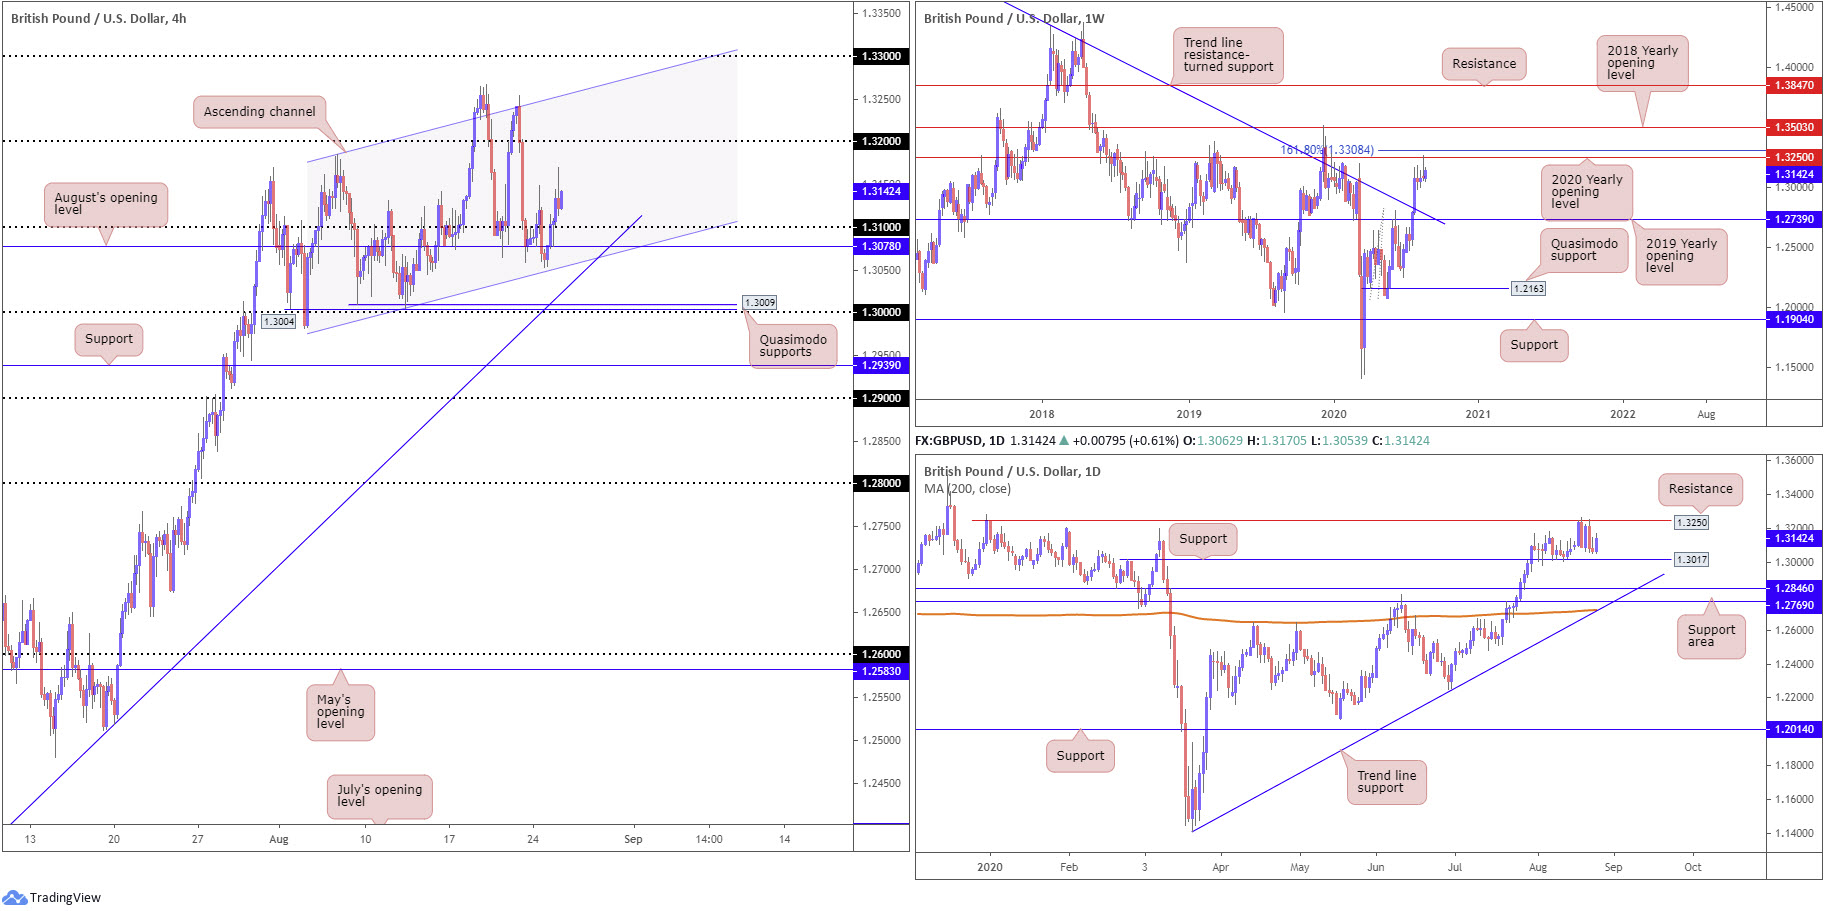
GBP/USD shrugged off significantly weaker-than-expected CBI distributive sales on Tuesday, setting fresh pinnacles north of the 1.31 handle at 1.3170. Overall, the H4 candles are seen encased within an ascending channel, extended from 1.3005/1.3185, with nearby territory perhaps now cleared to the 1.32 handle. Outside of the current channel support, however, trend line support, taken from the low 1.2251, is seen close by, with a break exposing two Quasimodo supports at 1.3004 and 1.3009.
After shaking hands with the 2020 yearly opening level at 1.3250 on the weekly timeframe, a level sited just under a 161.8% Fibonacci extension point at 1.3308, price movement crossed lower last week. This follows a July 27 trend line resistance (1.5930) break. Candlestick enthusiasts will also note the week ended in the shape of a gravestone doji candlestick formation, considered a bearish signal at peaks. Retreating further, despite recent buying, may hand over the 2019 yearly opening level at 1.2739 as a possible downside target, which happens to fuse closely with the recently penetrated trendline resistance.
In addition to the above, daily price recently crossed swords with resistance at 1.3250, a barrier sharing the same space with resistance on the weekly timeframe, the 2020 yearly opening level. Should sellers continue defending current resistance, the spotlight shines towards a daily support marked at 1.3017, a prior Quasimodo resistance level, followed by an area of support between 1.2769/1.2846. This, as you can see, is closely positioned with trend line support, taken from the low 1.1409, and a 200-day SMA (orange – 1.2719).
Areas of consideration:
Sellers have so far been reasonably slow to respond off the 1.3250 higher timeframe resistance, perhaps intimidated by the current uptrend and neighbouring daily support at 1.3017.
Also having seen H4 candles make their way back above 1.31, intraday buyers may seek bullish scenarios today, targeting the 1.32 handle. Conservative players are likely watching for a 1.31 retest to emerge before pulling the trigger.
AUD/USD:
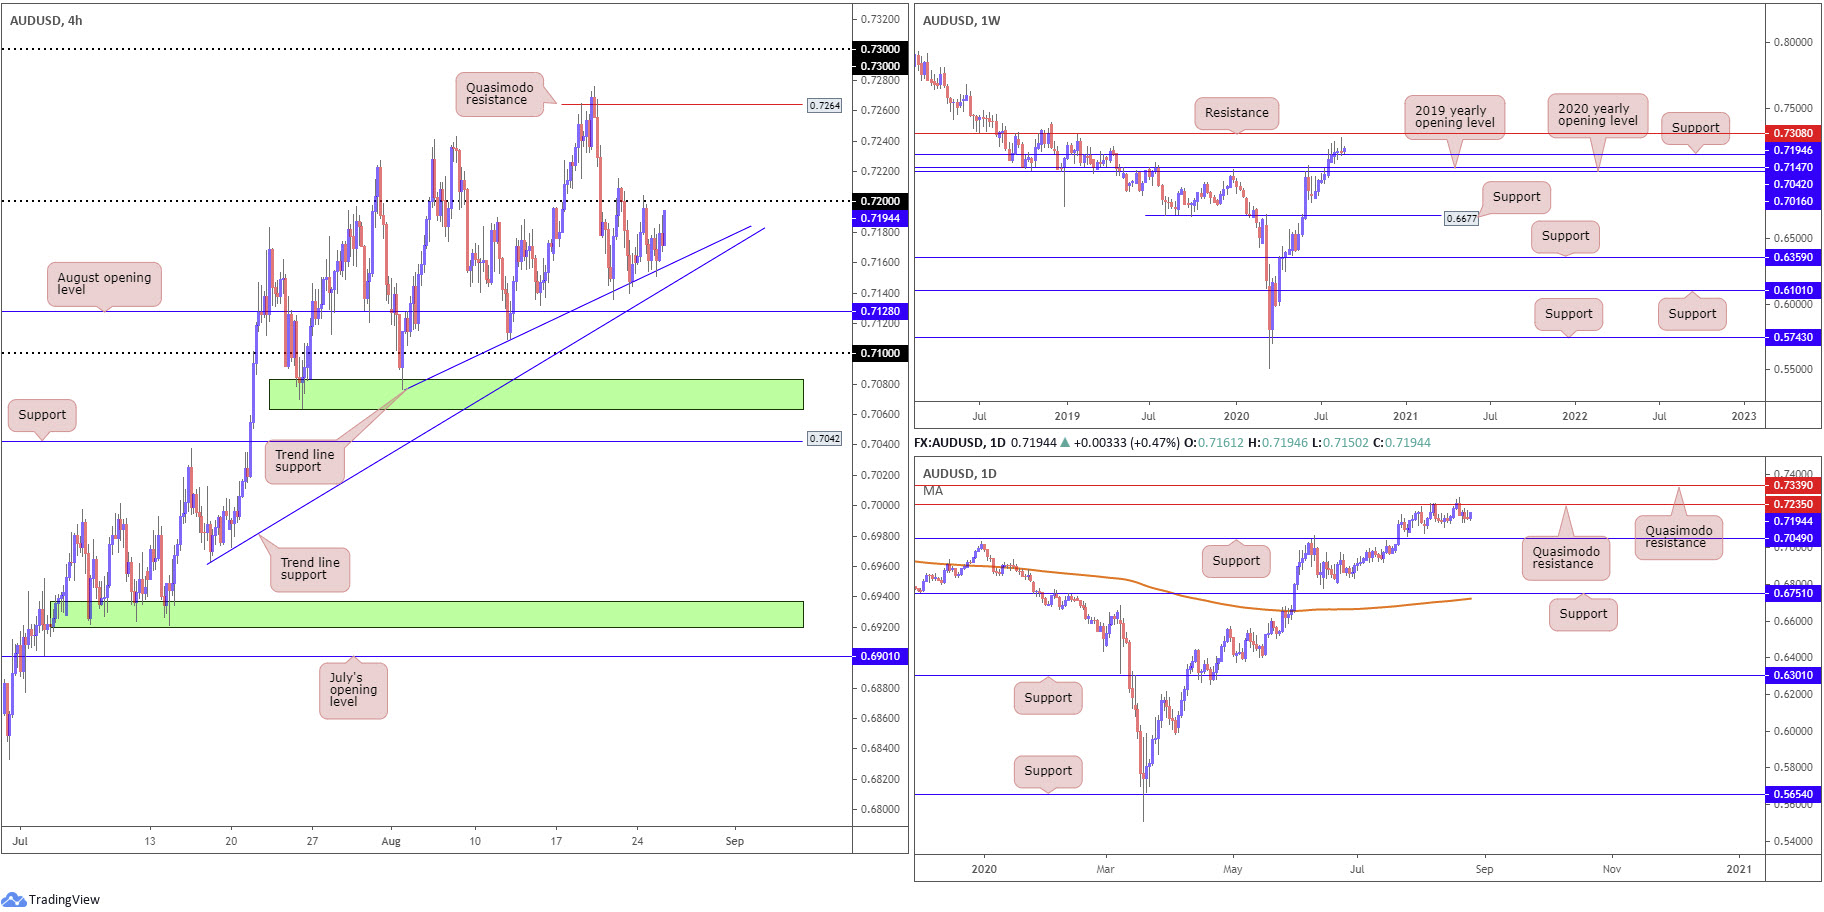
Short-term flow, based on the H4 timeframe, remains enclosed between the 0.72 handle and a trend line support, taken from the low 0.7076. Technically speaking, buyers appear to have the upper hand here as sellers have been unable to record fresh lows off 0.72. Crossing into 0.72+ terrain today could have price ascend to H4 Quasimodo resistance at 0.7264, with a break perhaps clearing to 0.73.
Support coming in at 0.7147, based on the weekly timeframe, is clearly aiding bullish momentum at the moment, with the chart exhibiting scope to as far north as resistance at 0.7308. Potentially hindering breakout strategies above 0.72 on the H4 timeframe, nevertheless, is daily Quasimodo resistance at 0.7235, a level hampering upside since early August, despite the immediate trend facing northbound.
Areas of consideration:
Breaking 0.72 today possibly confirms technical upside to at least 0.7235, with further upside recognising H4 Quasimodo resistance at 0.7264, and maybe 0.73. Note the latter converges closely with weekly resistance at 0.7308, therefore active sellers may lie in wait here.
To help secure bullish strategies above 0.72, this may involve drilling down to the lower timeframes in order to realise satisfactory risk/reward to 0.7235.
USD/JPY:
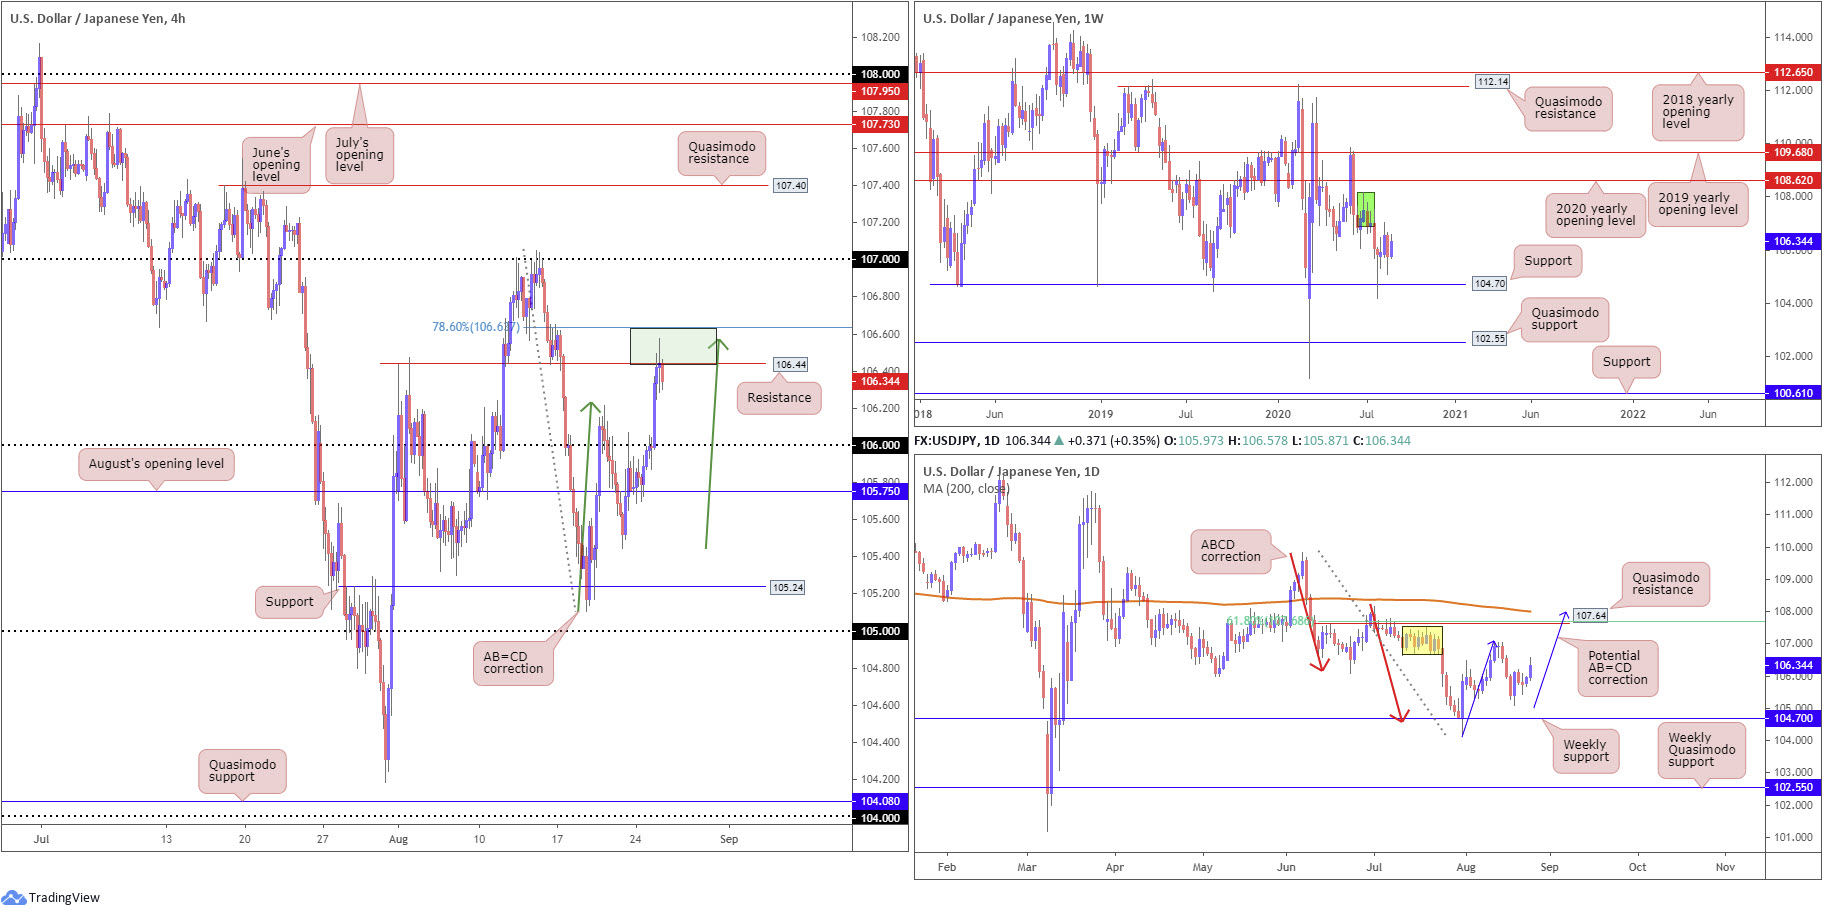
Kicking things off from the weekly timeframe, we can see supply remains prominent at 108.16-106.88 (green) after price made its way off support at 104.70 into the end of July. The 2020 yearly opening level at 108.62 and, at a push, the 2019 yearly opening level at 109.68, may enter view should additional upside take over.
Last Wednesday’s rebound, as mentioned in recent analysis, could be the beginnings of a D-leg to a possible AB=CD bearish correction (blue arrows) at 108.00, while a dip may draw in weekly support mentioned above at 104.70. Serving nearby the AB=CD structure, traders will also find Quasimodo resistance positioned nearby at 107.64, along with a 61.8% Fibonacci retracement ratio at 107.68 and the 200-day SMA (orange – 108.00).
Despite USD weakness Tuesday, USD/JPY rose to fresh peaks at 106.57, seemingly bolstered on rising US Treasury yields. H4 engulfed 106 to the upside and crossed swords with an interesting area of resistance, made up between resistance at 106.44, AB=CD resistance (green arrows) at 106.57 and a 78.6% Fibonacci retracement ratio at 106.64.
Areas of consideration:
The resistance area on the H4 between 106.64/106.44 (green), as you can see, is currently attracting sellers. This area, as stated in recent reports, represented an upside target for longs north of 106 and may contain enough energy to swerve things back to 106.
Longer-term traders, however, are still likely watching for more bullish momentum to form, perhaps completing the AB=CD configuration on the daily timeframe.
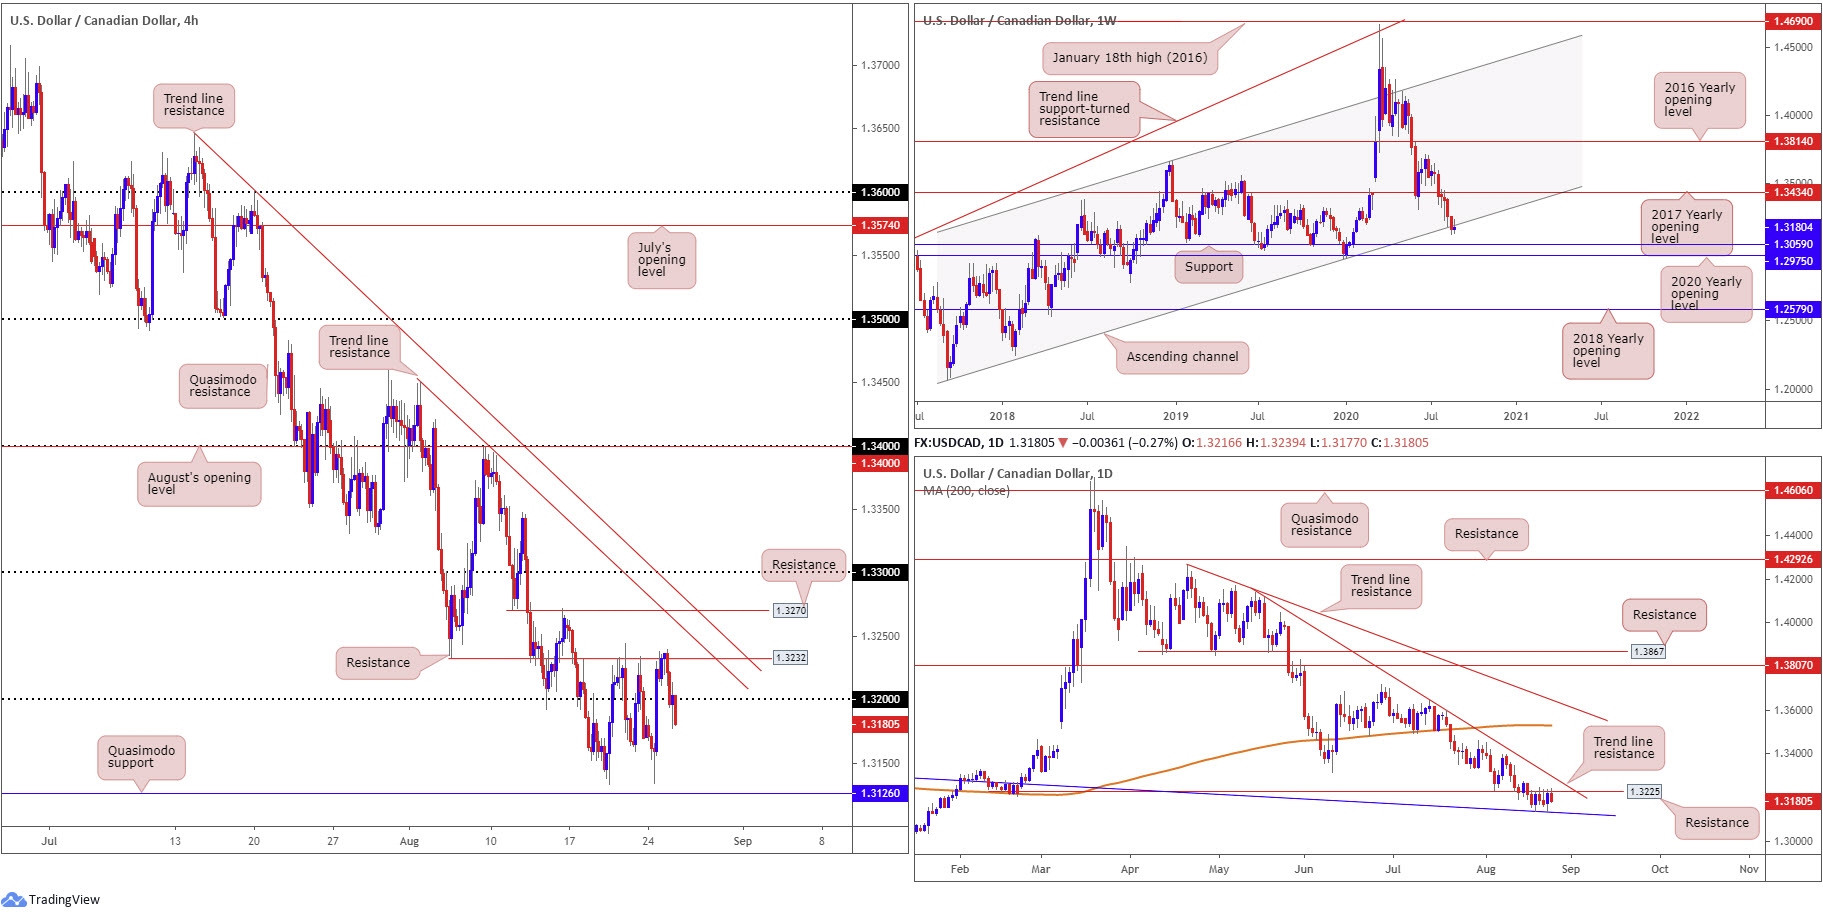
USD/CAD:
With DXY poised to overthrow 93.00 to the downside and WTI trading positive above $43.00 a barrel, USD/CAD reversed from familiar H4 resistance at 1.3232 on Tuesday. Downside pressure squeezed buyers from 1.32 support and threw H4 Quasimodo support at 1.3126 back into the spotlight.
H4 resistance mentioned above at 1.3232 boasts a close connection with daily resistance at 1.3225, a prior Quasimodo support level. This could have daily movement knocking on the door of a trend line resistance-turned support, extended from the high 1.3382.
Also of interest on the weekly timeframe, long-term channel support, taken from the low 1.2061, is seen under pressure, with traders potentially leaning towards support at 1.3059.
Areas of consideration:
This market, technically speaking, reflects an air of weakness as we head into Wednesday. The weekly timeframe recently delivered action beneath channel support, with daily resistance also side-lining hopes of climbing higher. This, as well as H4 turning through 1.32 along with the immediate trend in this market positioned lower, sets the technical stage for possible bearish themes today, targeting H4 Quasimodo support at 1.3126, a level conveniently aligning with daily trend line support.
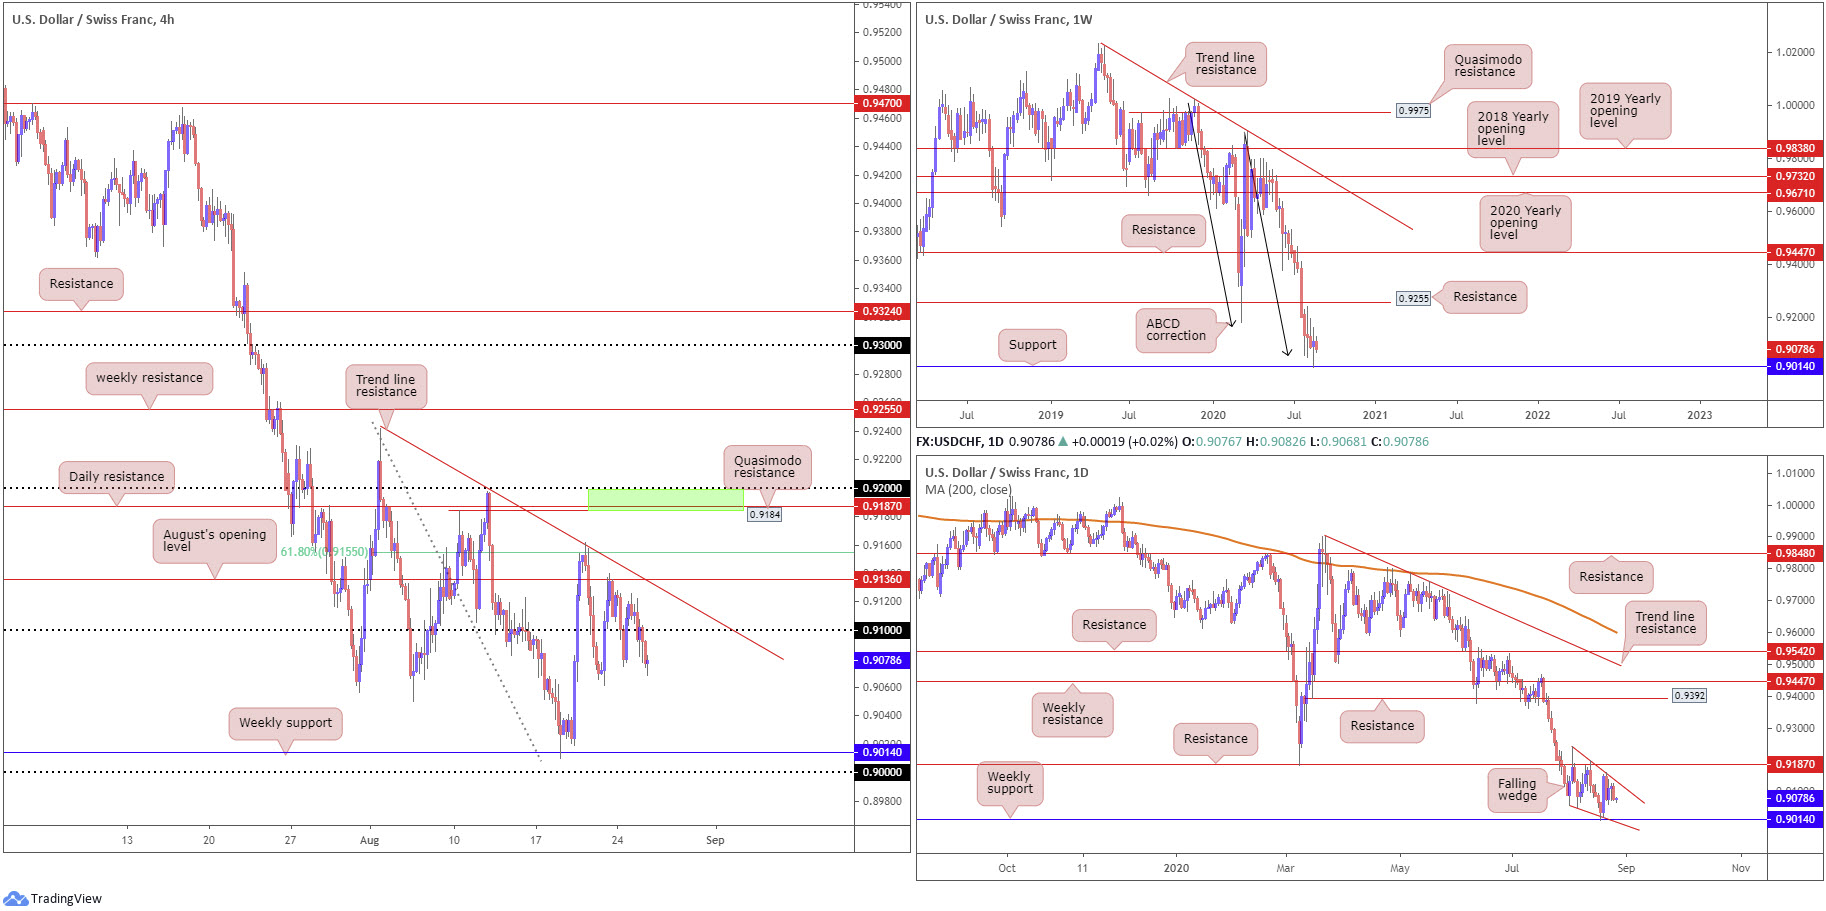
USD/CHF:
For traders who read Tuesday’s technical briefing you may recall the following points (italics):
Recent analysis discovered support on the weekly timeframe at 0.9014, a level garnering additional impetus from ABCD support at 0.9051 (black arrows). This shines the spotlight on resistance at 0.9255, a prior Quasimodo support level. Beyond current support, the next layer of support is not visible until reaching 0.8792.
Out of the daily timeframe, we can see price action presenting a falling wedge pattern, pencilled in from the high 0.9241 and a low of 0.9056. Penetrating this pattern to the upside, preferably also taking out resistance at 0.9187, might be enough to persuade a reversal and attempt an approach to at least weekly resistance mentioned above at 0.9255, followed by the falling wedge take-profit target (can be measured once a breakout occurs).
From the H4 timeframe, Tuesday settled 25 pips south of 0.91 after failing to reach for August’s opening level at 0.9136 and nearby trend line resistance, drawn from the high 0.9241. Above 0.9136, we see a 61.8% Fibonacci retracement ratio at 0.9155, followed by Quasimodo resistance at 0.9184, a level buffered by daily resistance underscored above at 0.9187.
Areas of consideration:
Outlook unchanged.
The rebound from weekly support at 0.9014 is significant in this market, particularly as it’s joined with a falling wedge pattern on the daily timeframe. To take advantage of higher timeframe structure, based on the H4 timeframe, a H4 close above 0.92 is needed, targeting weekly resistance at 0.9255.
Although prospective buyers may be watching for a break above 0.92, the area made up between 0.92, the H4 Quasimodo resistance at 0.9184 and daily resistance at 0.9187 (green), could attract intraday sellers, should we climb higher.
Further dips may also form back to weekly support at 0.9014, yet this time potentially taking in the key figure 0.90 on the H4 to accumulate fresh buyers.
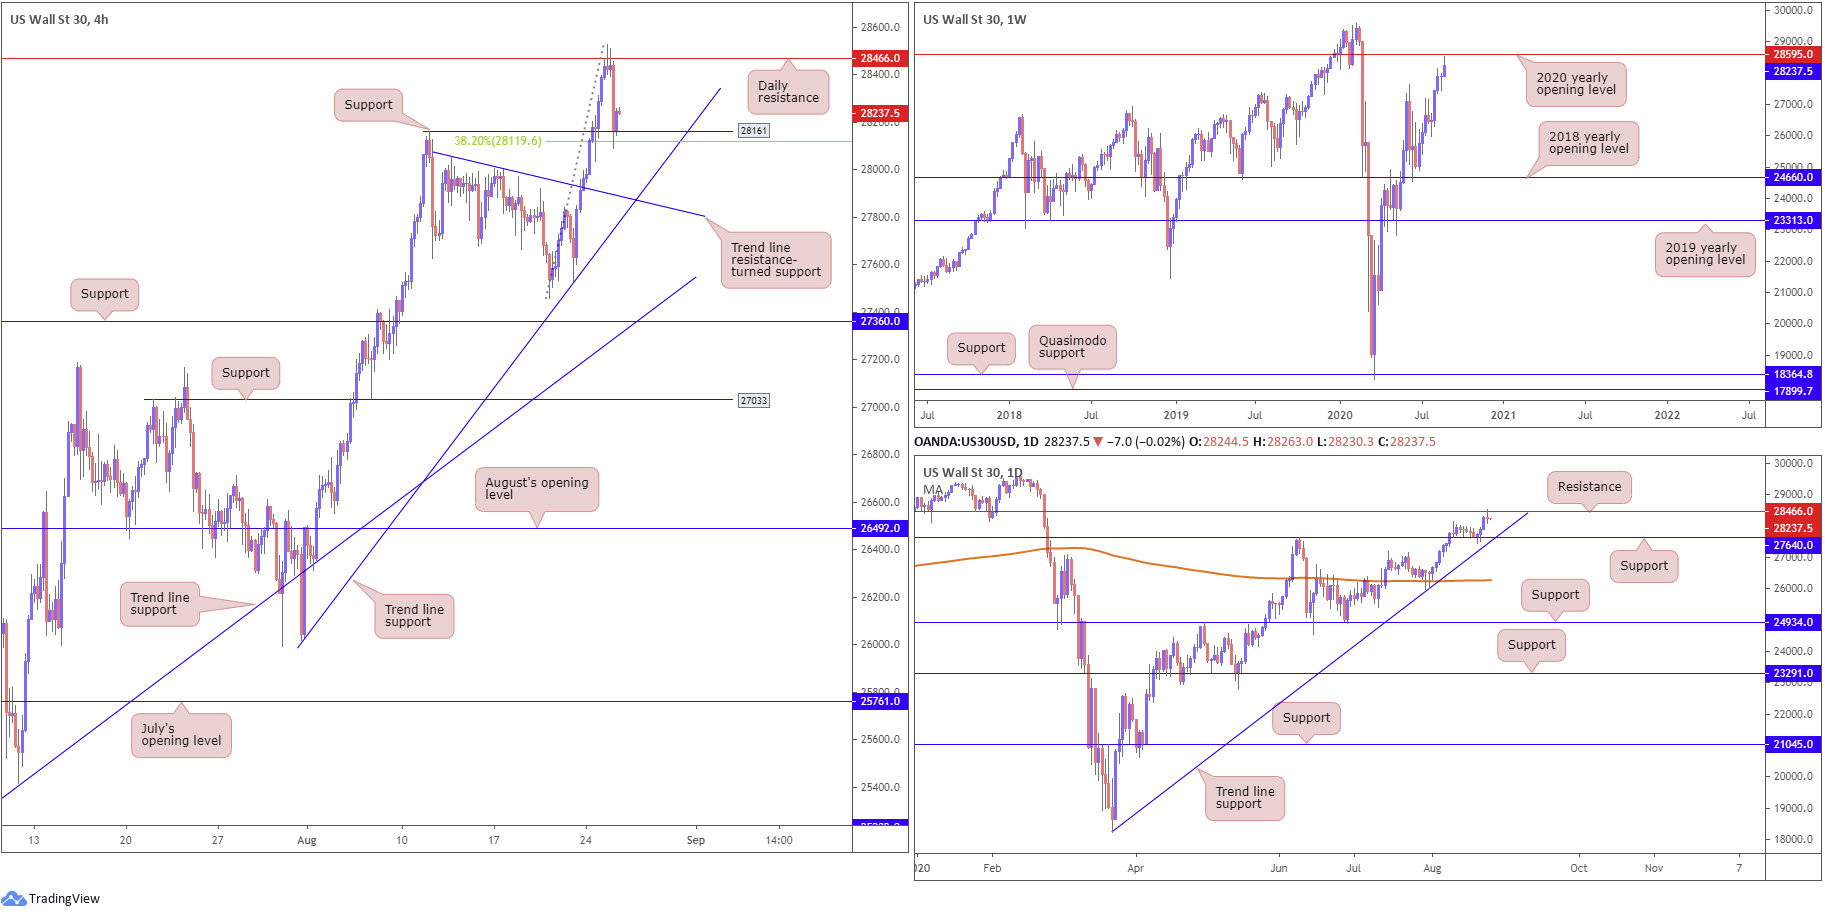
Dow Jones Industrial Average:
US stocks wrapped up Tuesday mostly higher on trade optimism between Beijing and Washington. The Dow Jones Industrial Average dropped 60.02 points, or 0.21%; the S&P 500 advanced 12.34 points, or 0.36% and the tech-heavy Nasdaq 100 traded higher by 95.63 points, or 0.82%.
The central theme during trade on Tuesday, technically speaking, was price crossing swords with daily resistance at 28466. The reaction, as you can see, was swift, pulling the unit back to H4 support at 28161, a base converging with a 38.2% Fibonacci ratio at 28119. What was also interesting was weekly resistance, formed by way of the 2020 yearly opening level, at 28595 came within close proximity of making a show.
Failure to hold off current H4 support could have the candles reach for trend line support, extended from the low 26017, aligning closely with a trend line resistance-turned support, taken from the high 28051. However, at this point, we may see daily action push for support at 27640, merging with daily trend line support, taken from the low 18213.
Areas of consideration:
With the current trend strongly pointing to the upside right now, H4 bulls may defend support at 28161 and re-attempt to take daily resistance at 28466. Traders considering longs from this region, however, will likely seek additional confirmation before taking action.
Daily support at 27640 is another point worth keeping eyes on should further dips materialise, having noted daily trend line convergence.
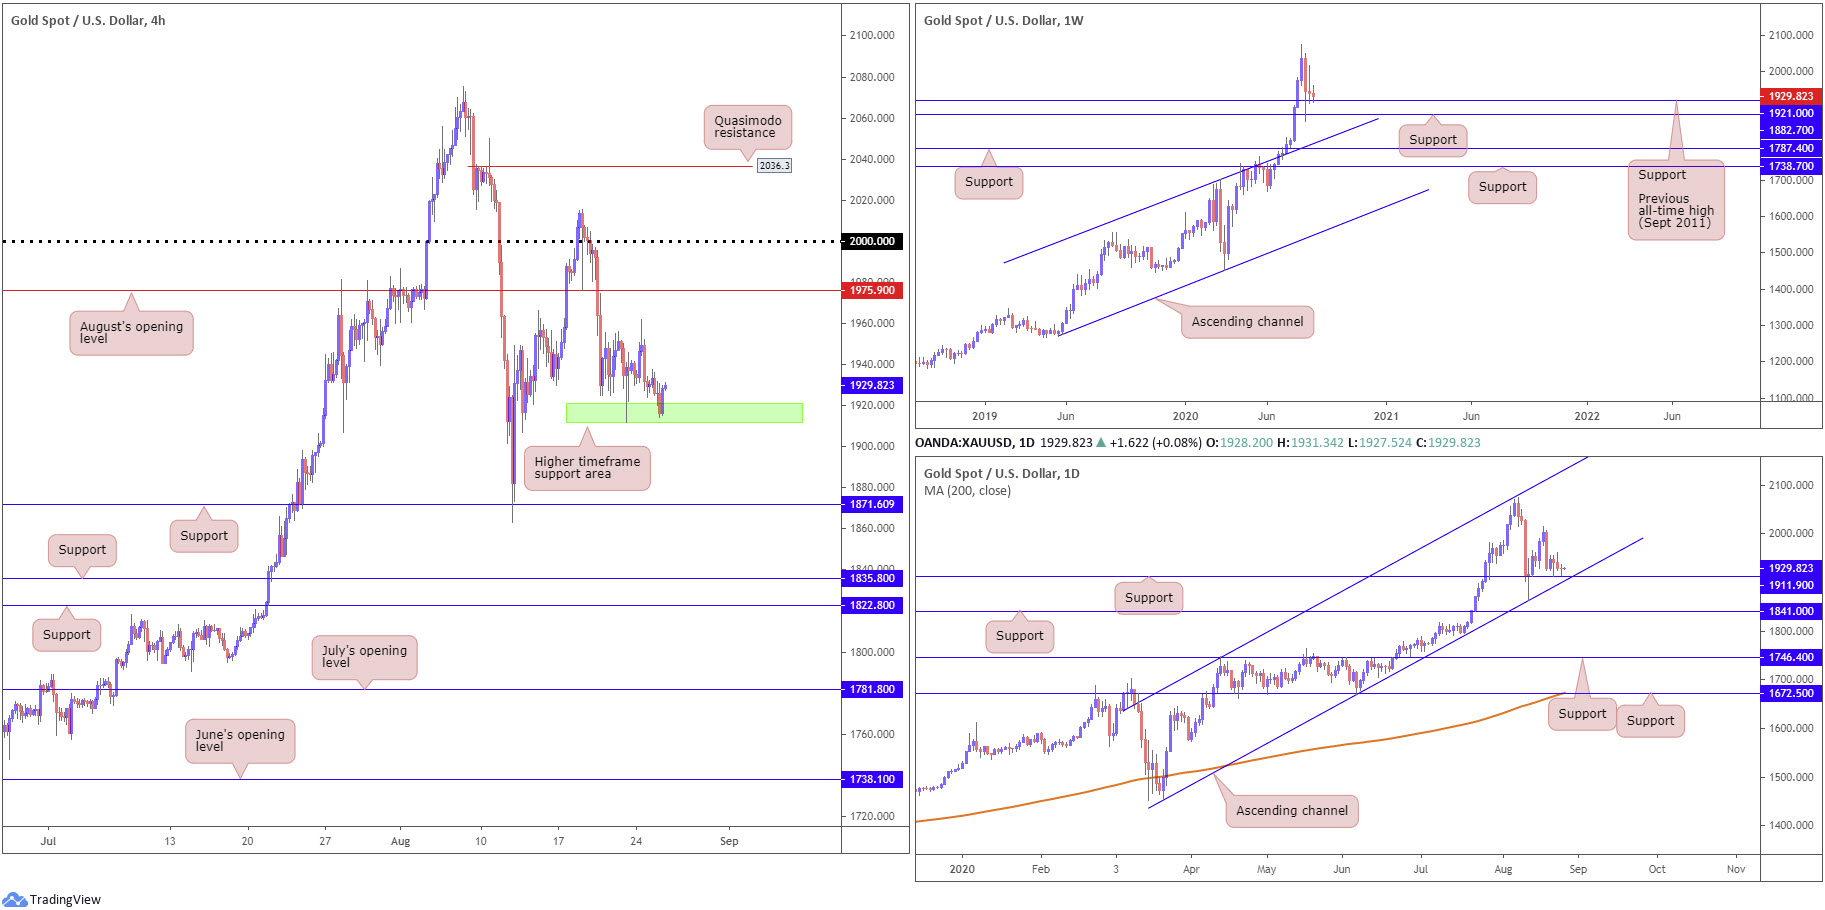
XAU/USD (GOLD):
In Tuesday’s technical briefing, traders may recall the piece mentioned the following (italics):
$1,921.00, the previous major all-time high (September 2011), along with support at $1,882.70, remain bulky support on the weekly timeframe, following the recent correction from all-time peaks at $2,075.28. Failure to hold, we could see channel resistance-turned support, etched from the high $1,703.28, enter play
Since mid-March, daily flow has been trading within the walls of an ascending channel configuration, taken from $1,455.32 and $1,747.72. Over the past couple of weeks, we have seen price action reconnect with channel support, together with support at $1,911.90. Aside from the $2,015.72 August 18 high, limited resistance is in view.
Between August’s opening level from $1,975.90 and support at $1,871.60 on the H4 timeframe, traders will acknowledge the yellow metal has been chalking up an indecisive tone between $1,955.03/$1,925.78 since Wednesday last week.
A higher timeframe support area at $1,911.90-$1,921.00 (daily and weekly supports – shown on the H4 timeframe in green) is likely to remain on the watchlists going forward. Should this area welcome price once more, H4 traders may watch for signs of bullish activity to attempt an approach towards August’s opening level from $1,975.90 on the H4, and, quite possibly, the $2,000.00 mark.
Areas of consideration:
With $1,911.90-$1,921.00 making an appearance on Tuesday and producing a notable H4 bullish candle, this could be enough to tempt buying today, with the majority of protective stop-loss orders tucked around $1,908.36.
As highlighted above, the initial upside targets will likely be centred around August’s opening level from $1,975.90 on the H4.
The accuracy, completeness and timeliness of the information contained on this site cannot be guaranteed. IC Markets does not warranty, guarantee or make any representations, or assume any liability regarding financial results based on the use of the information in the site.
News, views, opinions, recommendations and other information obtained from sources outside of www.icmarkets.com.au, used in this site are believed to be reliable, but we cannot guarantee their accuracy or completeness. All such information is subject to change at any time without notice. IC Markets assumes no responsibility for the content of any linked site.
The fact that such links may exist does not indicate approval or endorsement of any material contained on any linked site. IC Markets is not liable for any harm caused by the transmission, through accessing the services or information on this site, of a computer virus, or other computer code or programming device that might be used to access, delete, damage, disable, disrupt or otherwise impede in any manner, the operation of the site or of any user’s software, hardware, data or property.


