
Waiting for lower timeframe confirmation is our main tool to confirm strength within higher timeframe zones, and has really been the key to our trading success. It takes a little time to understand the subtle nuances, however, as each trade is never the same, but once you master the rhythm so to speak, you will be saved from countless unnecessary losing trades. The following is a list of what we look for:
- A break/retest of supply or demand dependent on which way you’re trading.
- A trendline break/retest.
- Buying/selling tails/wicks – essentially we look for a cluster of very obvious spikes off of lower timeframe support and resistance levels within the higher timeframe zone.
We typically search for lower-timeframe confirmation between the M15 and H1 timeframes, since most of our higher-timeframe areas begin with the H4. Stops are usually placed 1-3 pips beyond confirming structures.
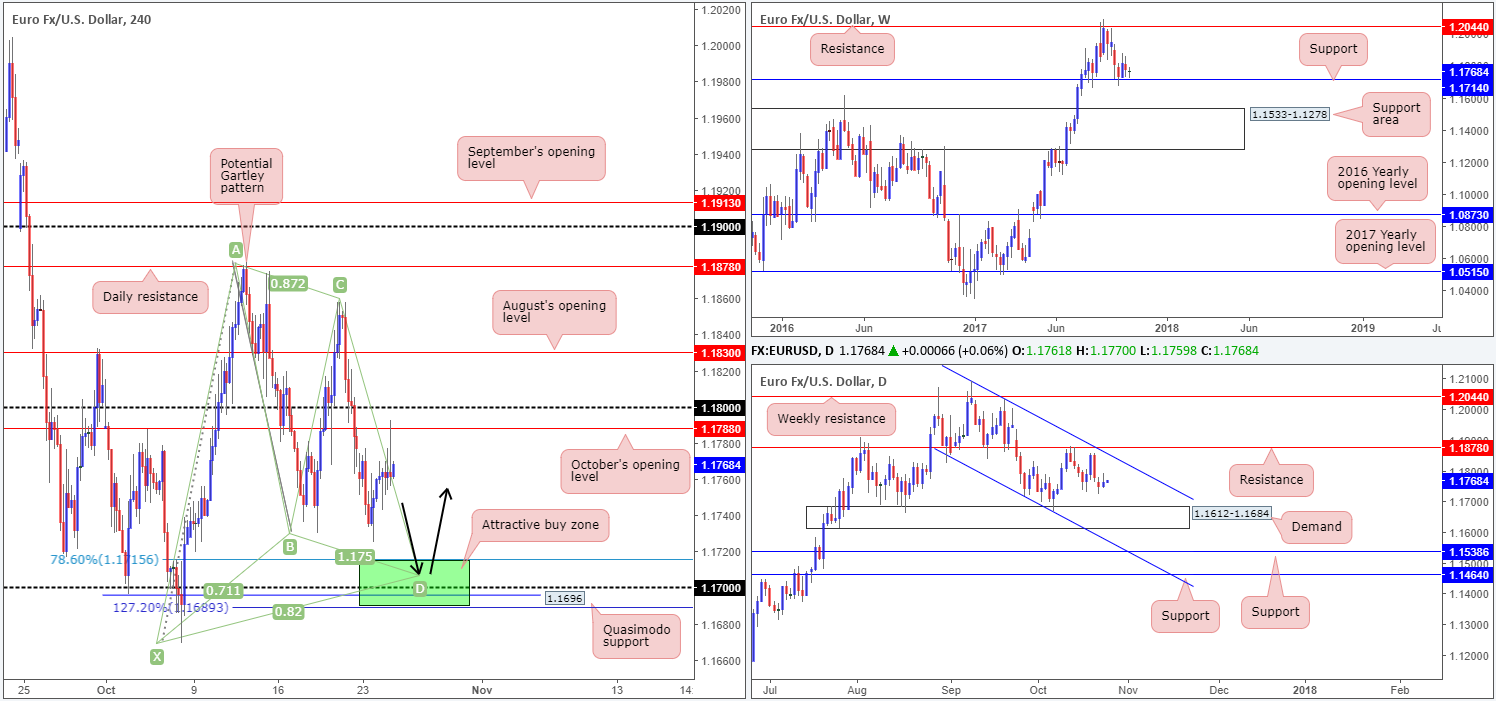
EUR/USD:
EUR/USD prices are little changed this morning. Technically speaking, the only thing of note was October’s opening level at 1.1788 being brought into the fray amid yesterday’s US afternoon segment. With this being the case, much of the following report will echo thoughts put forward in Tuesday’s analysis.
Long story short, the green H4 area at 1.1689/1.1715 remains a point of interest.
Structures supporting the zone are as follows:
- A H4 Harmonic Gartley completion point at around 1.1708/1.1715.
- The 1.17 handle.
- A H4 Quasimodo support at 1.1696.
- A H4 127.2% Fib ext. at 1.1689 taken from the high 1.1880.
- Weekly support seen at 1.1714.
- Located just above the top edge of daily demand at 1.1612-1.1684.
Suggestions: Assuming that one enters inside the green area (the 1.17 handle looks nice) and sets stops below the X point of the H4 Harmonic Gartley pattern (1.1669), this, in our humble view, is a high-probability setup, and certainly one that we would have no qualms in taking should the opportunity arise.
Unfortunately, it’s a little too early to determine take-profit targets as H4 price has yet to complete its approach.
Data points to consider: German IFO business climate at 9am; US Core durable goods orders m/m at 1.30pm; US New home sales at 3pm GMT+1.
Levels to watch/live orders:
- Buys: 1.1689/1.1715 (stop loss: 1.1667).
- Sells: Flat (stop loss: N/A).
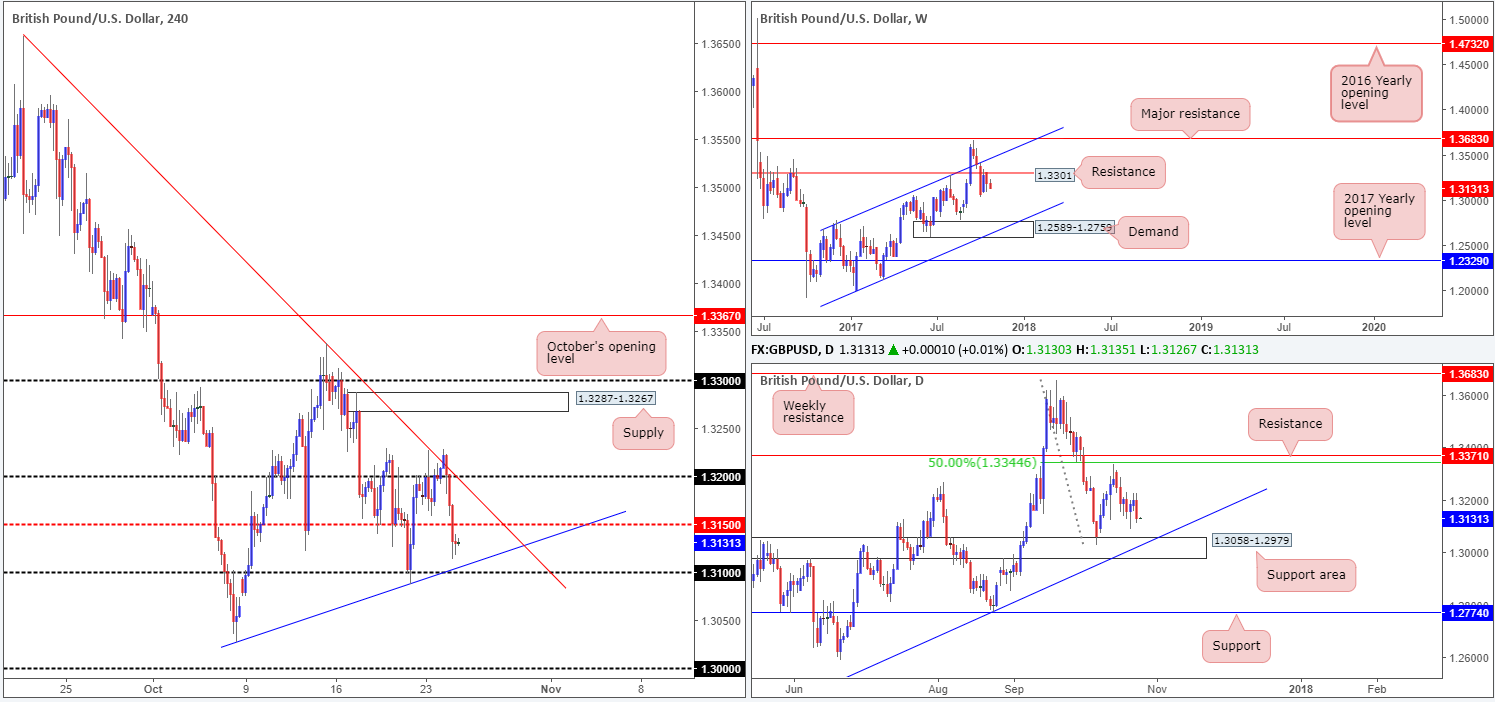
GBP/USD:
The British pound came under pressure on Tuesday after failing to sustain gains beyond the H4 trendline resistance extended from the high 1.3657. The pair effortlessly cleared the 1.32 handle as well as the H4 mid-level support 1.3150, and concluded the day mildly paring gains just ahead of the 1.31 band/H4 trendline support etched from the low 1.3027.
The tone over on the bigger picture remains bearish for the time being. Weekly bears recently established reasonably firm resistance from 1.3301, with little support seen to the downside. In addition to this, daily action produced a strong-looking bearish candle during yesterday’s movement, consequently engulfing two day’s worth of gains. The next downside target, however, is seen close by at 1.3058-1.2979: a support area which happens to merge beautifully with a trendline support taken from the low 1.2108.
Suggestions: Although weekly structure indicates further selling could be on the cards, shorting this unit on either the H4 or daily timeframes would be a challenge, given neighboring supports! On account of this, neither a long nor short seems attractive right now.
Data points to consider: UK Prelim GDP q/q at 9.30am; US Core durable goods orders m/m at 1.30pm; US New home sales at 3pm GMT+1.
Levels to watch/live orders:
- Buys: Flat (stop loss: N/A).
- Sells: Flat (stop loss: N/A).
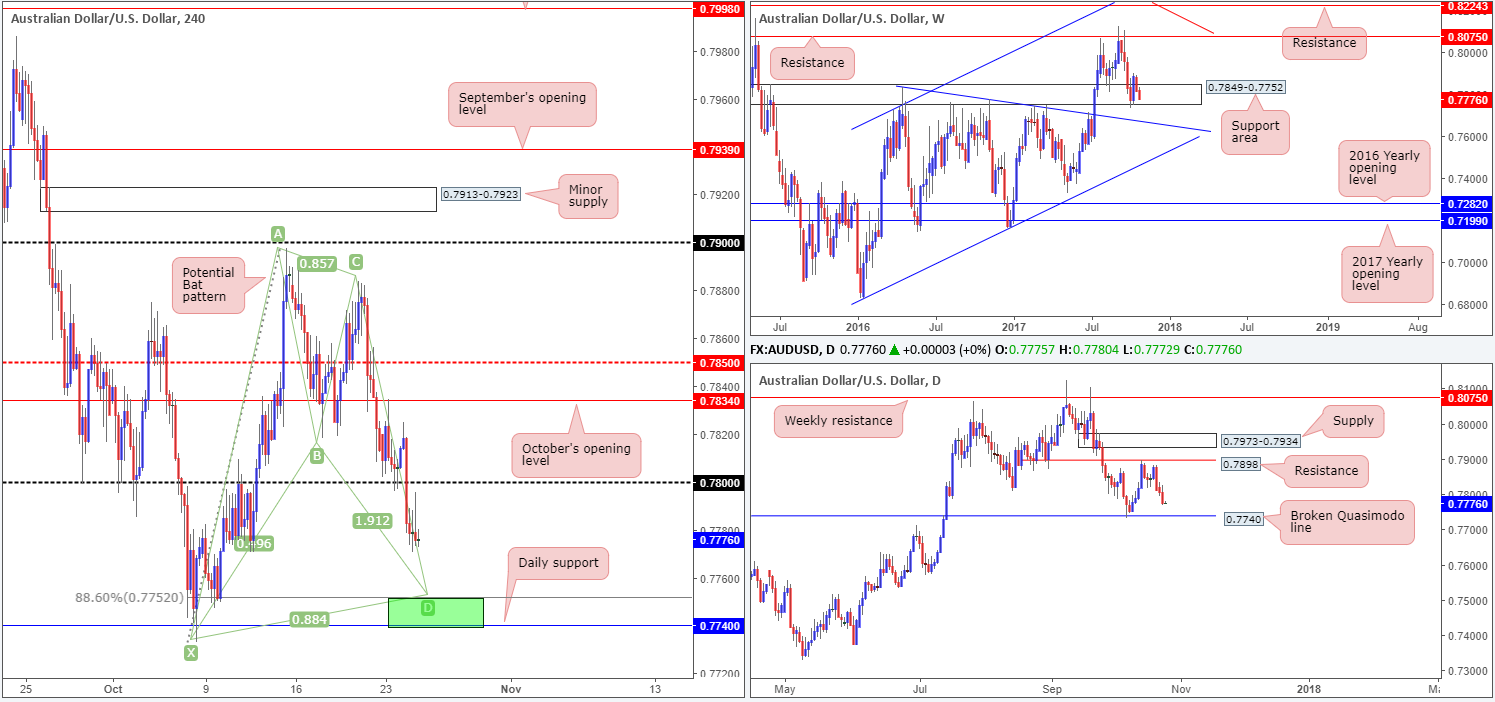
AUD/USD:
The Aussie dollar sustained further losses on Tuesday, enabling the H4 candles to conquer the 0.78 handle in aggressive fashion. With 0.78 now potentially out of the picture, the commodity currency will likely be heading down to the green H4 area marked at 0.7740/0.7752. Comprised of a daily broken Quasimodo line at 0.7740 and a H4 Harmonic bat completion point (or potential reversal zone) sited just above at 0.7752, this zone resembles a high-probability buy, in our humble view. It might also be worth noting that the daily level is seen positioned a few pips beneath a major weekly support area drawn from 0.7849-0.7752.
Suggestions: Long from the H4 green zone, with stops planted below the H4 Harmonic pattern’s X point (0.7733).
As H4 price has yet to complete its approach, it’s a little too early to forecast take-profit targets.
Data points to consider: AUD inflation figures q/q at 1.30am; US Core durable goods orders m/m at 1.30pm; US New home sales at 3pm GMT+1.
Levels to watch/live orders:
- Buys: 0.7740/0.7752 (stop loss: 0.7730).
- Sells: Flat (stop loss: N/A).
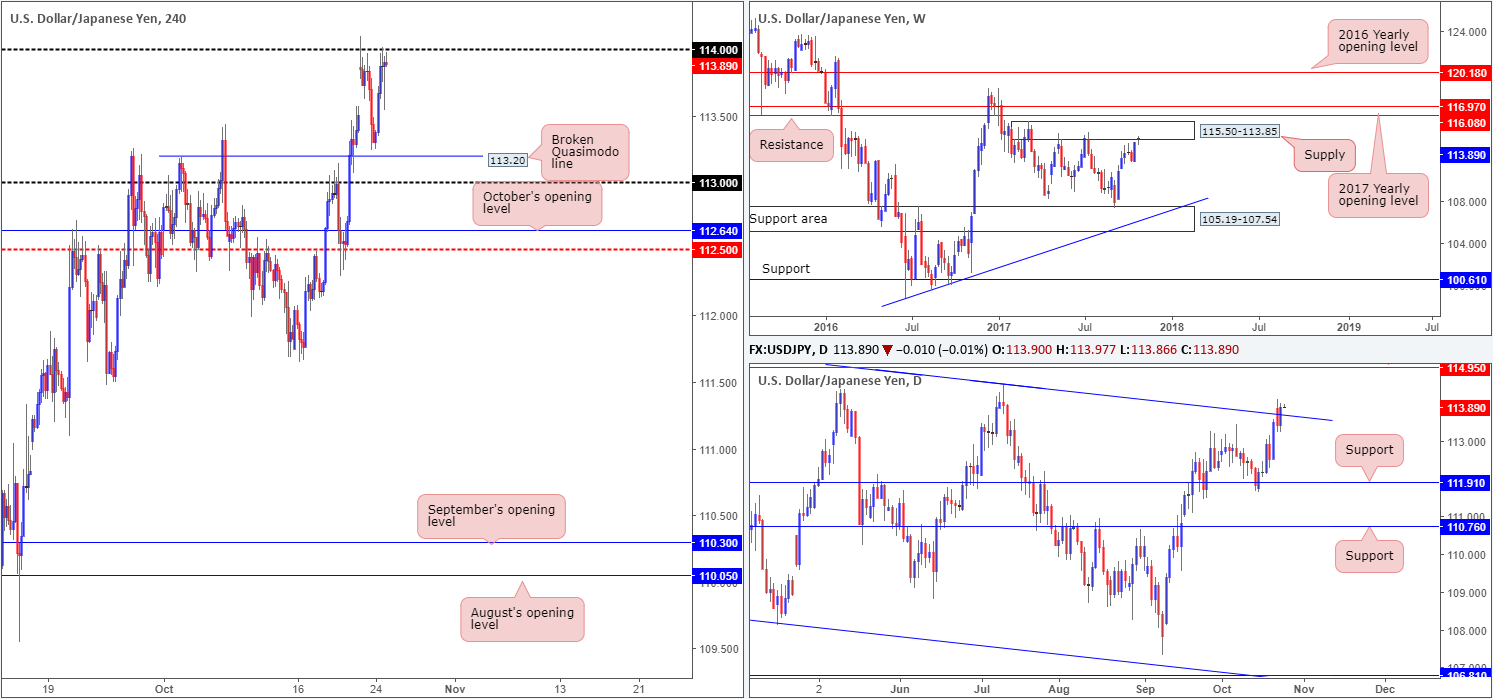
USD/JPY:
Opening from the top this morning, the weekly timeframe is seen kissing the underside of a supply zone at 115.50-113.85, which has held price lower on two separate occasions so far this year. As such, there’s a chance that history may repeat itself here. Daily flow on the other hand, recently closed above a channel resistance taken from the high 115.50, potentially opening up the path north to a Quasimodo resistance seen at 114.95.
Jumping across to the H4 timeframe, it’s clear to see that the 114 handle is back in the fray. Despite an earnest attempt to push lower from here on Tuesday, however, the bulls proved to be resilient.
Suggestions: We favor the daily Quasimodo resistance mentioned above at 114.95 for shorts, as it is firmly fixed within the upper limits of the aforesaid weekly supply area. What this does is allow traders to position stops ABOVE the weekly supply while shorting a daily level.
Shorting this market at current price would be a risk, given the strong close above the aforementioned daily channel resistance line yesterday.
Data points to consider: US Core durable goods orders m/m at 1.30pm; US New home sales at 3pm GMT+1.
Levels to watch/live orders:
- Buys: Flat (stop loss: N/A).
- Sells: 114.95 region (stop loss: 115.53).
USD/CAD:
Trade update: took a small loss on a short from 1.2637 at 1.2667.
Despite a pullback being seen from the H4 mid-level resistance 1.2650, the USD/CAD swiftly resumed upside yesterday and shook hands with a 161.8% H4 Fib ext. point at 1.2685. Shadowed closely by the 1.27 handle, the H4 candles have so far held firm here. However, we cannot rule out the possibility of fresh upside attempts. This is largely because daily price shows room to extend up to a resistance area pictured at 1.2831-1.2763. Supporting the bears, nevertheless, is weekly supply at 1.2778-1.2653.
Suggestions: As you can see, we have a conflict of opinion on the higher timeframes at the moment. For that reason, we would only consider a short from the 1.27/1.2685 area if a full or near-full-bodied bearish candle takes shape. This, of course, will not guarantee a winning trade, but what it will do is show bearish intent and likely bring the unit down to 1.2650, thus allowing us to reduce risk to breakeven. A move beyond 1.2650 is what we would ultimately be looking for though.
Data points to consider: US Core durable goods orders m/m at 1.30pm; US New home sales at 3pm; BoC monetary policy report/rate statement at 3pm; Crude oil inventories at 3.30pm and a BoC press conference at 4.15pm GMT+1.
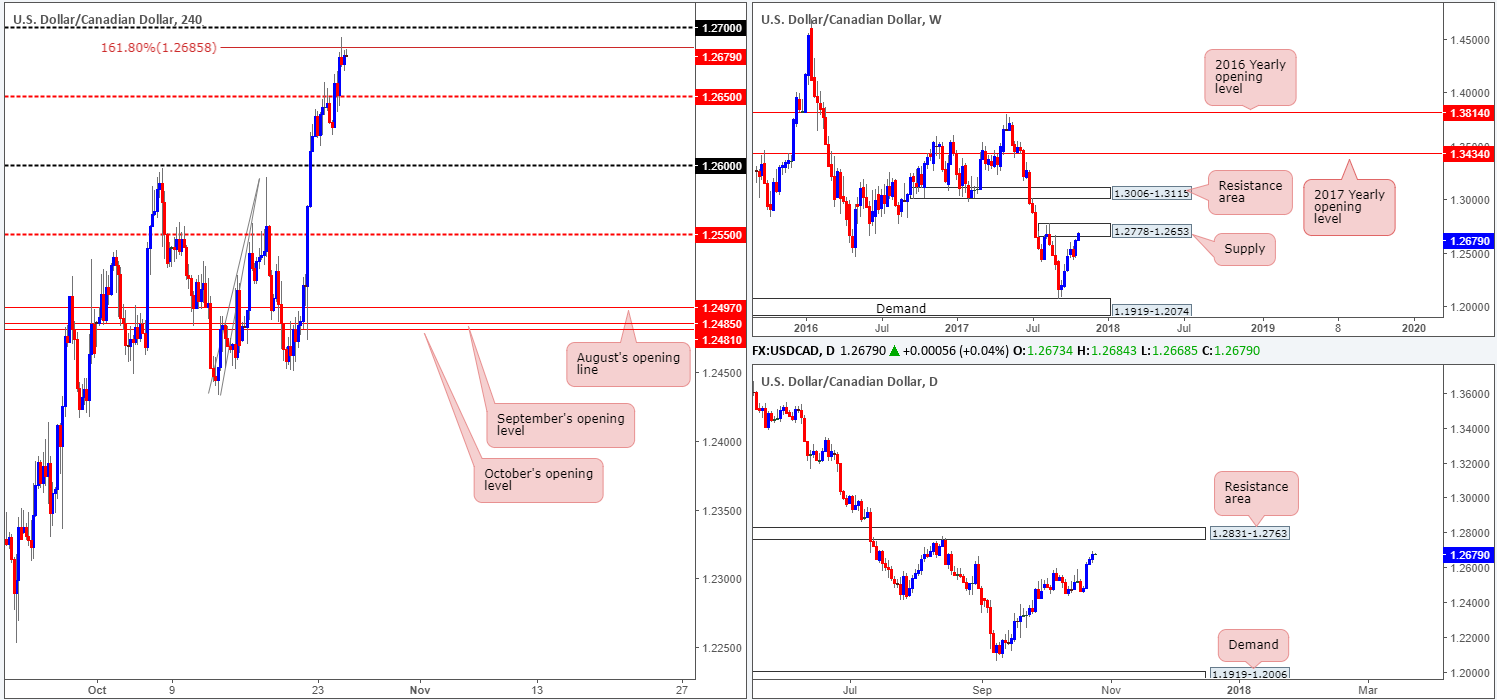
Levels to watch/live orders:
- Buys: Flat (stop loss: N/A).
- Sells: 1.27/1.2685 ([waiting for a reasonably sized H4 bearish candle to form – preferably a full or near-full-bodied candle – is advised] stop loss: ideally beyond the candle’s wick).
USD/CHF:
The buyers managed to find their feet early on in the day yesterday, consequently lifting the Swissie beyond the 0.99 handle into the day’s end. With offers likely cleared from this psychological obstacle, H4 resistance at 0.9963, followed closely by H4 resistance at 0.9992 and parity (1.0000) will likely be the next hurdles on the hit list.
In addition to the above, yesterday’s advance also saw the unit push beyond weekly resistance at 0.9861, which, as far as we can see, has unbolted the doors up to the 2016 yearly opening level at 1.0029. Along similar lines, daily price also displays freedom for price to challenge resistance coming in at 1.0080.
Suggestions: Keeping it Simple Simon this morning, we feel longs above 0.99 are high probability due to where price is currently positioned on the higher timeframes. Because of this, we will be watching for H4 price to retest 0.99 today and hold steady. Should a full or near-full-bodied H4 candle be seen following the retest, we would look to buy, targeting the aforesaid H4 resistances in bold.
Data points to consider: US Core durable goods orders m/m at 1.30pm; US New home sales at 3pm GMT+1.
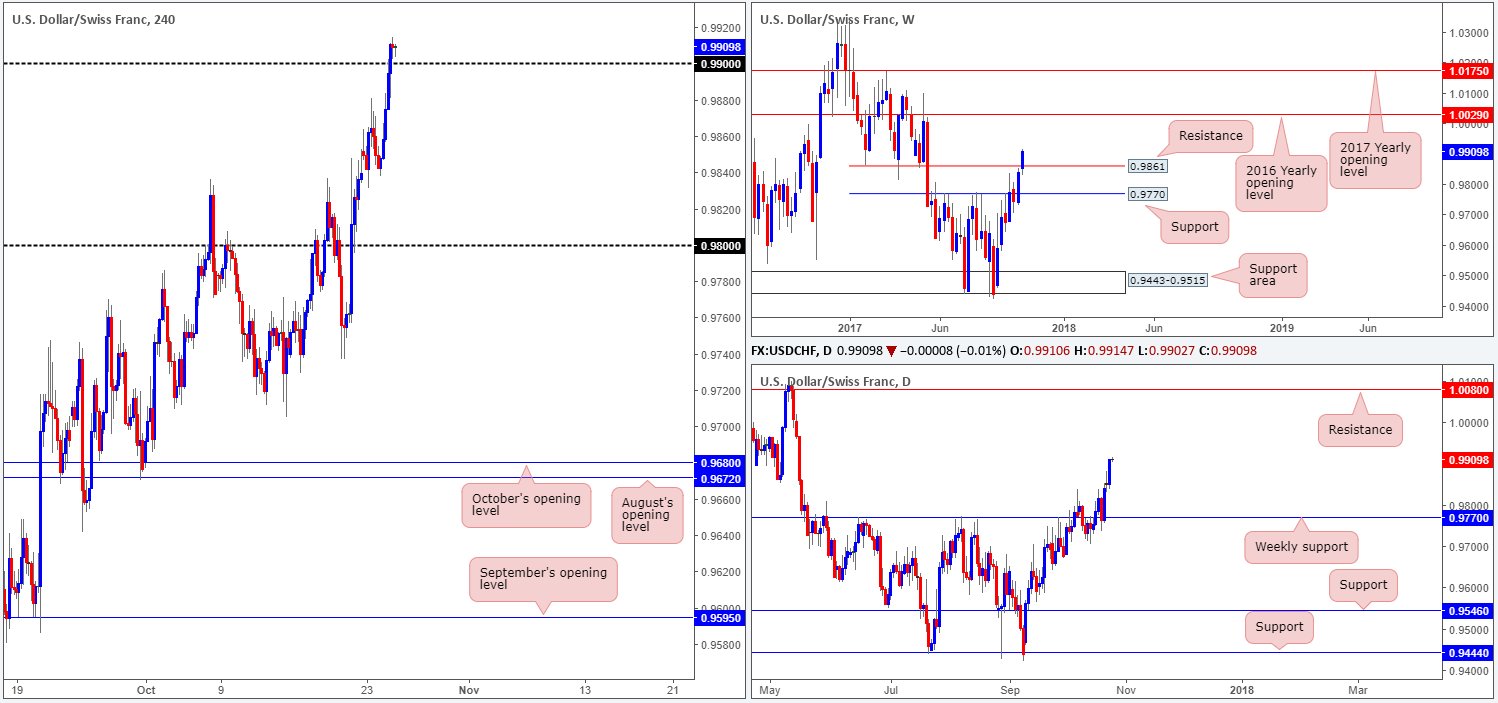
Levels to watch/live orders:
- Buys: 0.99 region ([waiting for a reasonably sized H4 bullish candle to form – preferably a full or near-full-bodied candle – is advised] stop loss: ideally beyond the candle’s tail).
- Sells: Flat (stop loss: N/A).
DOW 30:
US equities advanced to a fresh record high of 23484 on Tuesday, after earnings. The index, now up 4.63% this month, is likely to continue punching higher, given the underlying trend at present.
Should the index pullback this week, the next weekly downside target in view is demand coming in at 22216-22431. On the daily timeframe, the closest demand base can be seen at 22820-22884. However, price would first have to get through potential support from the channel resistance-turned support taken from the high 21541. Looking across to the H4 timeframe, the support area at 23261-23297 is also a potential candidate if the market dips lower.
Suggestions: We do not see any immediate trading opportunities at present. Yet, we will be keeping a close eye on the noted H4 support area. In the event that price connects with this zone, we would be looking to buy should H4 price chalk up a full or near-full-bodied bull candle.
Data points to consider: US Core durable goods orders m/m at 1.30pm; US New home sales at 3pm GMT+1.
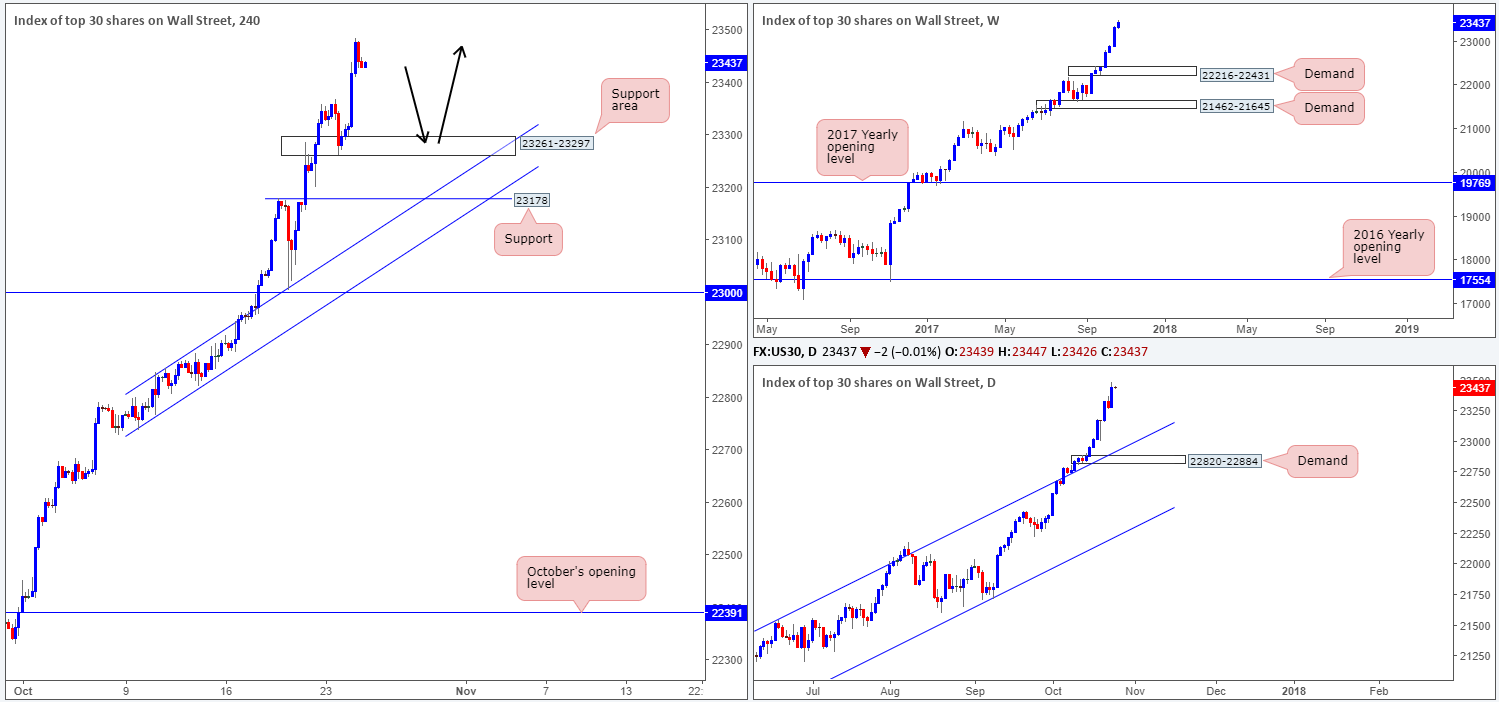
Levels to watch/live orders:
- Buys: 23261-23297 ([waiting for a reasonably sized H4 bullish candle to form – preferably a full or near-full-bodied candle – is advised] stop loss: ideally beyond the candle’s tail).
- Sells: Flat (stop loss: N/A).
GOLD:
After a brief spell above October’s opening level at 1279.1, the H4 candles concluded Tuesday’s segment closing just ahead of a trendline support etched from the low 1260.4.
While traders may be gearing themselves up to buy from the aforesaid trendline support, there’s still a strong chance that H4 price will be looking to push lower and strike 1269.3: August’s opening level. Why? Well, this is due to weekly price showing room to move down to a demand at 1251.7-1269.3 (notice the top edge represents August’s opening level) and daily price down to demand printed at 1251.7-1265.2 which happens to be sited within the lower limits of the said weekly demand.
Suggestions: Technically speaking, we feel that a long from 1269.3, in light of its position on the higher timeframes, has a higher probability of success. However, do be prepared for a possible fakeout down to the nearby H4 Quasimodo support at 1265.9. Stop-loss orders would, therefore, be best placed below the aforementioned daily demand. Yes, it is a large stop loss, but considering that we’re dealing with higher-timeframe demands, the reaction should be equally as big.
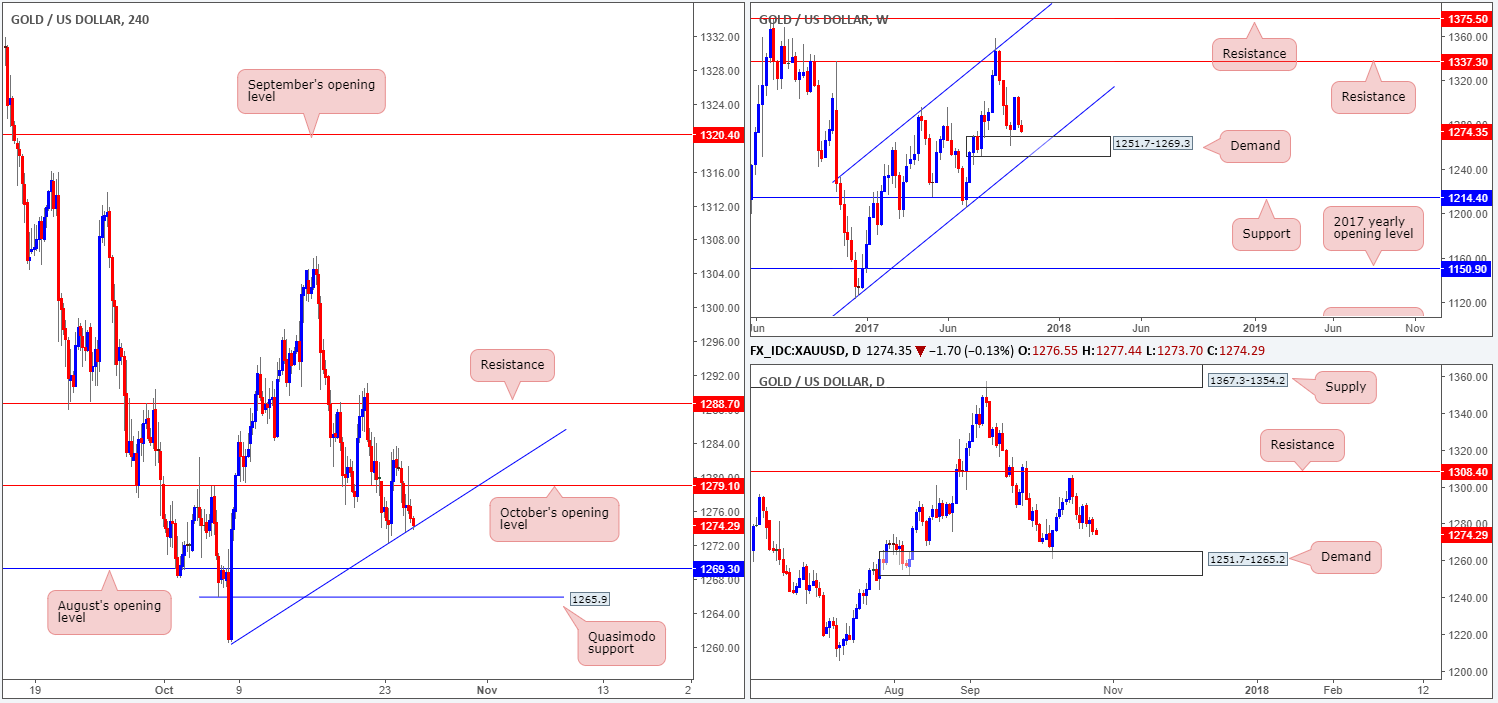
Levels to watch/live orders:
- Buys: 1269.3 region ([waiting for a reasonably sized H4 bullish candle to form – preferably a full, or near-full-bodied candle – is advised] stop loss: ideally beyond the candle’s tail).
- Sells: Flat (stop loss: N/A).


