
A note on lower timeframe confirming price action…
Waiting for lower timeframe confirmation is our main tool to confirm strength within higher timeframe zones, and has really been the key to our trading success. It takes a little time to understand the subtle nuances, however, as each trade is never the same, but once you master the rhythm so to speak, you will be saved from countless unnecessary losing trades. The following is a list of what we look for:
- A break/retest of supply or demand dependent on which way you’re trading.
- A trendline break/retest.
- Buying/selling tails/wicks – essentially we look for a cluster of very obvious spikes off of lower timeframe support and resistance levels within the higher timeframe zone.
- Candlestick patterns. We tend to only stick with pin bars and engulfing bars as these have proven to be the most effective.
We search for lower timeframe confirmation between the M15 the H1 timeframes, since most of our higher-timeframe areas begin with the H4. Stops are usually placed 5-10 pips beyond confirming structures.
EUR/USD:
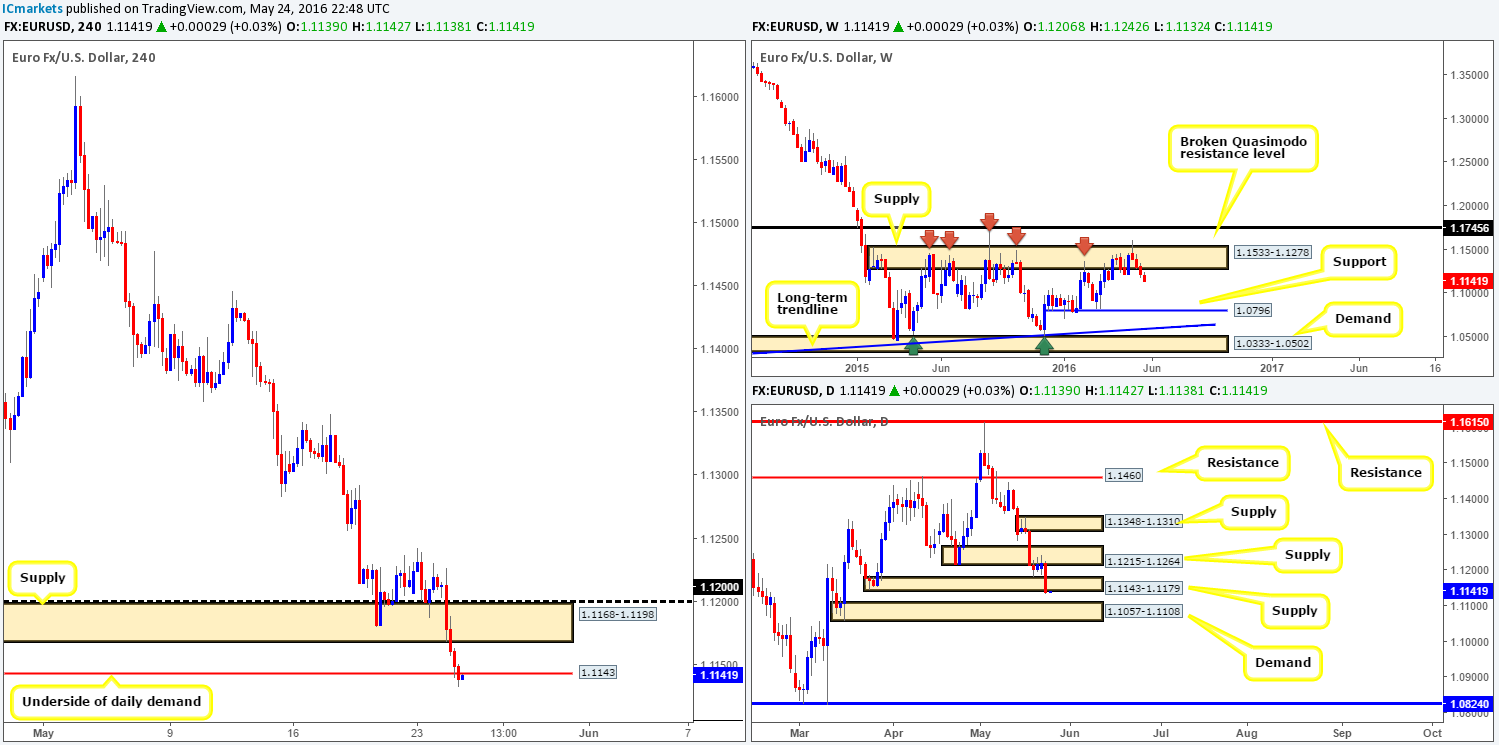
The bearish pulse clearly continues to beat in the EUR/USD market! In the early hours of yesterday’s London session, a strong wave of offers brought price below the 1.12 handle and then eventually broke through H4 demand at 1.1168-1.1198 (now acting supply). It was only once price entered into the later hours of the American session did we see the shared currency violate the 1.1143 H4 low (underside of daily demand at 1.1143-1.1179).
Technically, this sell-off has the potential to continue according to our analysis on the weekly chart. Weekly bears continue to reflect bearish intentions from weekly supply at 1.1533-1.1278 that has capped this market since May 2015. The next downside target from this angle can be seen at 1.0796 – a weekly support. Down on the daily chart, price recently closed beyond daily demand at 1.1143-1.1179 (now acting supply), potentially clearing the rubble for a try at daily demand coming in at 1.1057-1.1108.
Our suggestions: Although direction is relatively clear on this pair at the moment (see above), trading short is tricky in our opinion. A sell from the H4 resistance at 1.1143 looks great at first glance, but when one looks over to the daily chart and notices that the top-side of daily demand is sitting just below it at 1.1108, risk/reward is pretty poor! Given the tight trading conditions here, we’re going to place this pair on the sidelines today and reassess going into tomorrow’s sessions.
Levels to watch/live orders:
- Buys: Flat (Stop loss: N/A).
- Sells: Flat (Stop loss: N/A).
GBP/USD:
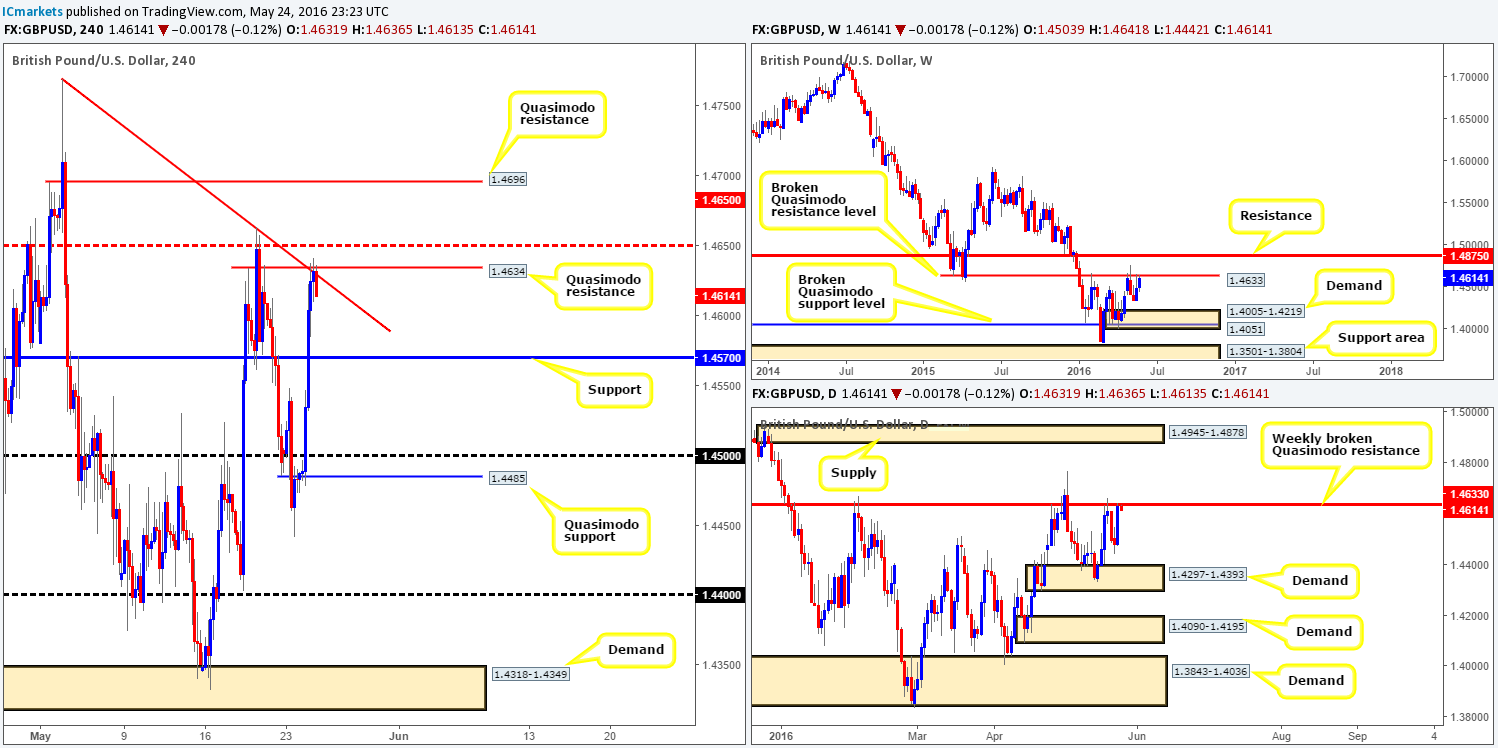
Cable was on fire yesterday! This recent 150-pip surge in buying was fuelled by latest Brexit polls favoring a ‘remain vote’, coupled with comments made by the BoE’s governor Mark Carney during a treasury committee hearing.
Technically, however, this pair is now flirting with an incredibly strong ceiling of resistance – the weekly broken Quasimodo line at 1.4633. This barrier has capped upside in this market since early February, so the bulls will likely have their work cut out for them if they intend on pushing higher from here!
At the time of writing, H4 action is seen flirting with a nice-looking H4 Quasimodo resistance level at 1.4634 (converges with H4 trendline resistance extended from the high 1.4769), which, as far as we can see, has the potential, given the higher-timeframe structure (see above), to push this market down to at least H4 support penciled in at 1.4570.
Our suggestions: A short from the current H4 Quasimodo resistance line is favorable. It seems, however, that we may have missed the boat for a touch trade (entry at market). Therefore, in order to enter short from here, our team is going to be hunting for a lower timeframe entry. This could be in the form of an engulf of demand and subsequent retest, a trendline break/retest or simply a collection of selling wicks around a lower-timeframe resistance.
Levels to watch/live orders:
- Buys: Flat (Stop loss: N/A).
- Sells: 1.4634 region [Tentative – confirmation required] (Stop loss: dependent on where one confirms this area).
AUD/USD:
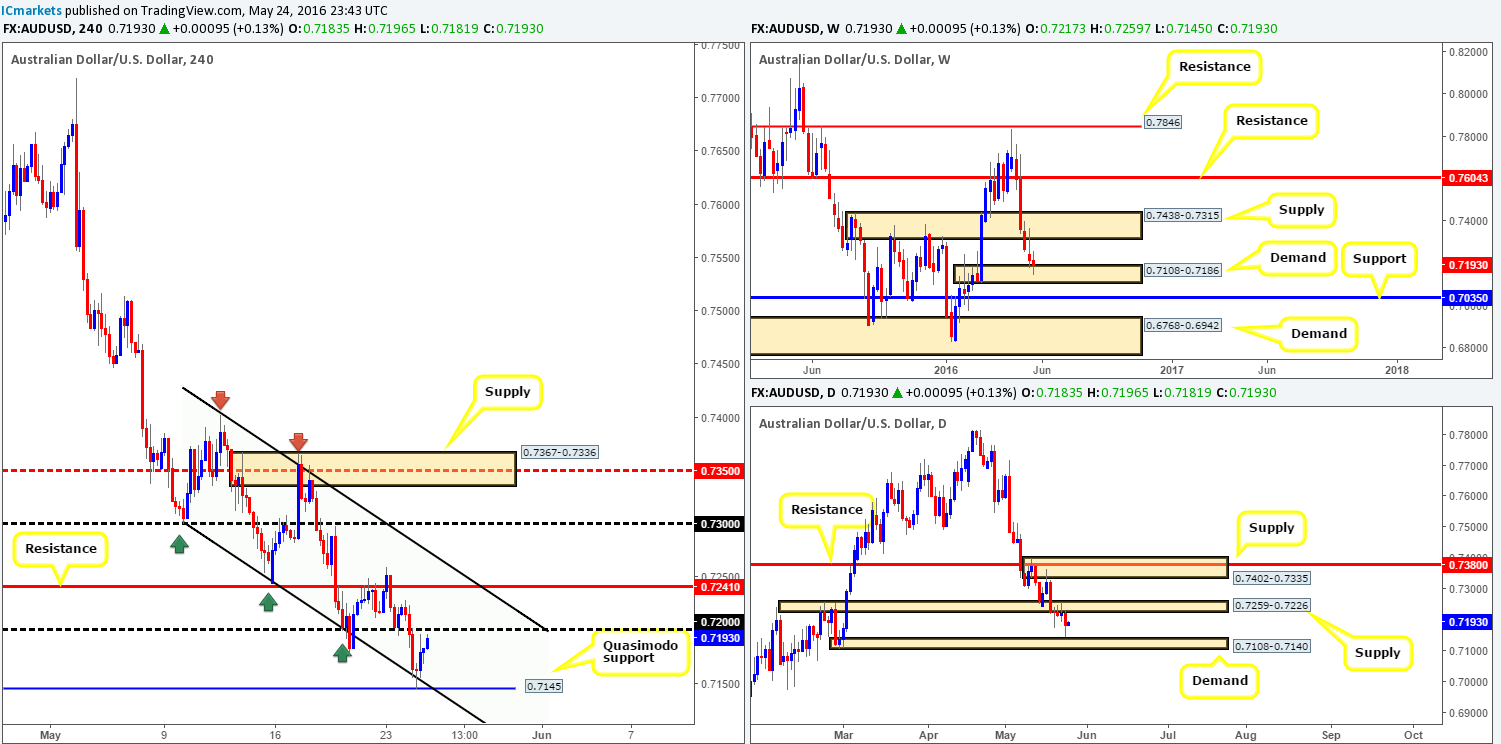
For those who read our previous report on the Aussie (see link below) you may recall us mentioning that our team had placed a pending order to buy at 0.7150. This was based on the convergence of a H4 Quasimodo line at 0.7145 and a H4 channel support extended from the low 0.7299. As can be seen from the chart, our order was filled during yesterday’s sessions and has since then rallied beautifully. We have just recently taken 50% of our position off the table (just below the 0.72 handle) and have reduced risk to breakeven. Well done to any of our readers who jumped aboard this one! Ultimately, we’re looking for this rally to continue due to the following reasons:
- The commodity currency is now seen testing weekly demand coming in at 0.7108-0.7186.
- Daily price shows room for this market to continue advancing north up to the underside of daily supply at 0.7259-0.7226.
- Beyond the 0.72 handle, the H4 resistance level at 0.7241 is our next take-profit target (sits within the aforementioned daily supply zone).
Our suggestions: Other than our live position from 0.7150, neither a long nor short seems attractive at current prices.
Levels to watch/live orders:
- Buys: 0.7150 [Live] (Stop loss: breakeven).
- Sells: Flat (Stop loss: N/A).
USD/JPY:
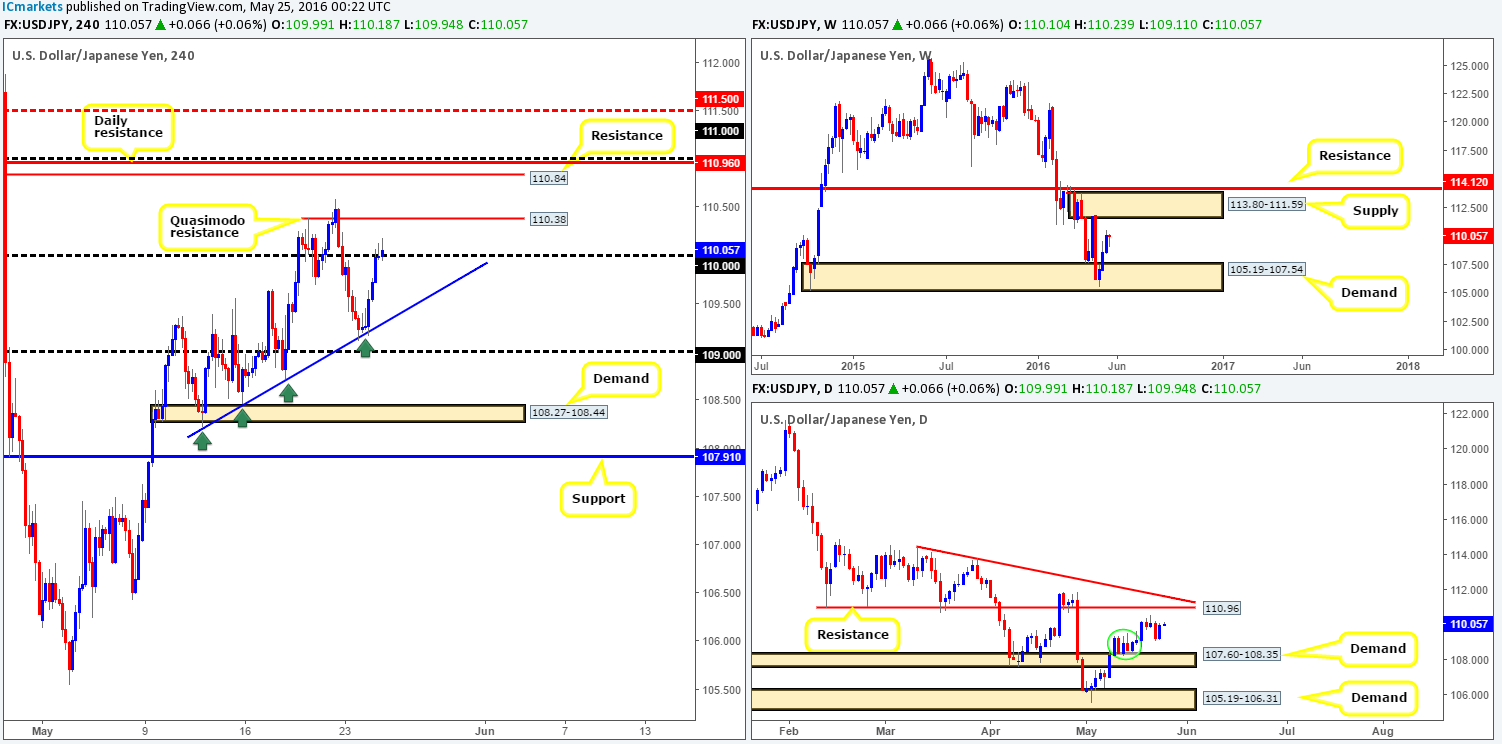
Supported by a rally in the Nikkei from H4 range support at 16475 and a sturdy-looking daily demand base at 108.38-109.39 on the USD/JPY (green circle), the U.S. dollar rallied beautifully from a H4 trendline support yesterday taken from the low 108.22. Erasing all of Monday’s losses, the pair is now seen trading above the 110 handle, just ahead of a H4 Quasimodo resistance line at 110.38.
With the H4 chart in mind, how do things stand over on the higher-timeframe picture? Well, weekly action continues to gravitate in the direction of a weekly supply zone given at 113.80-111.59. Meanwhile, lower down the scale, daily price shows room to advance north up to daily resistance seen at 110.96, which fuses nicely with a daily trendline resistance from the high114.44.
Our suggestions: According to the higher timeframes, buying this market is likely the best bet for the time being. Nevertheless, with the H4 Quasimodo line seen at 110.38 obstructing the path north, we are going to pass on any buys today. What we are interested in, however, is the 111.00/110.84 zone (round-number 111.00, daily resistance at 110.96 and H4 resistance at 110.84) for sell opportunities. Despite this collection of resistances seen here, we would still require lower timeframe confirmation (see the top of this report for ideas on how to find confirmation). The reason being is, as we mentioned above, weekly action could very well continue north up to the underside of the above said weekly supply – essentially the H4 mid-way resistance 111.50.
Levels to watch/live orders:
- Buys: Flat (Stop loss: N/A).
- Sells: 111.00/110.84 region [Tentative – confirmation required] (Stop loss: dependent on where one confirms this area).
USD/CAD:
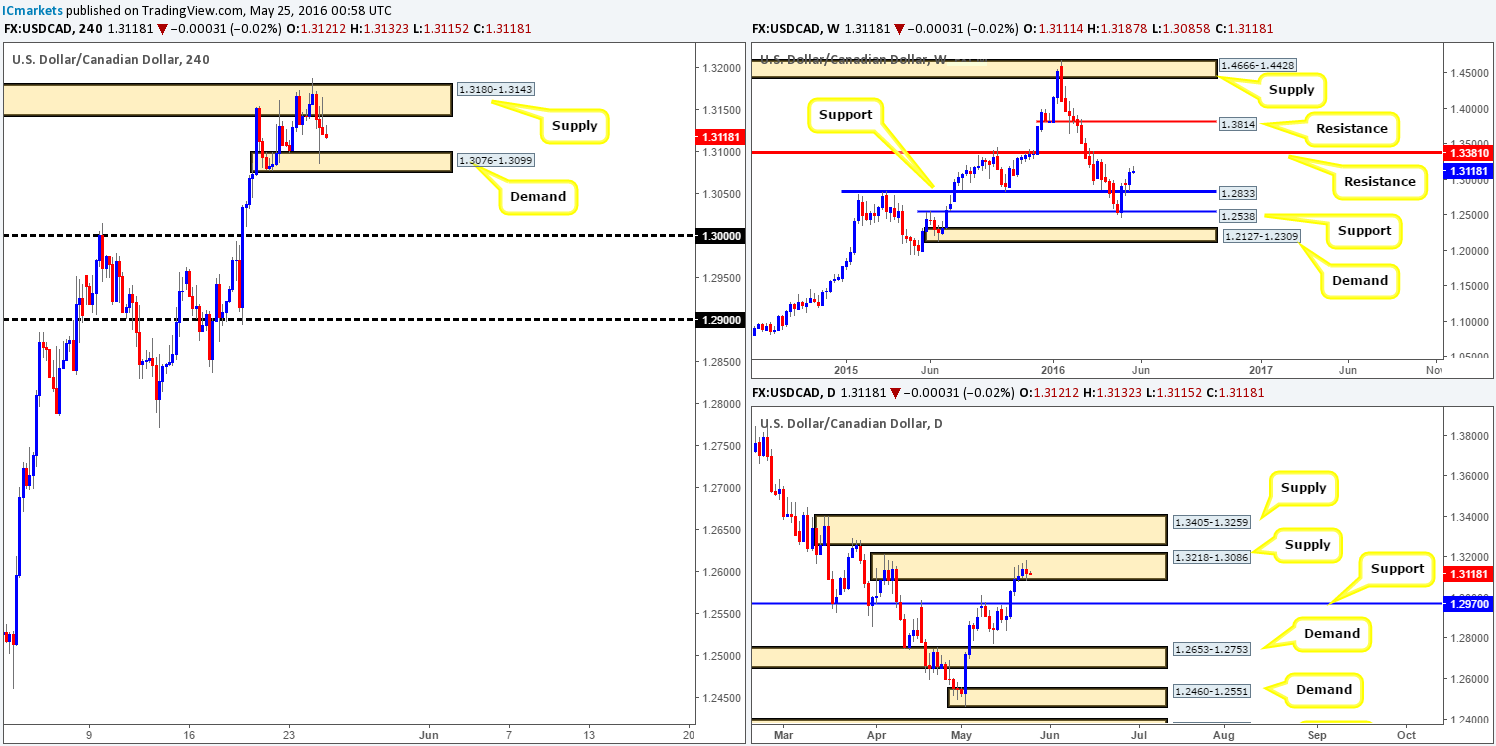
With the oil market extending its bounce from H4 demand at 46.72-47.36 yesterday, the USD/CAD sold-off from H4 supply at 1.3180-1.3143 down into the jaws of H4 demand carved from 1.3076-1.3099. Despite this recent bout of selling, the market’s overall structure remains the same – price continues to consolidate amid the two above said H4 areas.
In addition to the above information, over on the weekly chart, the Loonie extended its bounce from support at 1.2833 last week, likely opening the gates for a possible touch of 1.3381 – weekly resistance. Scanning down to the daily chart, however, a collection of daily selling wicks have formed within daily supply drawn from 1.3218-1.3086. Our only concern regarding these selling wicks is that each wick produced is forming a higher high!
Our suggestions: Similar to yesterday’s report, trading this market right now is difficult and potentially very risky. A buy would almost certainly place you within the jaws of the current daily supply zone or the one directly above it at 1.3405-1.3259, whilst a sell would, as you can see, put you up against weekly buying! Therefore, we remain on the sidelines for the time being.
Levels to watch/live orders:
- Buys: Flat (Stop loss: N/A).
- Sells: Flat (Stop loss: N/A).
USD/CHF:
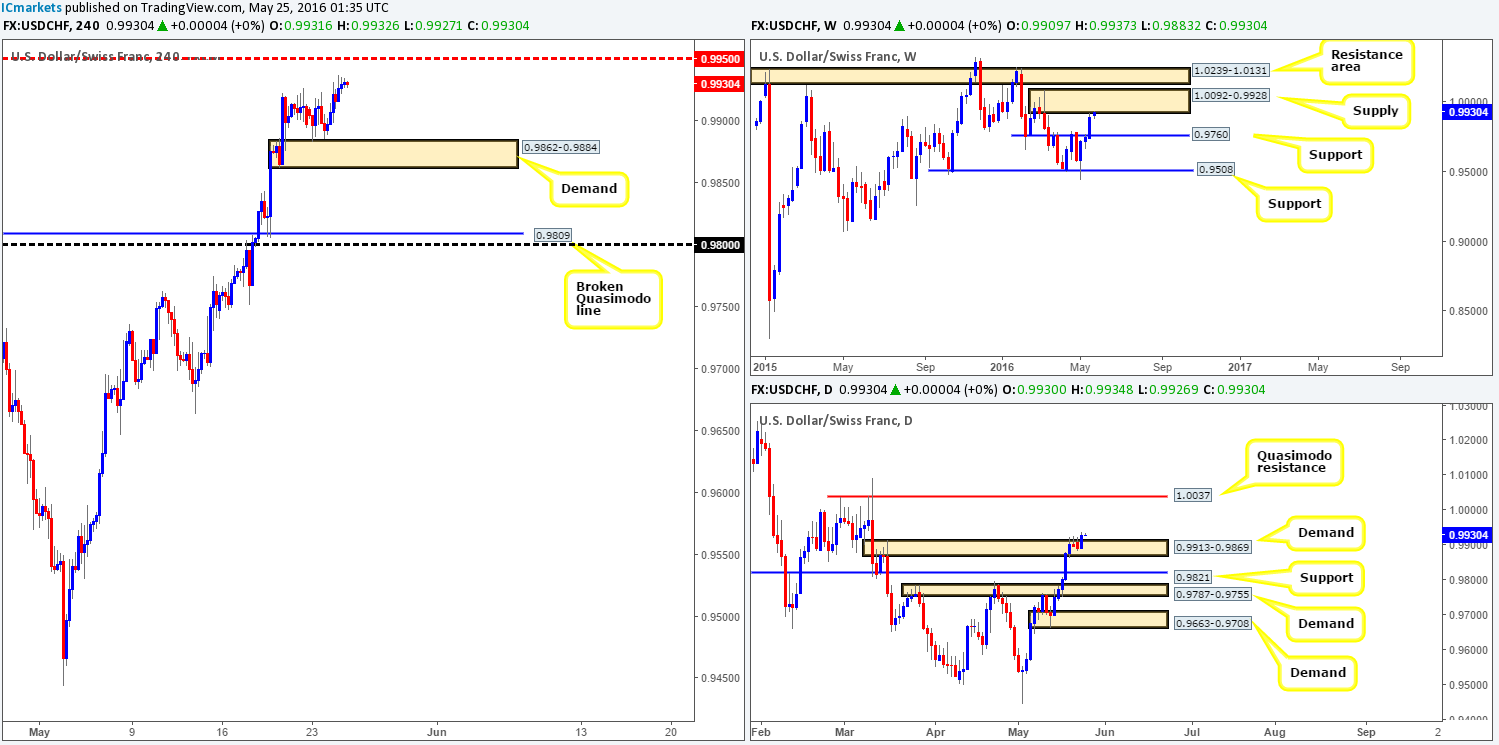
To keep this report straightforward, we’re going to begin by looking at the weekly chart this morning. As you can see, the Swissy is now crossing swords with a rather large weekly supply base coming in at 1.0092-0.9928. Given the size of this barrier, it is possible that we may see further buying into this area before weakness comes into the market.
Turning over a page to the daily chart, the current picture shows daily supply at 0.9913-0.9869 has recently been consumed (now acting demand). To our way of seeing things, this has opened the gates for price to challenge a daily Quasimodo resistance line at 1.0037, which lurks deep within the current weekly supply area.
Stepping across to the H4 chart, price action recently extended its bounce from the H4 demand at 0.9862-0.9884 up to highs of 0.9937. Just ahead of price sits the H4 mid-way resistance at 0.9950, followed closely by parity (1.0000).
Our suggestions: In light of price trading at a weekly supply right now, the bears could step in at any moment! However, the break above daily supply and room seen above it for a continuation move north towards the daily Quasimodo resistance line could suggest the bulls may want to test the extremes of the above said weekly supply. In view of this, here are the options as we see it:
- Watch for price to retest the H4 demand base at 0.9862-0.9884 for a long trade. Granted, you would be buying into weekly supply, but at the same time, you’d also be trading in-line with daily flow.
- Look for lower timeframe sell setups at 0.9950. From here you’d be selling from weekly supply but against daily flow.
- Should the above sell level fail, we’ll then focus on the daily Quasimodo resistance at 1.0037 coupled with 1.0000 to form a sell zone.
Other than the third option, our team highly recommends waiting for lower timeframe price action to form before risking capital (for ways of confirming price action, please see the top of this report). In regard to the final option, one could potentially sell at market from between the daily Quasimodo line and parity and place their stop above its surrounding weekly supply zone. This is just an idea for now, which could change depending on how price approaches the sell area.
Levels to watch/live orders:
- Buys: 0.9862-0.9884 [Tentative – confirmation required] (Stop loss: dependent on where one confirms this area).
- Sells: 0.9950 region [Tentative – confirmation required] (Stop loss: dependent on where one confirms this area).1.0037/1.0000 [Could possibly enter at market from this region – will depend on how the H4 price approach the sell zone] (Stop loss: dependent on how we decide to sell here).
DOW 30:
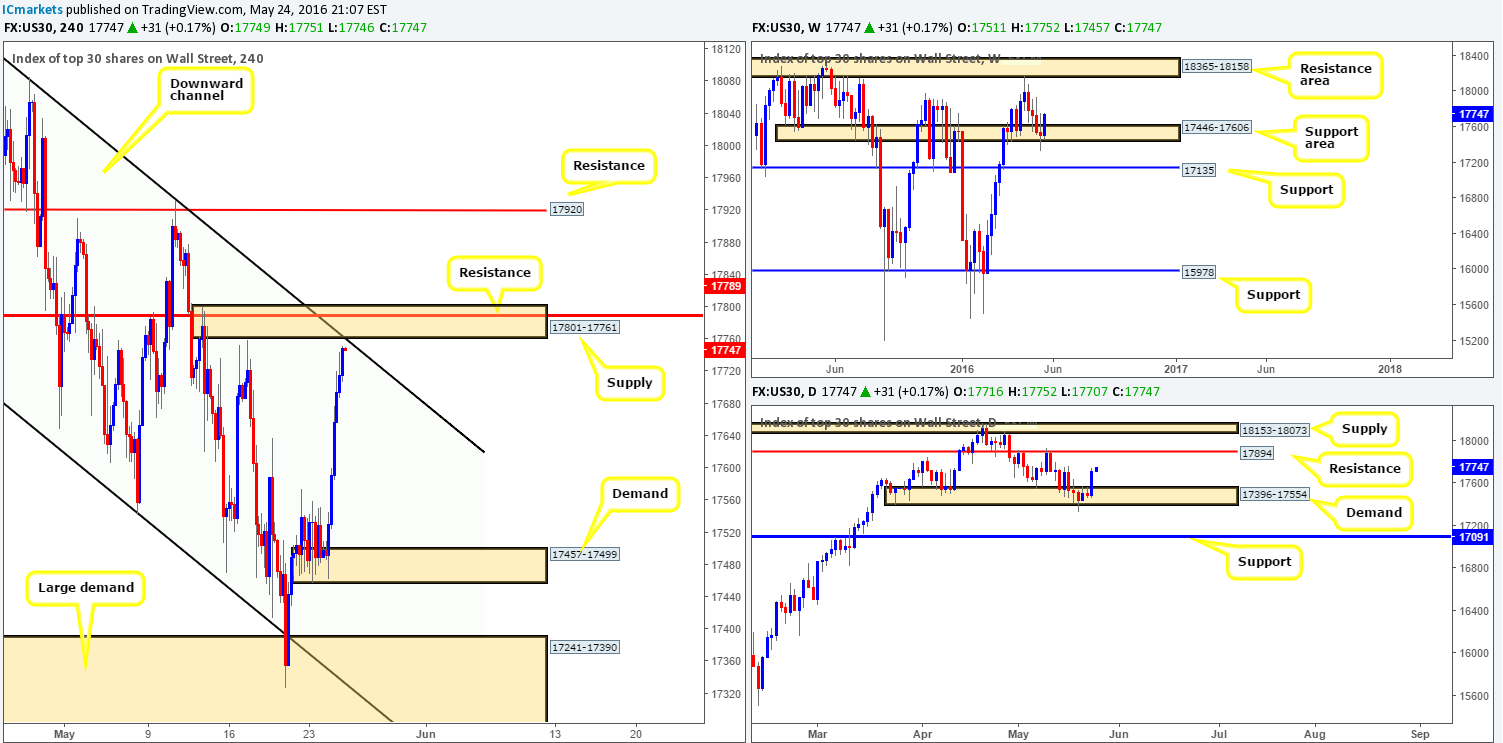
The U.S. DOW remained well-bid through the trading day yesterday, recording a healthy 220-point gain on improved market sentiment. This recent up move, as you can see from the H4 chart, has placed price within shouting distance of a nice-looking H4 supply zone drawn from 17801-17761. Not only does this area blend with a H4 channel resistance line extended from the high 18167, it is also fuses nicely with a H4 resistance band penciled in at 17789.
Considering only the H4 chart for the moment, we would agree that price is at a very tempting location to sell from. Nevertheless, when we throw the higher timeframes into the mix, directional bias changes somewhat. Weekly action is currently finding strong bids from a weekly support area at 17446-17606 and shows room to continue north up to a weekly resistance area at 18365-18158. Daily price, with its recent bounce from daily demand at 17396-17554, also shows room to continue north until at least daily resistance coming in at 17894.
Our suggestions: Trade with caution if you’re looking to short from the current H4 supply zone. We would strongly recommend only trading this area with lower timeframe confirmation (ways to confirm an area can be found at the top of this report). If you are determined to trade this area at market, REDUCE risk a.s.a.p.!
Levels to watch/live orders:
- Buys: Flat (Stop loss: N/A).
- Sells: 17801-17761 [Tentative – confirmation required] (Stop loss: dependent on where one confirms this area).
GOLD:
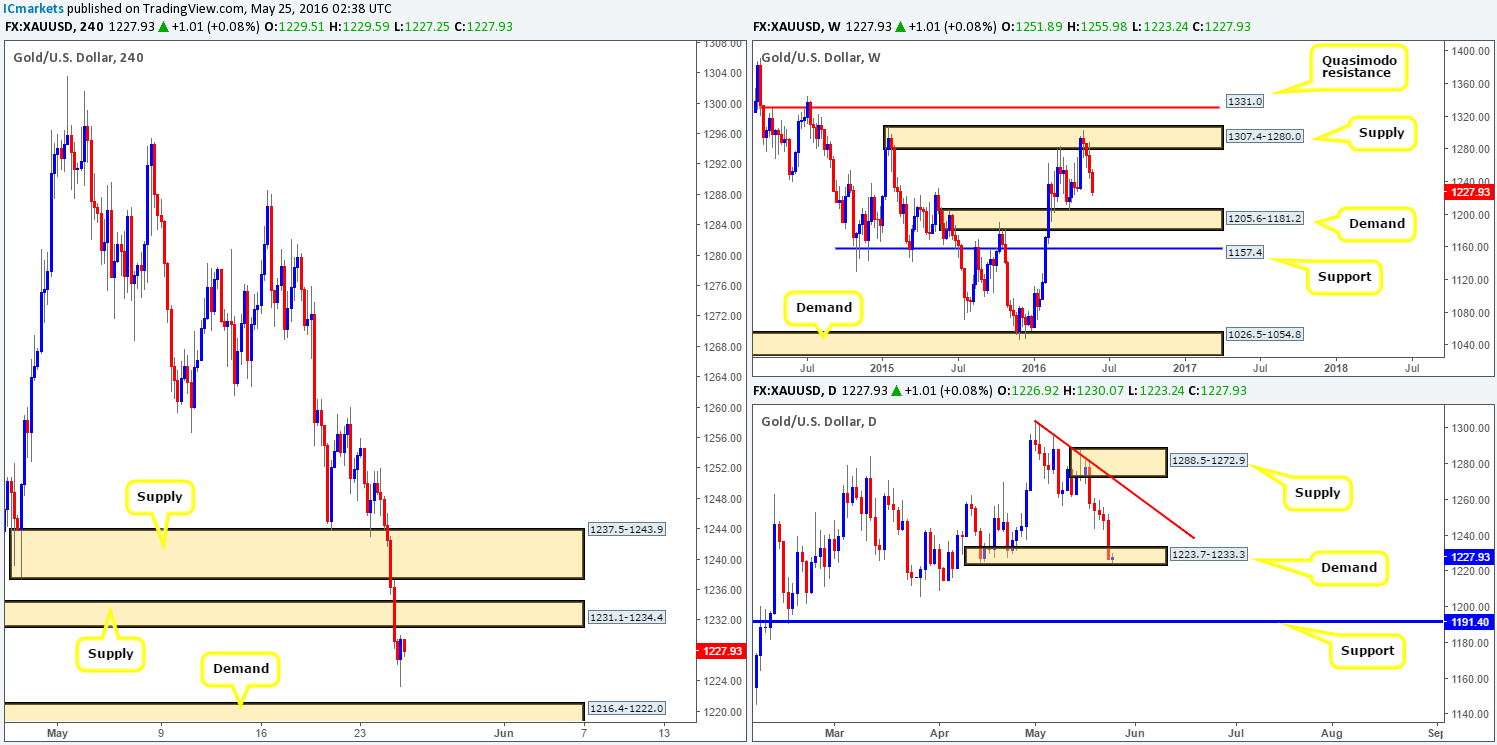
During the course of yesterday’s sessions the yellow metal took yet another hit to the mid-section, as gold fell over $20 in one fell swoop on the back of a stronger dollar. This, as is shown on the H4 chart, took out both H4 demands at 1237.5-1243.9 and 1231.1-1234.4 (now acting supplies), and has since bottomed out around the 1223.2 mark.
What this recent surge in selling also did was extend price lower from weekly supply at 1307.4-1280.0, which continues to head in the direction of its next target – the weekly demand base seen at 1205.6-1181.2. Meanwhile, daily demand at 1223.7-1233.3 also got brought into the action yesterday and has recently suffered a small breach. In the event that price closes beyond here, we see little active demand on this timeframe until price connects with daily support at 1191.4 (sits within the extremes of the above said weekly demand area).
Our suggestions: Given the strength being seen from the weekly supply zone right now (see above), we feel a short from either of the recently broken H4 demand areas (now supplies) could be something to consider today, targeting H4 demand at 1216.4-1222.0 as a first take-profit zone. However, by selling this market, take into consideration that you are selling into the current daily demand, but at the same time, you have the weekly momentum on your side!
Since it is very difficult to tell which H4 supply zone will react, if at all, our team will only consider the two H4 supply zones viable sell areas if and only if a lower timeframe signal forms. For those who have trouble confirming higher timeframe zones from the lower timeframes please check out our list of confirmation signals we use at the top of this report.
Levels to watch/live orders:
- Buys: Flat (Stop loss: N/A).
- Sells: 1237.5-1243.9 [Tentative – confirmation required] (Stop loss: dependent on where one confirms this area). 1231.1-1234.4 [Tentative – confirmation required] (Stop loss: dependent on where one confirms this area).


