
EUR/USD:
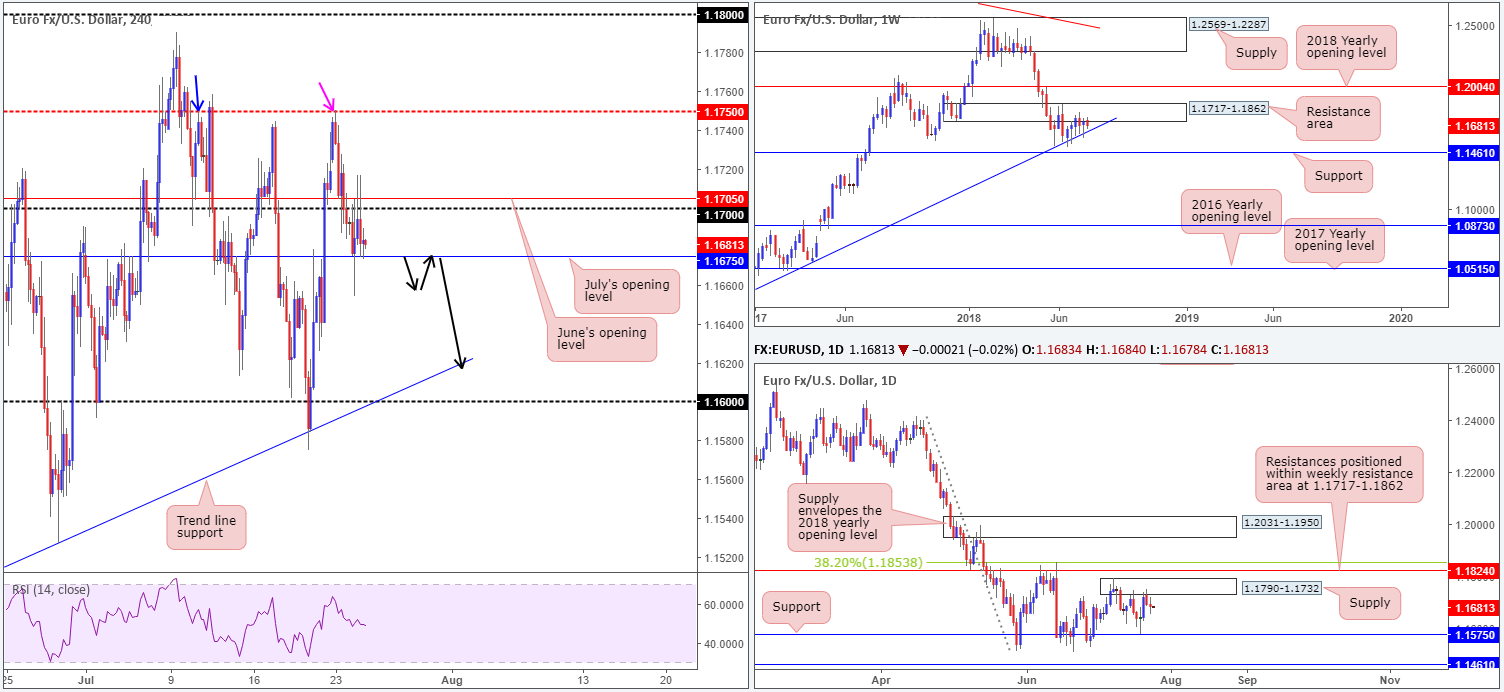
The single currency employed a somewhat directionless approach on Tuesday, decorating the H4 timeframe with fakeouts through both the 1.1705/1.17 area (June’s opening level and round number) and July’s opening level at 1.1675. Stop-loss orders from both areas were likely tripped yesterday. Above 1.1705/1.17 we see 1.1750 as the next upside target. Note this level also happens to represent a Quasimodo resistance (taken from the left shoulder marked with a blue arrow), and has already responded (to-the-pip) once already this week (pink arrow). Below 1.1675, there’s the H4 trend line support (taken from the low 1.1508) and the 1.16 handle in view.
Consequent to yesterday’s action, daily movement chalked up an indecision candle around the underside of a supply zone at 1.1790-1.1732. As you can see from this timeframe, there is room for the sellers to probe as far south as daily support coming in at 1.1575. Weekly flow, on the other hand, is displaying selling interest from the underside of a weekly resistance area priced in at 1.1717-1.1862. Further downside from here has the nearby weekly trend line support (etched from the low 1.0340) to target.
Areas of consideration:
With both weekly and daily timeframes indicating a potential downward move, a break of June’s opening level (H4) mentioned above at 1.1675 may be of interest to some traders, given room on the H4 scale beneath this number to probe as low as the trend line support and 1.16 handle.
An ideal scenario, as far as technical setups go, would be for a H4 close to form beneath 1.1675 that’s followed up with a retest in the shape of a full or near-full-bodied H4 bear candle (sell on the close of the candle with stops above the wick).
Today’s data points: German IFO business climate; EUR M3 money supply y/y.
GBP/USD:
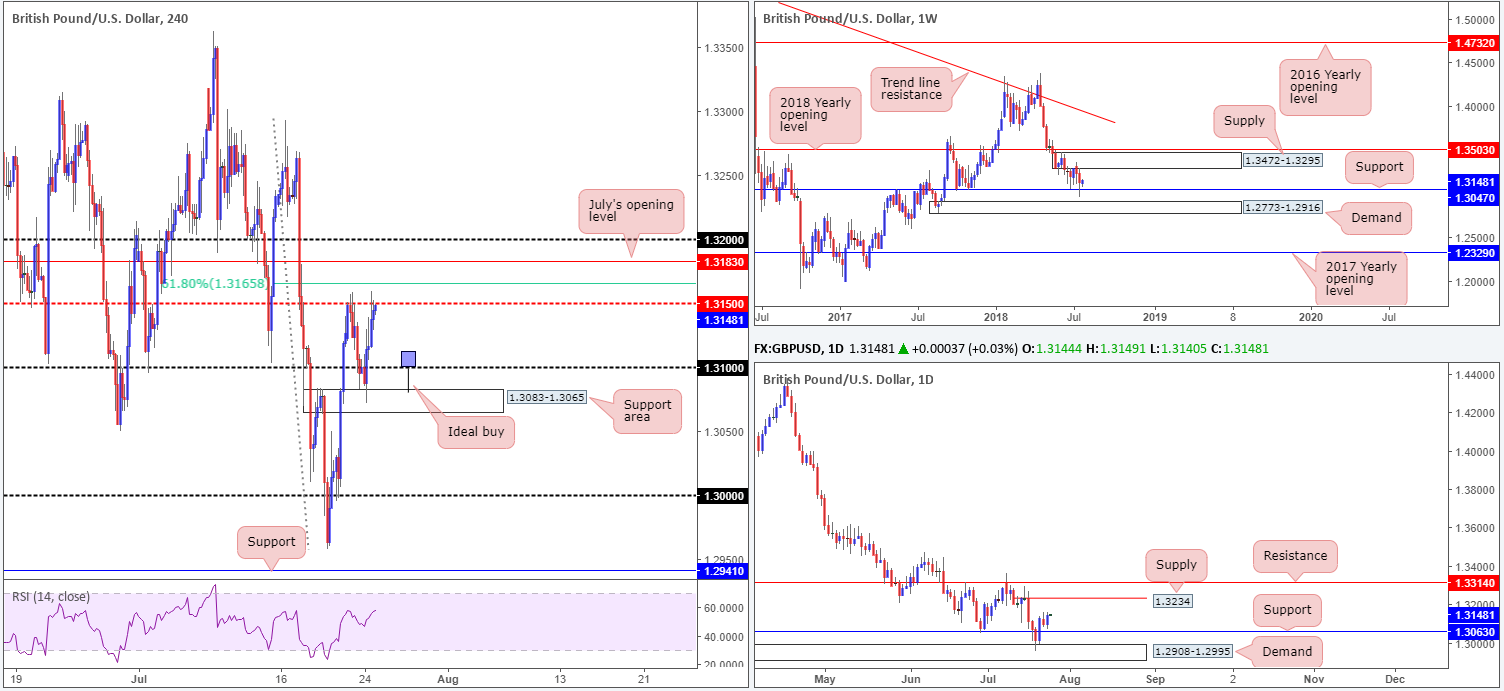
Despite cable breaching the 1.31 handle on Monday, a H4 support area seen nearby at 1.3083-1.3065 provided the market a floor on Tuesday. Swiftly reclaiming the 1.31 handle from here and a large portion of Monday’s losses on the back of Brexit reports suggesting that UK PM May will take the lead role in negotiations with the EU, the pair managed to shake hands with the H4 mid-level resistance at 1.3150 going into the close.
Technically speaking, though, above 1.1750 nearby H4 resistances could hinder upside: the 61.8% Fib resistance value at 1.3165, July’s opening level at 1.3183 and the 1.32 handle. One could argue, however, that these levels are secondary given the bigger picture. On the weekly timeframe, the market witnessed a reasonably solid response take shape last week off support penciled in at 1.3047, despite suffering a whipsaw to lows of 1.2957. The next port of call from here falls in at supply drawn from 1.3472-1.3295. In addition to this, traders may have also noticed room for the daily candles to stretch as far north as supply at 1.3234.
Areas of consideration:
Although the higher timeframes suggest further upside may be on the cards, buying into noted H4 resistances will be a challenge for most traders. An alternative to this is to wait and see if H4 price pulls back off 1.3150 and chalks up a fakeout – a pin-bar candle formation would be ideal as shown on the H4 chart – through 1.31 into the aforementioned H4 support area. Assuming this comes to fruition, entering long on the close of the candle with a stop tucked below its tail is one path to explore, targeting 1.3150 as the initial take-profit zone.
Today’s data points: Limited.
AUD/USD:
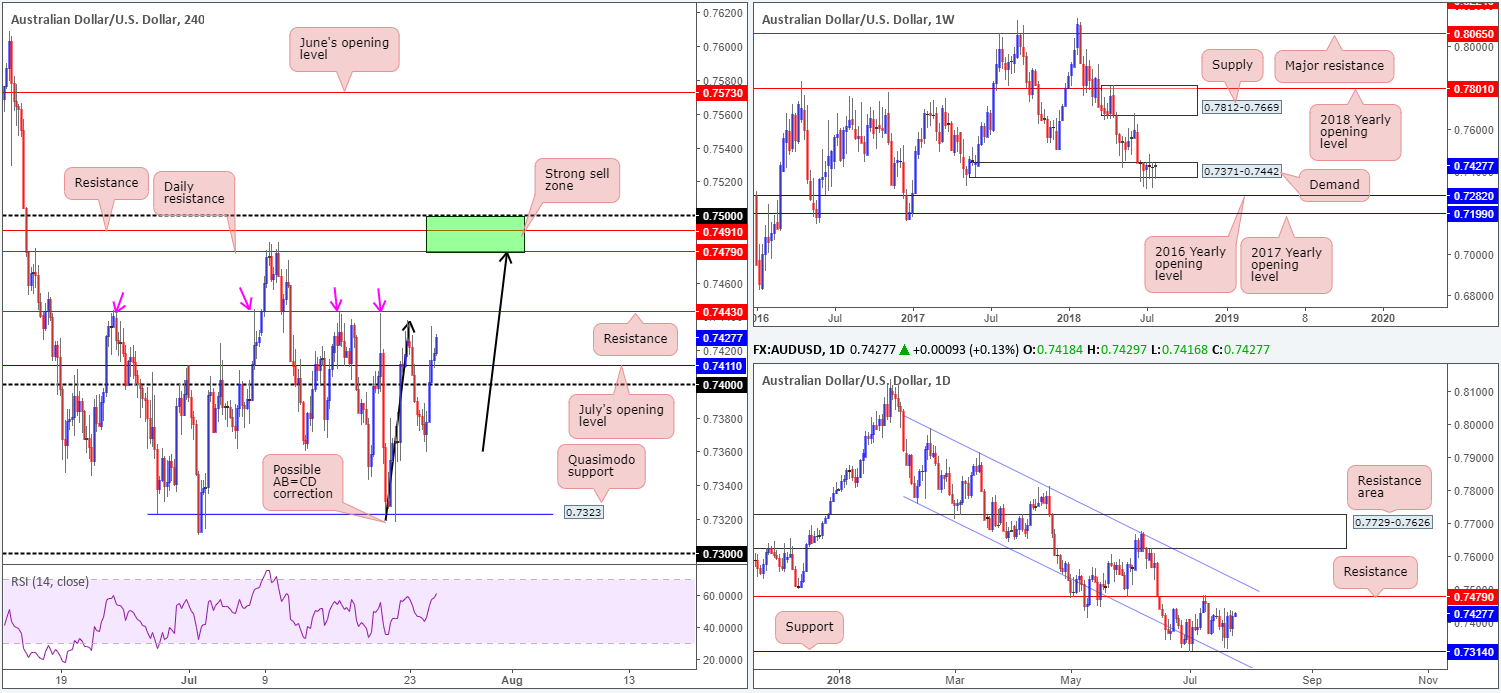
The Australian dollar, as you can see, outperformed on Tuesday, regaining 0.74 status as the USD softened across the board. H4 price is now seen eyeing resistance at 0.7443, a level that’s provided the market a ceiling on a number of occasions in recent history (see pink arrows). Another interesting point on this timeframe is the potential AB=CD formation (black arrows) that completes around the underside of a daily resistance level at 0.7479 (the next upside target on the daily timeframe).
The story over on the weekly timeframe continues to trade unchanged. Price action shows demand at 0.7371-0.7442 remains in a fragile state. Continued indecisiveness here could open the window to a possible test of the 2016 yearly opening level at 0.7282 sometime down the road. In the event that the bulls regain consciousness, however, a retest of supply at 0.7812-0.7669 may be on the cards.
Areas of consideration:
With traders gearing up for this morning’s Australian inflation data, trading this market technically will likely be a challenge for the time being.
Post news, however, keep tabs on the H4 resistance level mentioned above at 0.7443 for a bounce lower. Likewise, keep eyes on daily resistance at 0.7479. The expectation from here is for price to respect this level and print a notable move lower, given its H4 AB=CD approach and nearby H4 resistance at 0.7491/0.75 handle.
Today’s data points: Australian inflation figures.
USD/JPY:
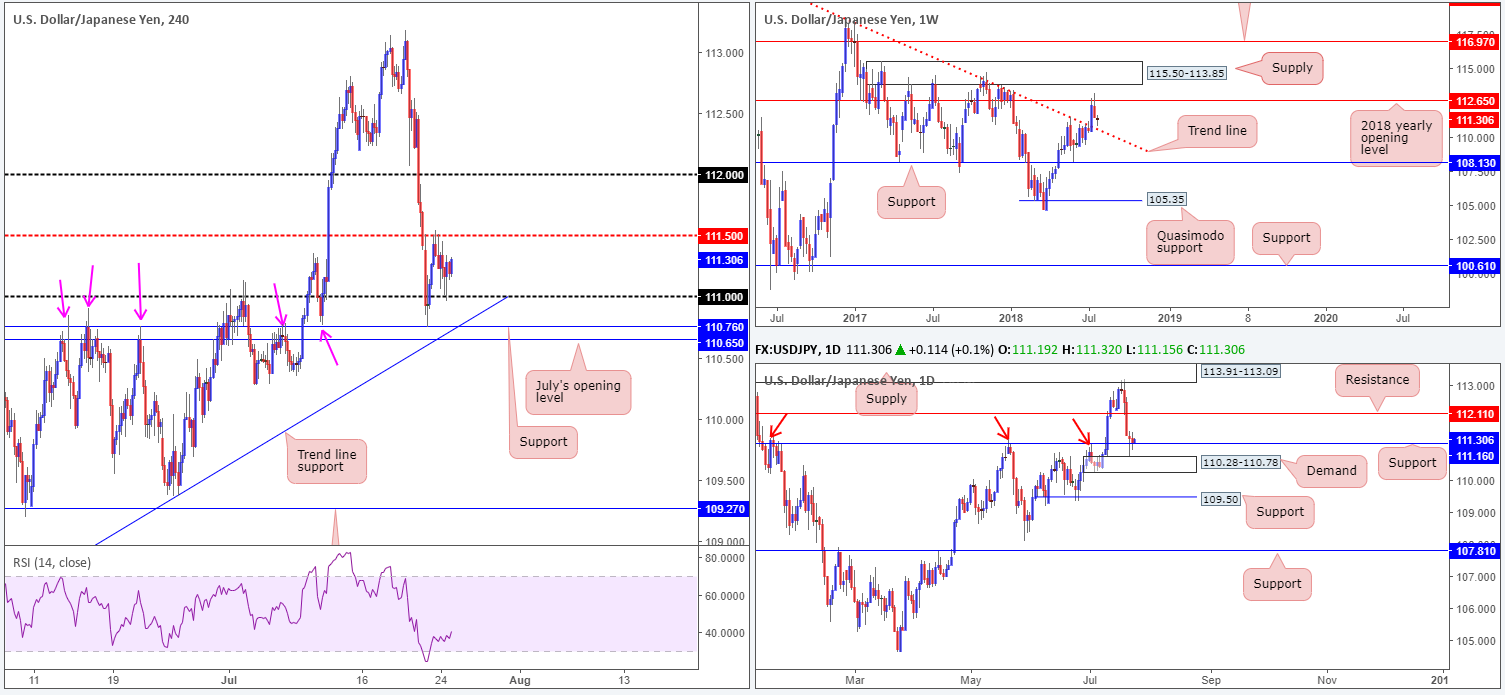
Confined to Monday’s range, the USD/JPY printed very little in terms of market movement on Tuesday. The 111 handle seen on the H4 timeframe remains a focal point on this scale, as does support at 110.76, trend line support (etched from the low 108.11) and July’s opening level at 110.65. To the upside, mid-level resistance at 111.50 is seen capping upside.
Technical action on the weekly timeframe shows the pair finding support just north of trend line resistance-turned support (taken from the high 123.57). Failure to strike this weekly barrier was likely due to daily support at 111.16 and nearby daily demand at 110.28-110.78 entering the fray.
Areas of consideration:
As of writing, the pair is echoing a bullish vibe. Despite H4 price finding modest resistance off 111.50, let’s remember what we have on the daily and weekly timeframes supporting this market!
On account of this, there are two scenarios worthy of watching:
- A retest of the 111 handle as support for a possible entry long. To help avoid a fakeout to nearby H4 supports mentioned above in bold, consider waiting for H4 price to print a full or near-full-bodied bull candle before pulling the trigger (stops best set below the rejection candle’s tail). Ultimately traders will want to see 111.50 taken out before reducing risk to breakeven and taking some profits off the table.
- A H4 close above 111.50 that’s followed up with a retest, targeting the 112 handle, followed closely by daily resistance 112.11 (the next upside target on the daily scale).
Today’s data points: Limited.
USD/CAD:
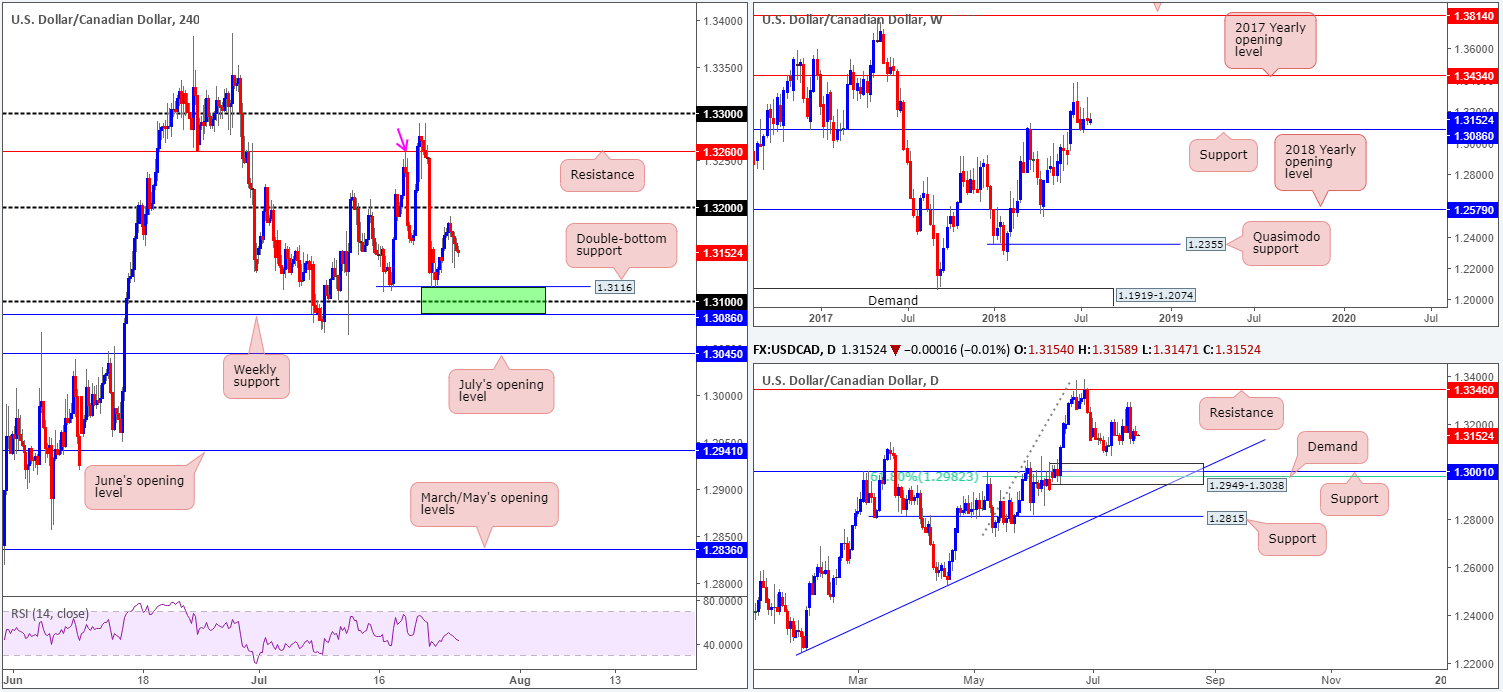
Leaving the 1.32 handle unchallenged on Tuesday, USD/CAD bears went on the attack bolstered by a recovery in oil prices. Although yesterday’s movement was not earth shattering, it has positioned the H4 candles ahead of double-bottom support at 1.3116, the 1.31 handle and most importantly weekly support at 1.3086 (entire area shaded in green).
Weekly support at 1.3086 remains a focal point in this market. Having seen this level provide strong support and resistance over the years, overlooking this hurdle would be unwise. Areas of interest on the daily timeframe can be seen at demand drawn from 1.2949-1.3038. Within this area we also see support standing at 1.3001 along with the 61.8% daily Fib support at 1.2982. To the upside there’s resistance plotted at 1.3346.
Areas of consideration:
In light of yesterday’s pullback, a break the 1.31 handle to tackle weekly support at 1.3086 is possibly on the table today/tomorrow. This would be an ideal location to be looking for longs. To help avoid getting stopped out on a fakeout through the weekly support, though, traders are urged to wait and see if H4 price can chalk up a full or near-full-bodied bull candle before pulling the trigger. While this will not guarantee a winning trade, it will show buyer intent.
Today’s data points: Limited.
USD/CHF:
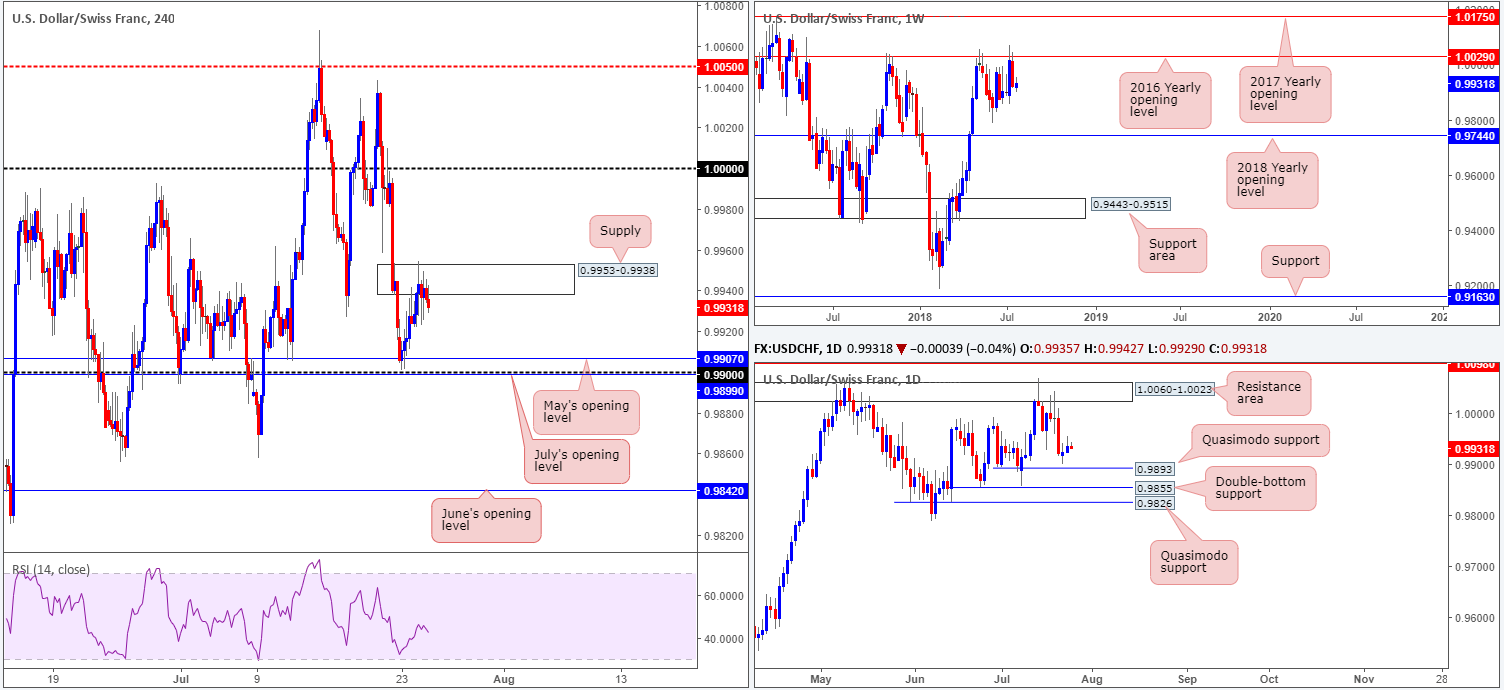
H4 supply at 0.9953-0.9938 remains in the fray despite yesterday’s action piercing through the top edge of this zone and likely tripping stops. Above this area, not a whole lot of resistance is visible until around parity (1.0000). To the downside, nonetheless, traders’ crosshairs likely remain fixed on May’s opening level at 0.9907 and the 0.99 handle.
Weekly price is capped by the 2016 yearly opening level at 1.0029. Additional resistance is seen beyond this line at 1.0175: the 2017 yearly opening level, whereas below 1.0029 we have June lows at 0.9788 to target, as well as the 2018 yearly opening level at 0.9744. Turning the focus to the daily timeframe, we can see the unit hovering just north of Quasimodo support at 0.9893. Note the additional layer of supports seen directly below at 0.9855 (a double-bottom formation) and another Quasimodo support at 0.9826.
Areas of consideration:
Continued selling from the current H4 supply zone will likely lead to a fakeout of 0.99 to tackle the daily Quasimodo support mentioned above at 0.9893. This is an area traders should have bookmarked as a possible reversal zone for longs.
Continued buying, however, as mentioned above, has parity to target on the H4 scale. A decisive H4 close above the current supply that’s followed up with a retest as support would, in our view, be sufficient enough to confirm bullish intent.
Today’s data points: Limited.
Dow Jones Industrial Average:
A reasonably strong recovery in oil prices lifted energy shares on Tuesday. Also, the market witnessed sharp gains in technology stocks, inspired by Google Alphabet’s upbeat Q2 earnings results.
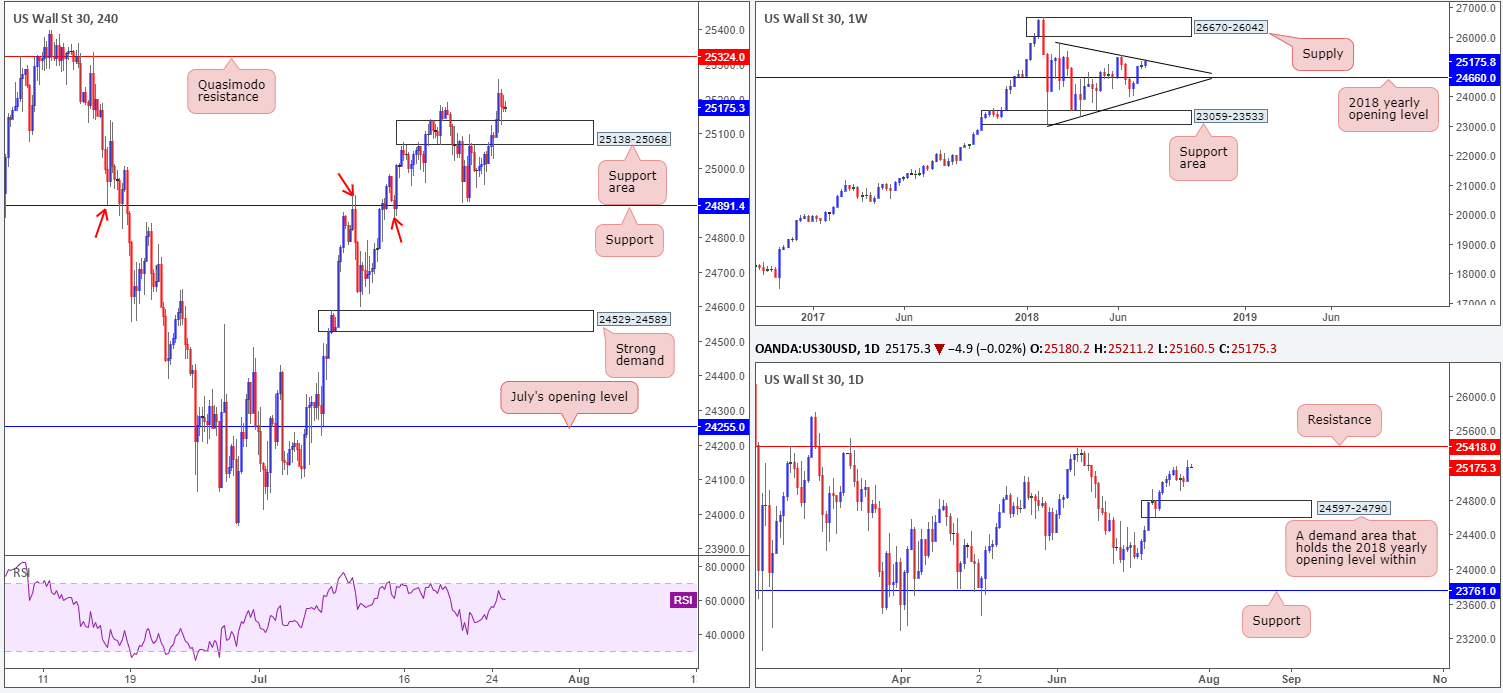
The DJIA pushed to fresh highs of 25256, firmly smashing through a H4 resistance area at 25138-25068 and retesting it as support. The next area of concern falls in at 25324: a H4 Quasimodo resistance level.
The other key thing to note in this market is weekly price is crossing swords with trend line resistance (etched from the high 25807). This level will likely hinder H4 price from reaching the noted Quasimodo resistance. On the daily timeframe, nevertheless, it appears we have a clear run to resistance at 25418.
Areas of consideration:
Buying this market off the current H4 support area is tricky, as you’d effectively be entering long directly into a weekly trend line resistance!
In view of this, the team has noted to keep eyes on how H4 price behaves at current price. A H4 full or near-full-bodied bearish candle printed from this region is a high-probability sell signal that’ll likely strike at least the H4 support mentioned above at 24891. Our rationale here is that weekly sellers will take precedence over daily and H4 buyers.
Today’s data points: Limited.
XAU/USD (Gold)
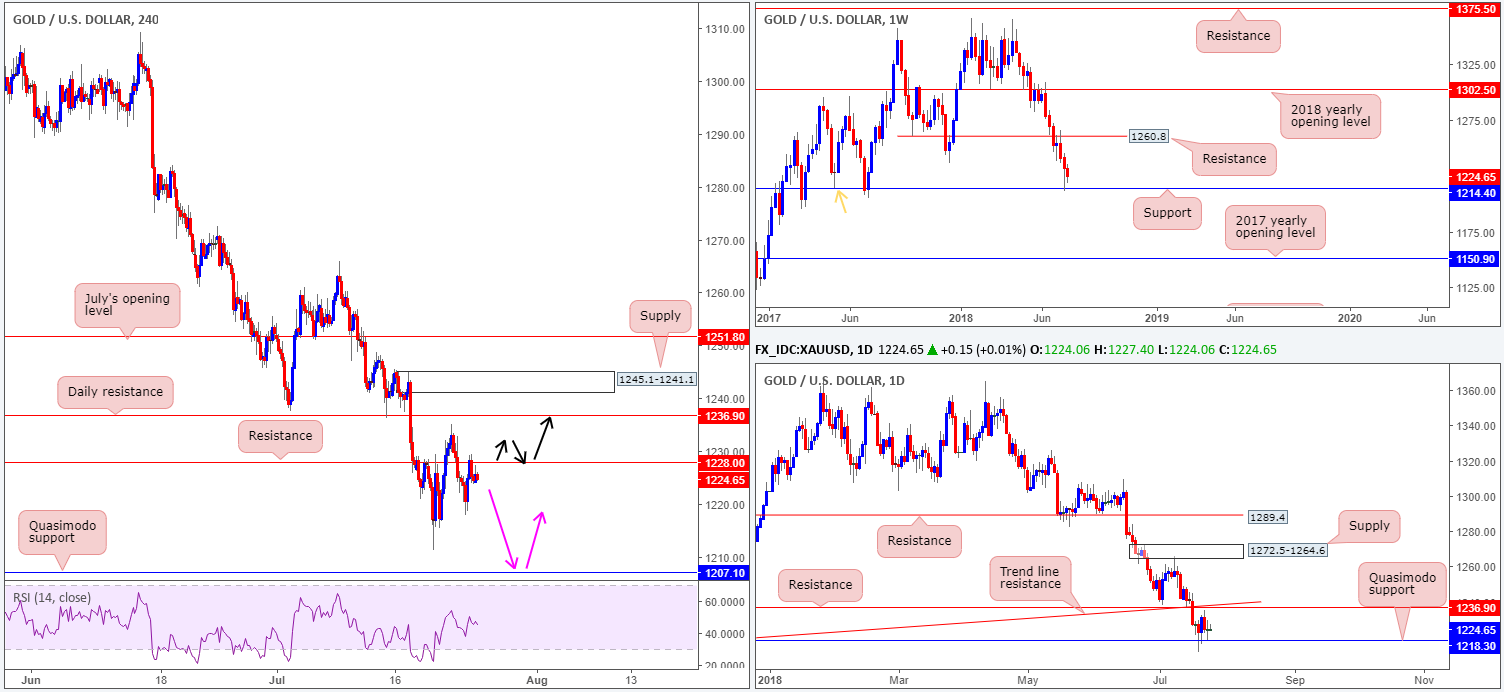
As highlighted in Tuesday’s briefing, bullion’s longer-term structure conveys a bullish message at the moment. Weekly support drawn from 1214.4 remains in play. The level also represents a weekly Quasimodo support taken from the left shoulder marked with an orange arrow. In addition to this, we can see daily price holding ground at Quasimodo support penciled in from 1218.3. Further buying from this point has resistance at 1236.9 on its radar. Therefore, selling from the H4 resistance level at 1228.0, which is currently in play, is a chancy move, in our opinion.
Areas of consideration:
Traders should still have alerts placed around the H4 Quasimodo support level at 1207.1. A test of this level in the shape of a full or near-full-bodied H4 bull candle would, according to the technicals, be a high-probability long as it is in line with higher-timeframe flows (pink arrows). As usual, stop-loss orders are best placed beyond the rejection candle’s tail.
In the event the market witnesses a H4 close above the current resistance at 1228.0, all eyes will likely be fixed on daily resistance mentioned above at 1236.9. Should one be nimble enough to drill down to the lower timeframes, a retest play off 1228.0 could be an option, targeting the said daily resistance (black arrows).
The use of the site is agreement that the site is for informational and educational purposes only and does not constitute advice in any form in the furtherance of any trade or trading decisions.
The accuracy, completeness and timeliness of the information contained on this site cannot be guaranteed. IC Markets does not warranty, guarantee or make any representations, or assume any liability with regard to financial results based on the use of the information in the site.
News, views, opinions, recommendations and other information obtained from sources outside of www.icmarkets.com.au, used in this site are believed to be reliable, but we cannot guarantee their accuracy or completeness. All such information is subject to change at any time without notice. IC Markets assumes no responsibility for the content of any linked site. The fact that such links may exist does not indicate approval or endorsement of any material contained on any linked site.
IC Markets is not liable for any harm caused by the transmission, through accessing the services or information on this site, of a computer virus, or other computer code or programming device that might be used to access, delete, damage, disable, disrupt or otherwise impede in any manner, the operation of the site or of any user’s software, hardware, data or property.


