
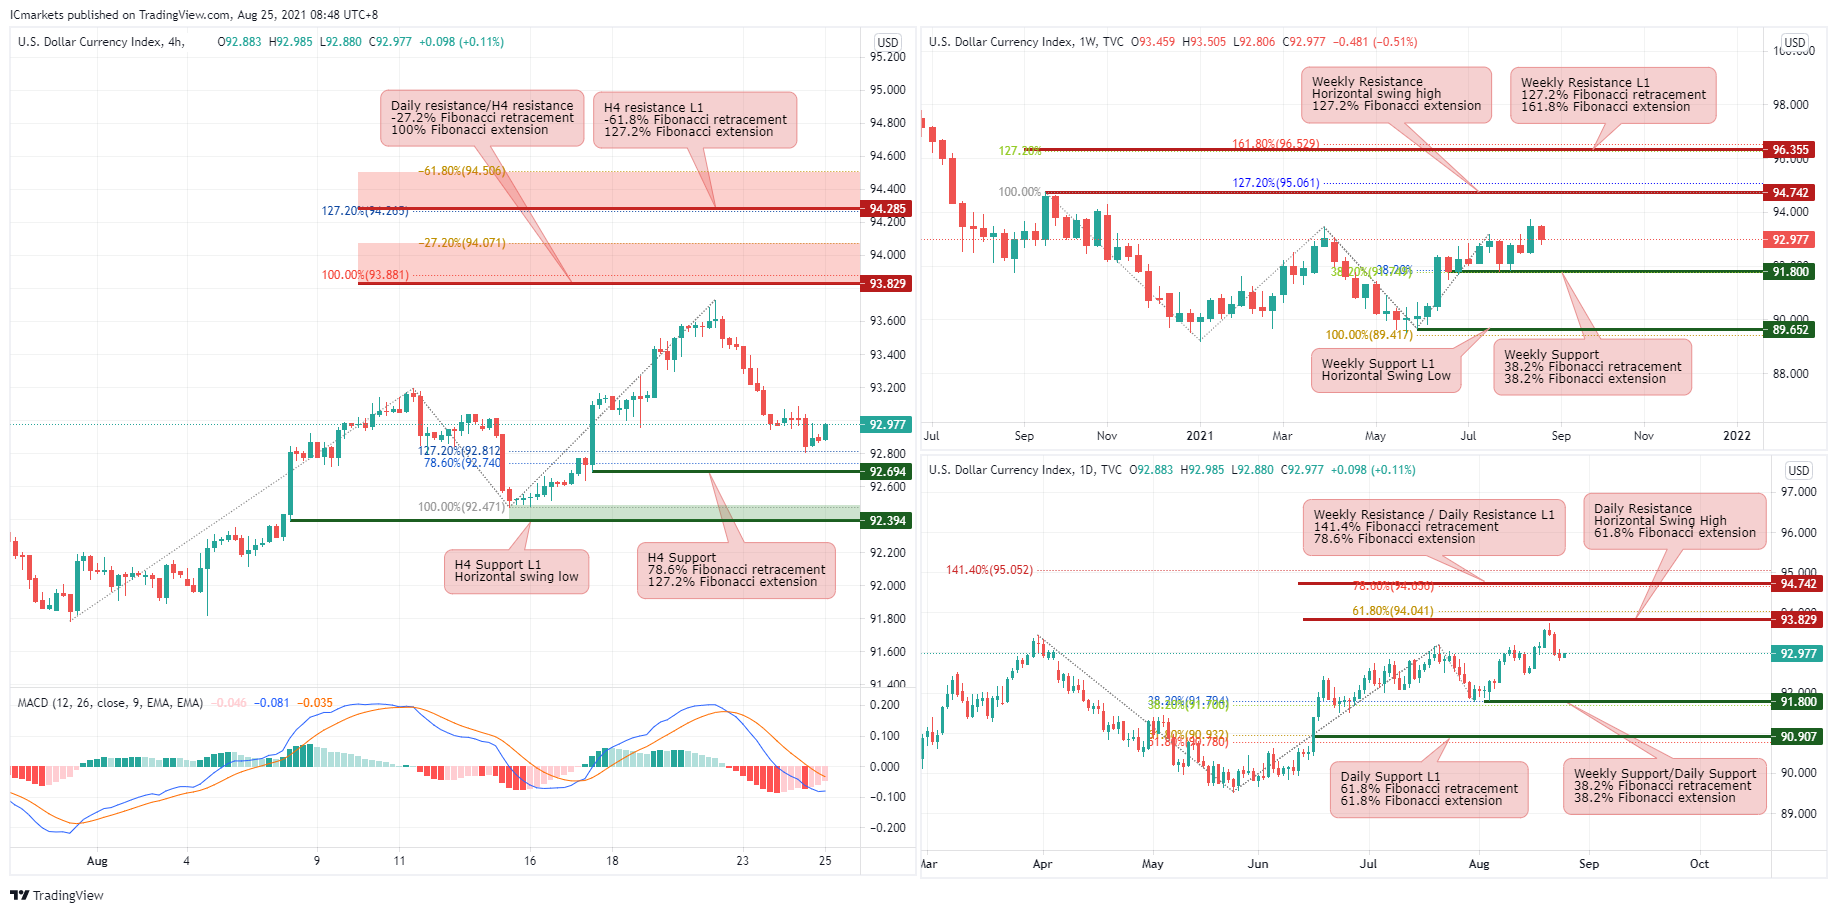
DXY:
Looking at the Weekly chart price may bearish towards the weekly support at 91.8 in line with 38.2% Fibonacci retracement and 38.2% Fibonacci extension. On the other hand, price may be bullish towards the weekly resistance at 94.742 in line with 127.2% Fibonacci extension and Horizontal swing high.
On the Daily timeframe, price is testing the Daily resistance at 93.829 in line with Horizontal swing high and 61.8% Fibonacci extension and may bearish towards the Daily support at 91.8 in line with 38.2% Fibonacci retracement and 38.2% Fibonacci extension. On the other hand, price may be bullish towards the Daily resistance L1 at 94.742 in 141.4% Fibonacci retracement and 78.6% Fibonacci extension.
On the H4 timeframe, price may bearish towards the H4 support at 92.694 in line with 78.6% Fibonacci retracement and 127.2% Fibonacci extension. Our bearish bias is further supported by how MACD is shown to be holding below the 0 line. On the other hand, price may bullish towards the H4 resistance at 93.829 in line with -27.2% Fibonacci retracement and 100% Fibonacci extension..
Areas of consideration:
- H4 resistance of 93.829
- H4 support of 92.694
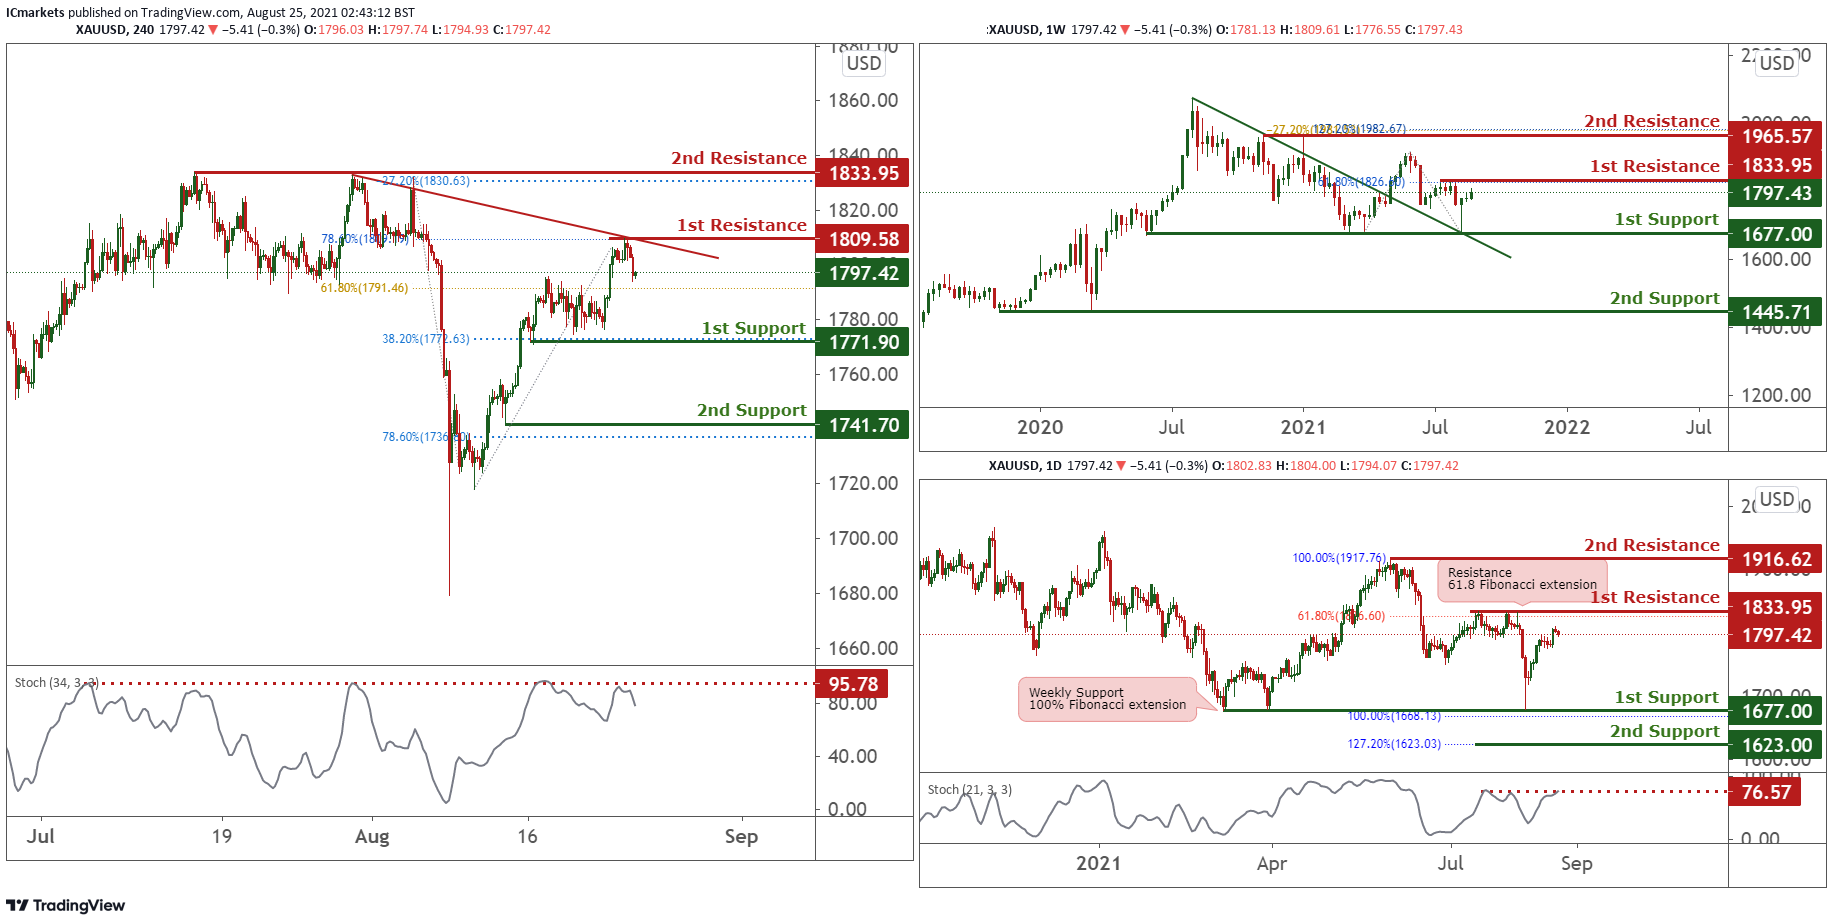
XAU/USD (GOLD):
On the weekly timeframe, price bounced above descending trendline support at 1677. Price is now holding below 1833 resistance. Long term sellers could possibly add to their positions here and push price lower towards graphical support at 1677 level. Otherwise, a break above our resistance will see price push higher towards our 2nd resistance.
On the Daily, price trading sideways, holding below 1st resistance at 1833. We see a medium probability bearish scenario where sellers may enter with their shorts and looking for a possible target at the weekly support level of 1677. Stochastics is reacting below short term intermediate resistance as well.
On the H4, price pushed higher, tested and reacted below descending trendline resistance and our graphical overlap resistance at 1809. With stochastics approaching resistance where price pulled lower in the past, we see a medium probability bearish scenario where sellers may add to their shorts and push price lower towards our 1st support at 1771. Otherwise, failure to hold below 1st resistance will see price swing the other way towards our 2nd resistance at 1833.
Areas of consideration:
- H4 resistance of 1809
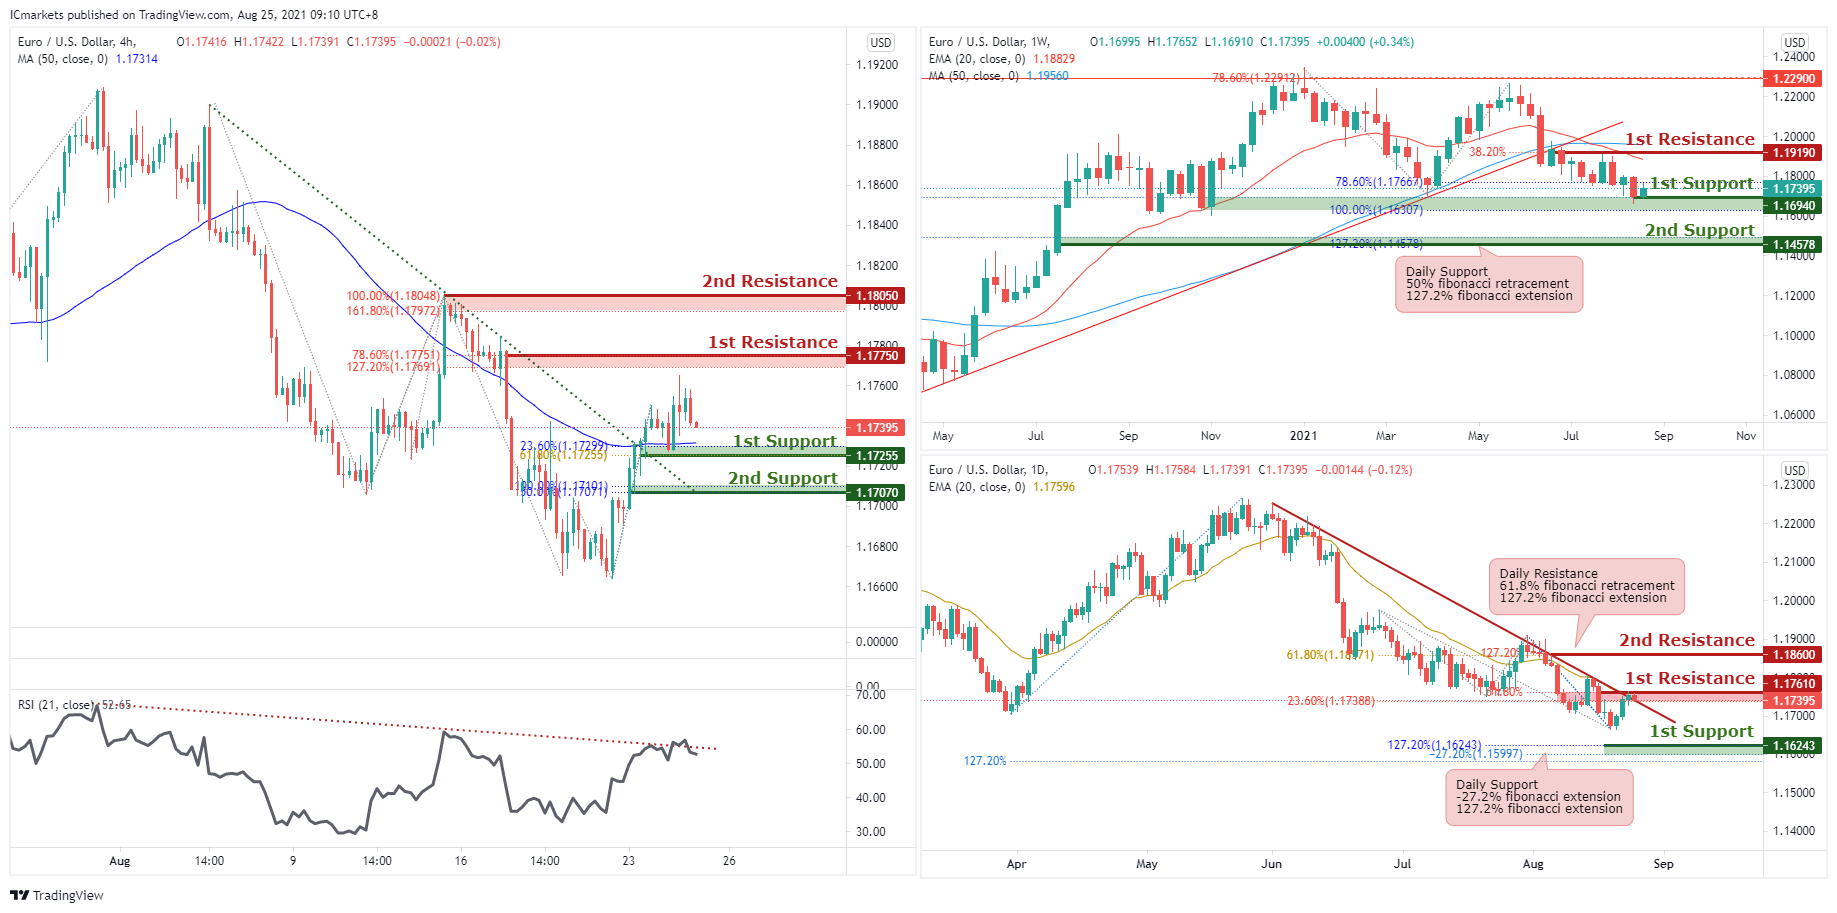
EUR/USD:
Looking at the weekly chart we can see that price bounced from support at 1.16940, in-line with 38.2% Fibonacci retracement and 100% Fibonacci extension. On the Daily chart, price bounced back to resistance at 1.17610, in-line with 23.6% Fibonacci retracement , 61.8% Fibonacci extension and descending trendline resistance. Price could potentially face further bearish pressure at this level.
On the H4 timeframe prices pulled-back to first support at 1.17255, in-line with 23.6% Fibonacci retracement, 61.8% Fibonacci extension and 50MA. We could potentially see the price drop further to our next support at 1.17070, in-line with 50% Fibonacci retracement, 100% Fibonacci extension and descending trendline resistance-turned-support. RSI is also at descending trendline resistance for further bearish momentum.
If the price bounces, it could potentially swing towards first resistance at 1.17750, in-line with 78.6% Fibonacci retracement and 127.2% Fibonacci extension. The next potential resistance could be at 1.18050, in-line with 100% Fibonacci retracement and 161.8% Fibonacci extension.
Areas of consideration:
- H4 time frame, support level at 1.17750 and 1.18050
- H4 time frame, resistance level at 1.17255 and 1.17070
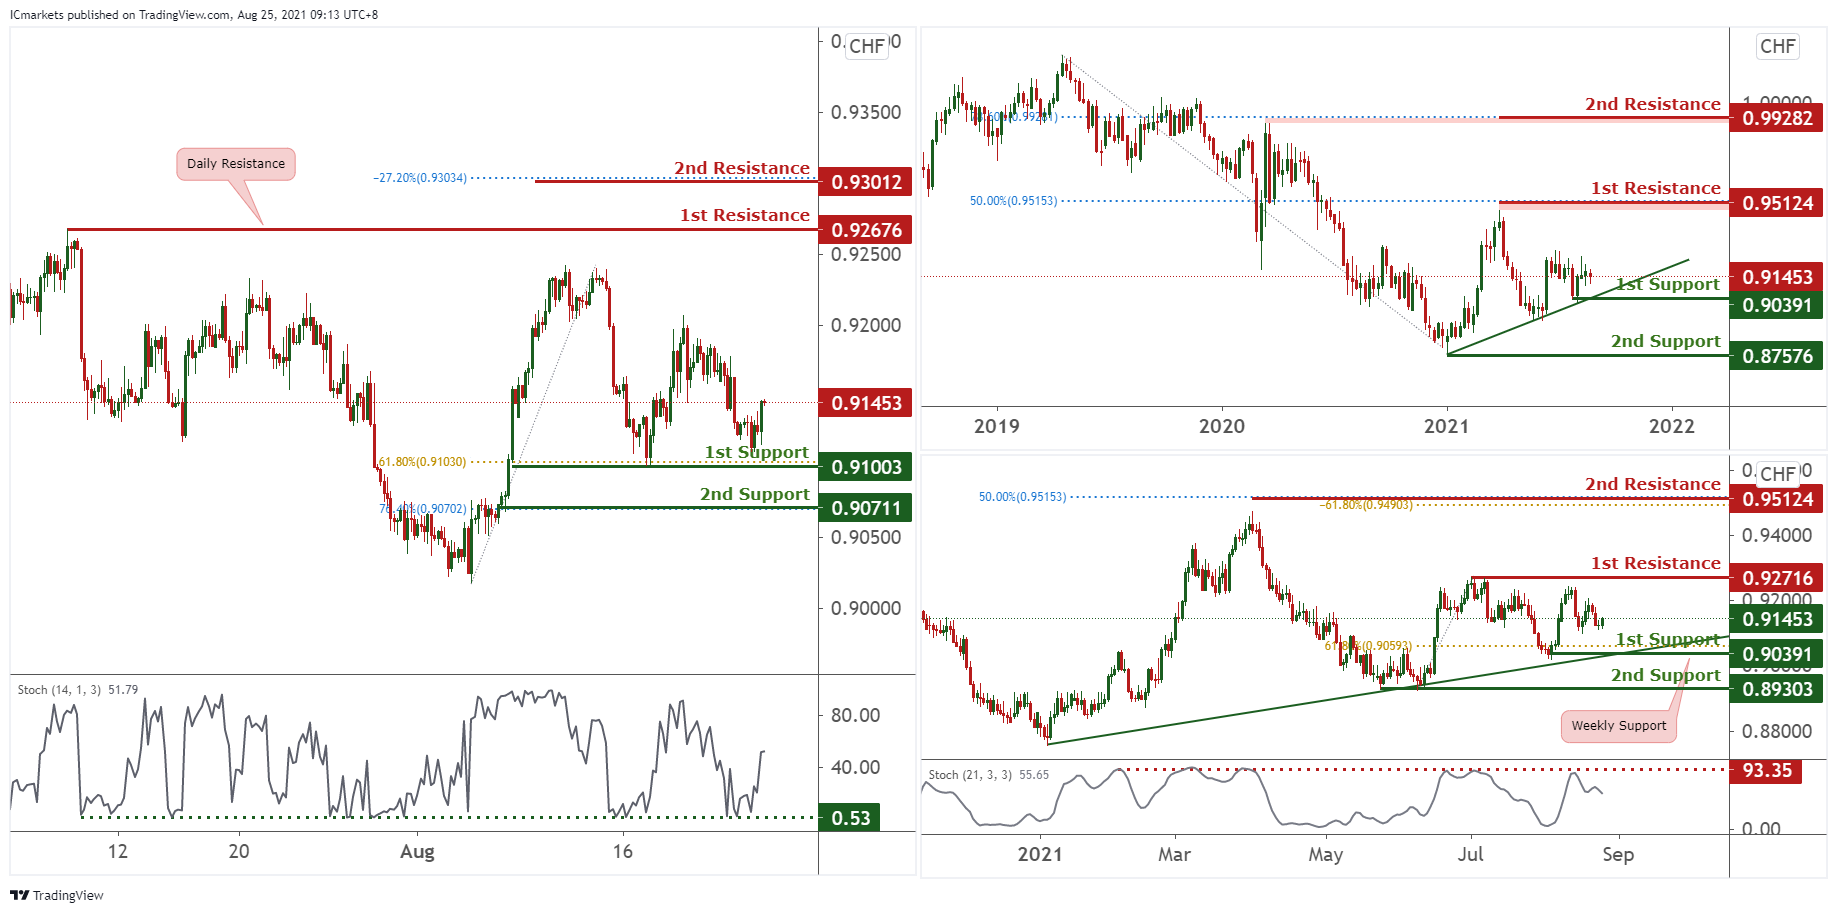
USD/CHF:
On the weekly, price is holding above ascending trendline support and also between 1st resistance at 0.95124 and 1st support at 0.90391. Traders should watch these levels closely for a break to see prices swing higher or drop lower. On the Daily, the price did not reach a graphical swing high. It is seen to have a bearish movement towards the 1st support at 0.90391. With stochastics testing resistance where price dropped in the past, we see a possibility that sellers could enter and push price towards the 1st support at 0.90391
On the H4, price is seen to have bounced off near the first support upwards towards the 1st Resistance in line with the daily resistance. Price is expected to continue to move upwards. Our bias for the short term is bullish as the Stochastic indicator shows that the K% line bounced off the strong support line showing a potential bullish movement.
Areas of consideration:
- Watch Daily resistance at 0.92716
- Watch H4 support at 0.91003
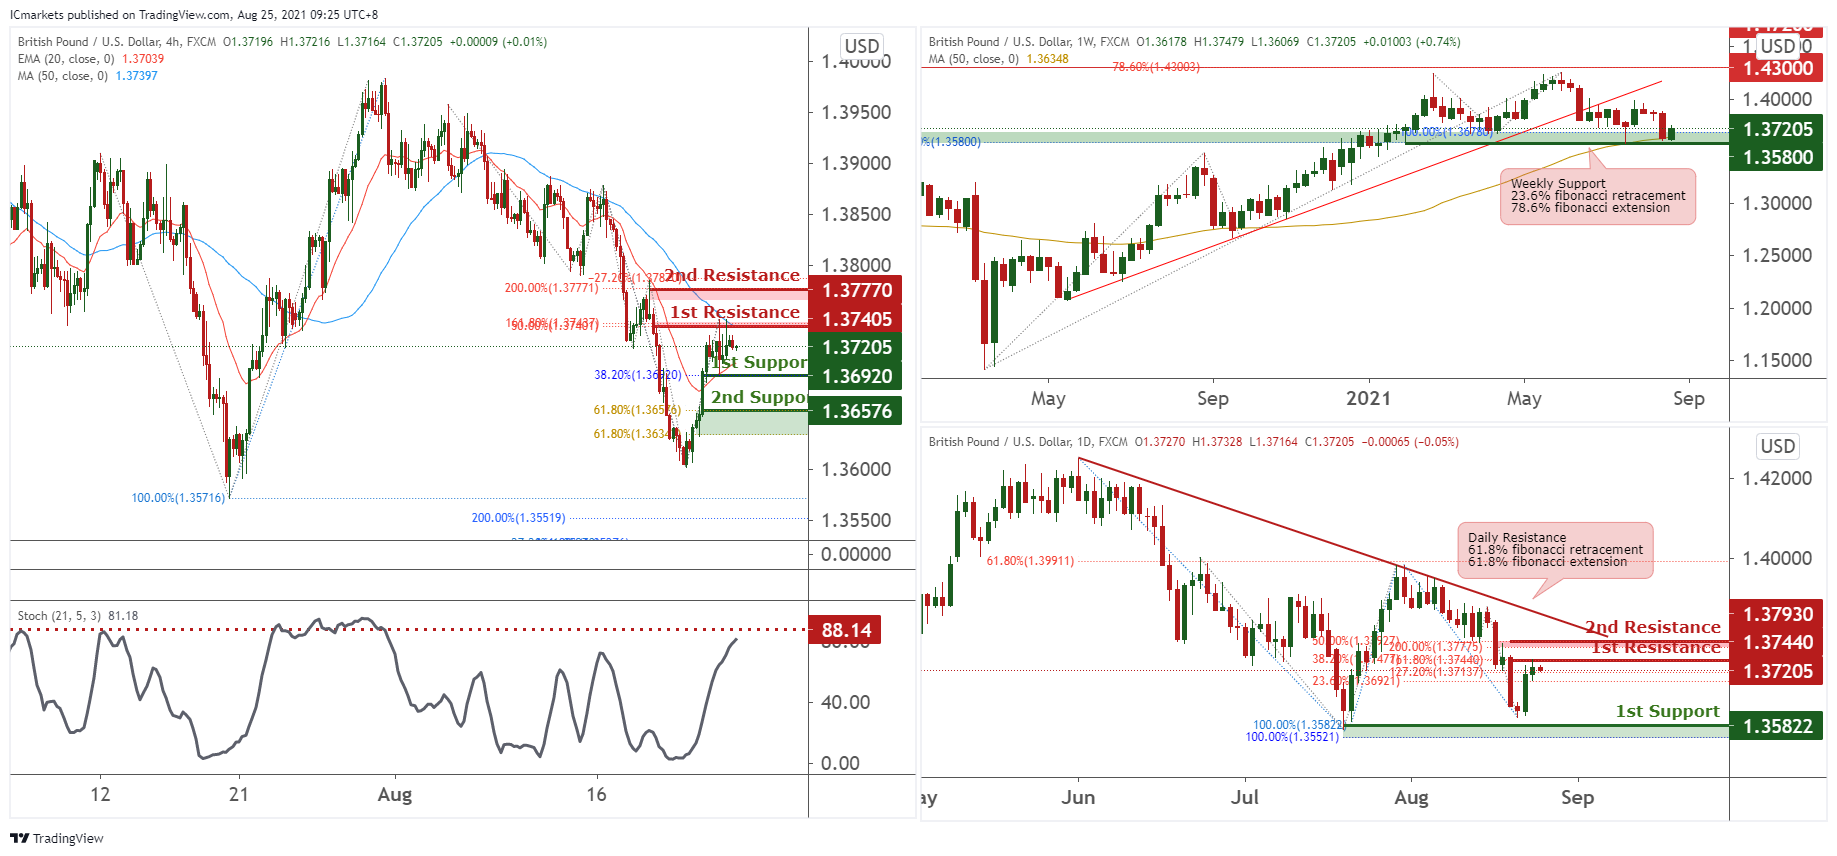
GBP/USD:
Looking at the weekly chart, price dropped to support at 1.35800, in-line with 23.6% Fibonacci retracement, 78.6% Fibonacci extension and 50MA. On the Daily time frame price swung towards resistance at 1.37140, in-line with 23.6% Fibonacci retracement and 127.2% Fibonacci extension.
On the H4 timeframe, prices tested first resistance at 1.37405 before facing bearish pressure, in-line with 50% Fibonacci retracement and 161.8% Fibonacci extension. We could potentially see the price drop to first support at 1.36920, in-line with 38.2% Fibonacci retracement. If the price drops further, the next potential support will be at 1.36576, in-line with 61.8% Fibonacci retracement and 61.8% Fibonacci extension. Stochastic is also approaching resistance where previous drops occurred.
If price breaks above first resistance, it could potentially swing towards next resistance at 1.37770, in-line with -27.2% Fibonacci retracement and 200% Fibonacci extension.
Areas of consideration:
- H4 time frame, 36920 and 1.36576 support level
- H4 time frame, 1.37405 and 1.37770 resistance level
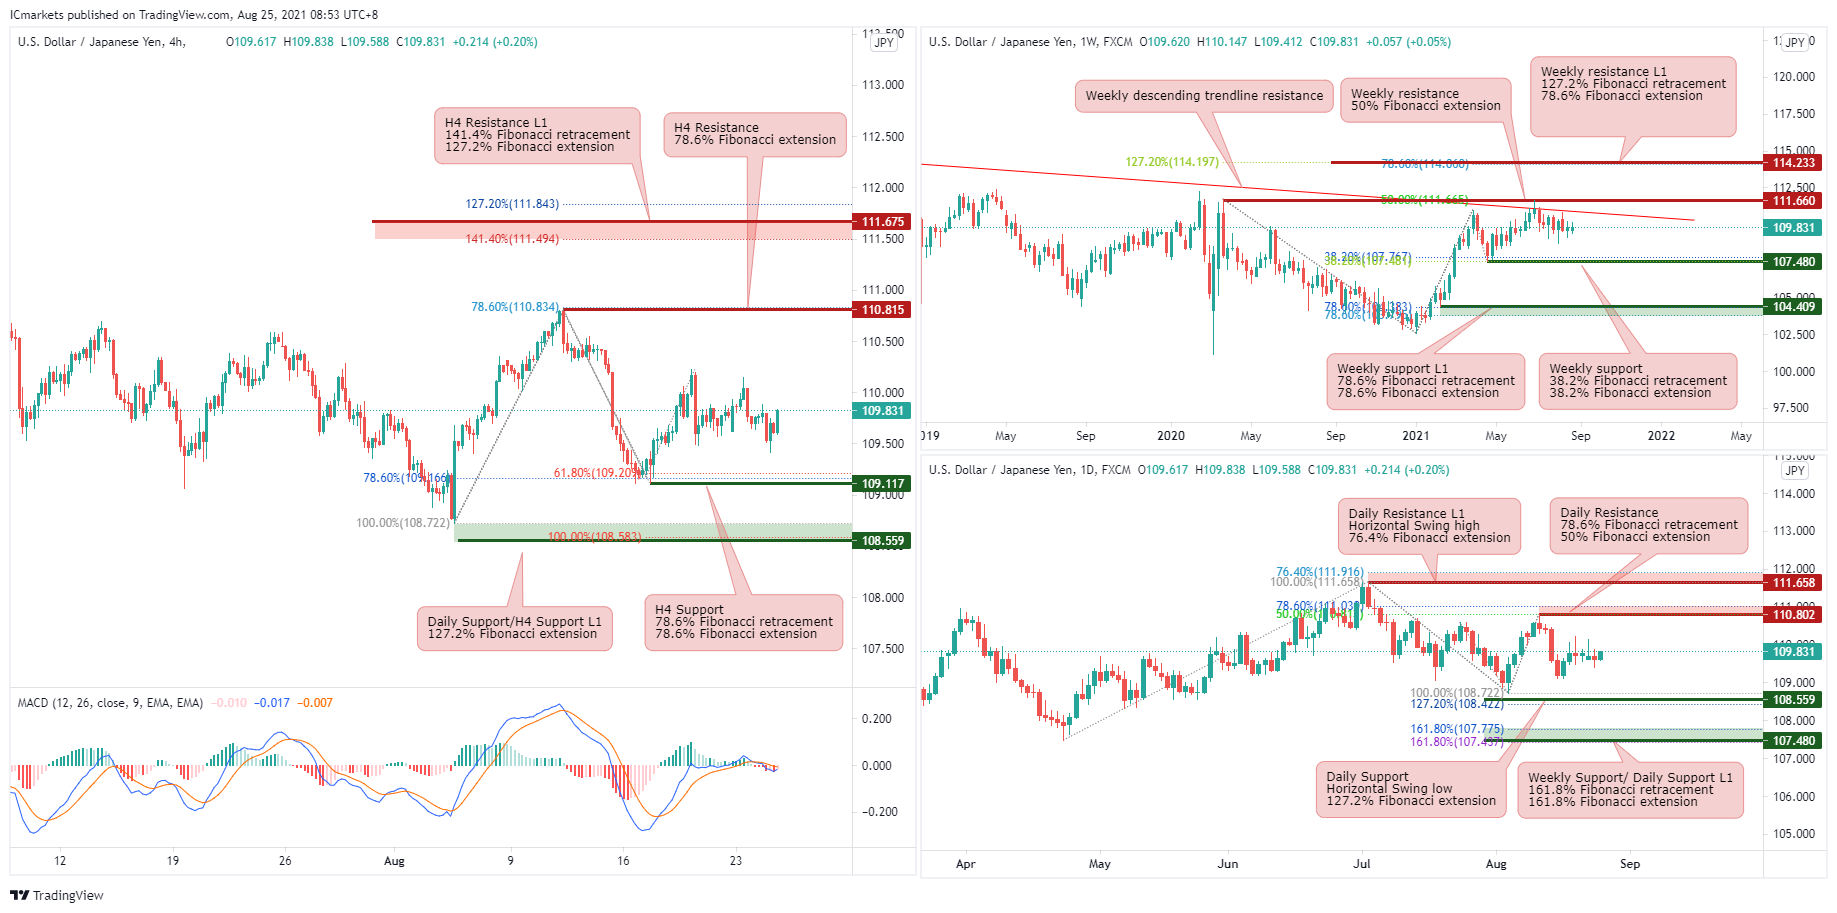
USD/JPY
From the weekly timeframe, price is below the descending trendline resistance, and may bearish to weekly support 107.480 in line with 38.2% Fibonacci retracement and 38.2% Fibonacci extension. On the other hand, price might move above the weekly descending trendline resistance and may move towards the weekly resistance at 111.660 in line with 50% Fibonacci extension.
On the Daily timeframe, price may bearish to the Daily support at 108.559 in line with 127.2% Fibonacci extension. On the other hand, price might move towards the Daily resistance at 110.802 in line with 78.6% Fibonacci retracement and 50% Fibonacci extension.
On the H4 timeframe, price may bearish to the H4 support at 109.117 in line with 78.6% Fibonacci retracement and 78.6% Fibonacci extension. Our bearish bias is further supported by how MACD is shown to be holding below the 0 line. On the other hand, price might move towards the H4 resistance at 110.815 in line with 78.6% Fibonacci extension.
Areas of consideration:
- 815 resistance level on the H4 timeframe
- 117 support level on the H4 timeframe
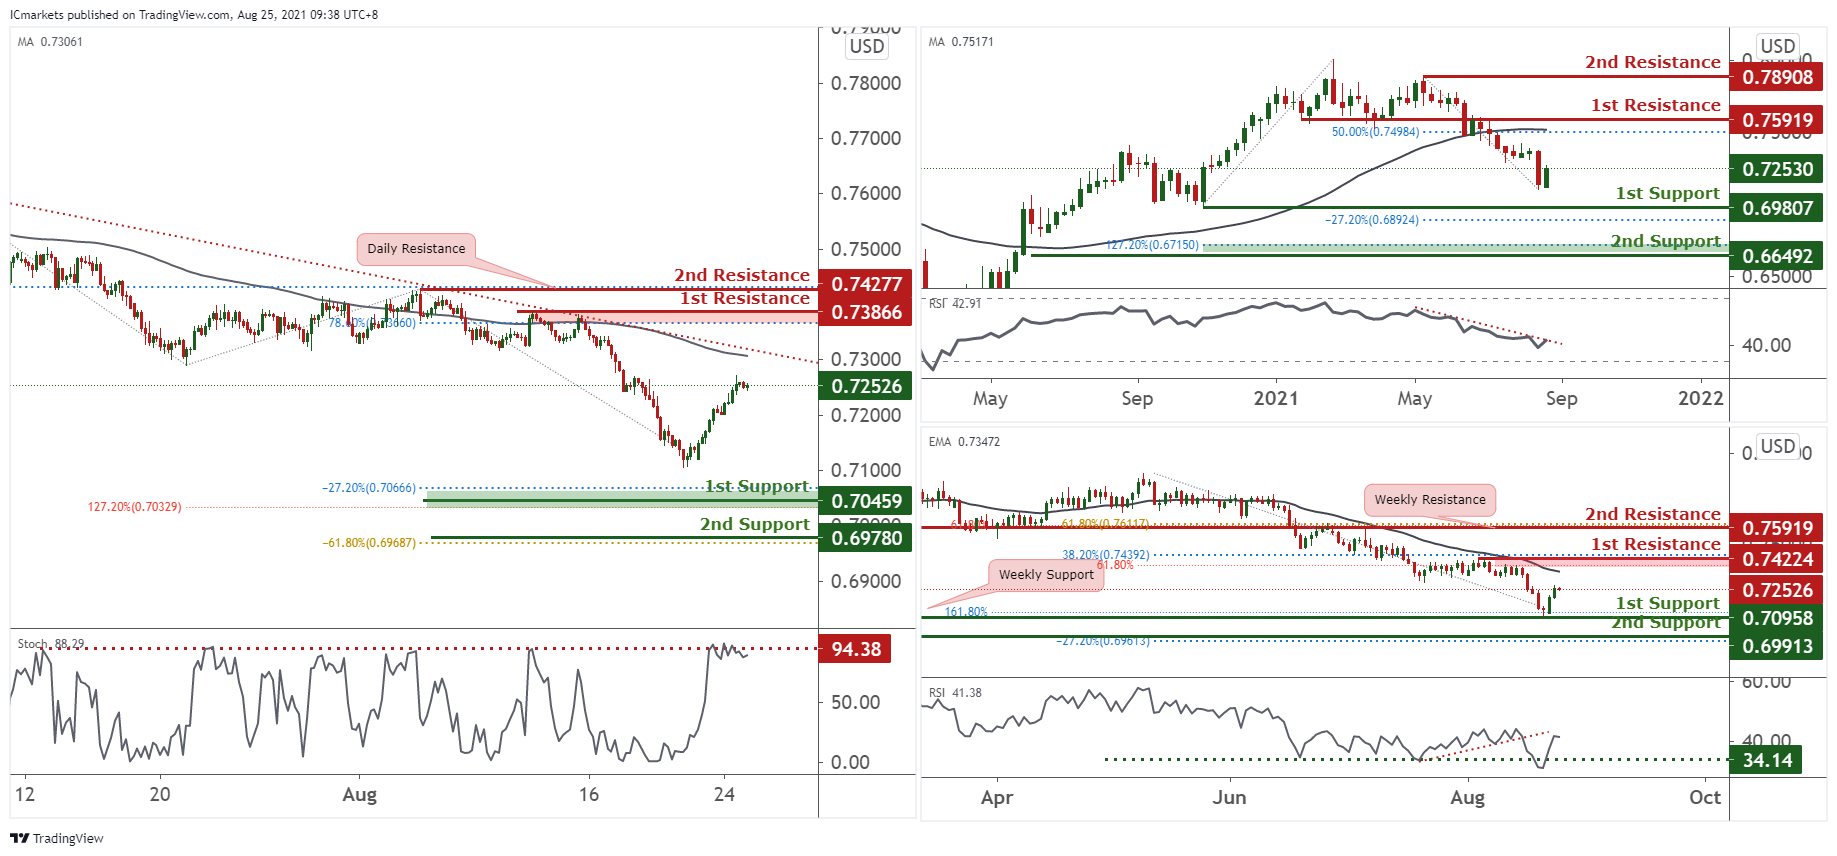
AUD/USD:
On the weekly, price is holding under the MA 50 showing bearish momentum, price is expected to put towards the first support in line with the -27.2% Fibonacci retracement level. Our bearish bias is further supported by the RSI indicator, it is showing a potential downward trend hence signifying a bearish momentum. On the Daily, the price is holding below EMA 34 showing a potential bearish momentum, however price might bounce off from the first support to the first resistance 0.74224 in line with the 61.8% Fibonacci extension and 38.2% Fibonacci retracement. Our potential short term bullish bias is further supported with the RSI indicator that broke the strong support level and bouncing back up.
On the H4, price is seen to be moving towards the descending trendline resistance,however, price is still expected to hold the downward trend as a lower low has been formed and price is still holding below the 100 period MA. Our bias for the H4 chart would be bearish as the K% line on the stochastic chart is seen to be hovering at the resistance level, which might potentially push downwards.
Areas of consideration:
- H4 1st resistance level 0.73866
- H4 1st support level 0.73866
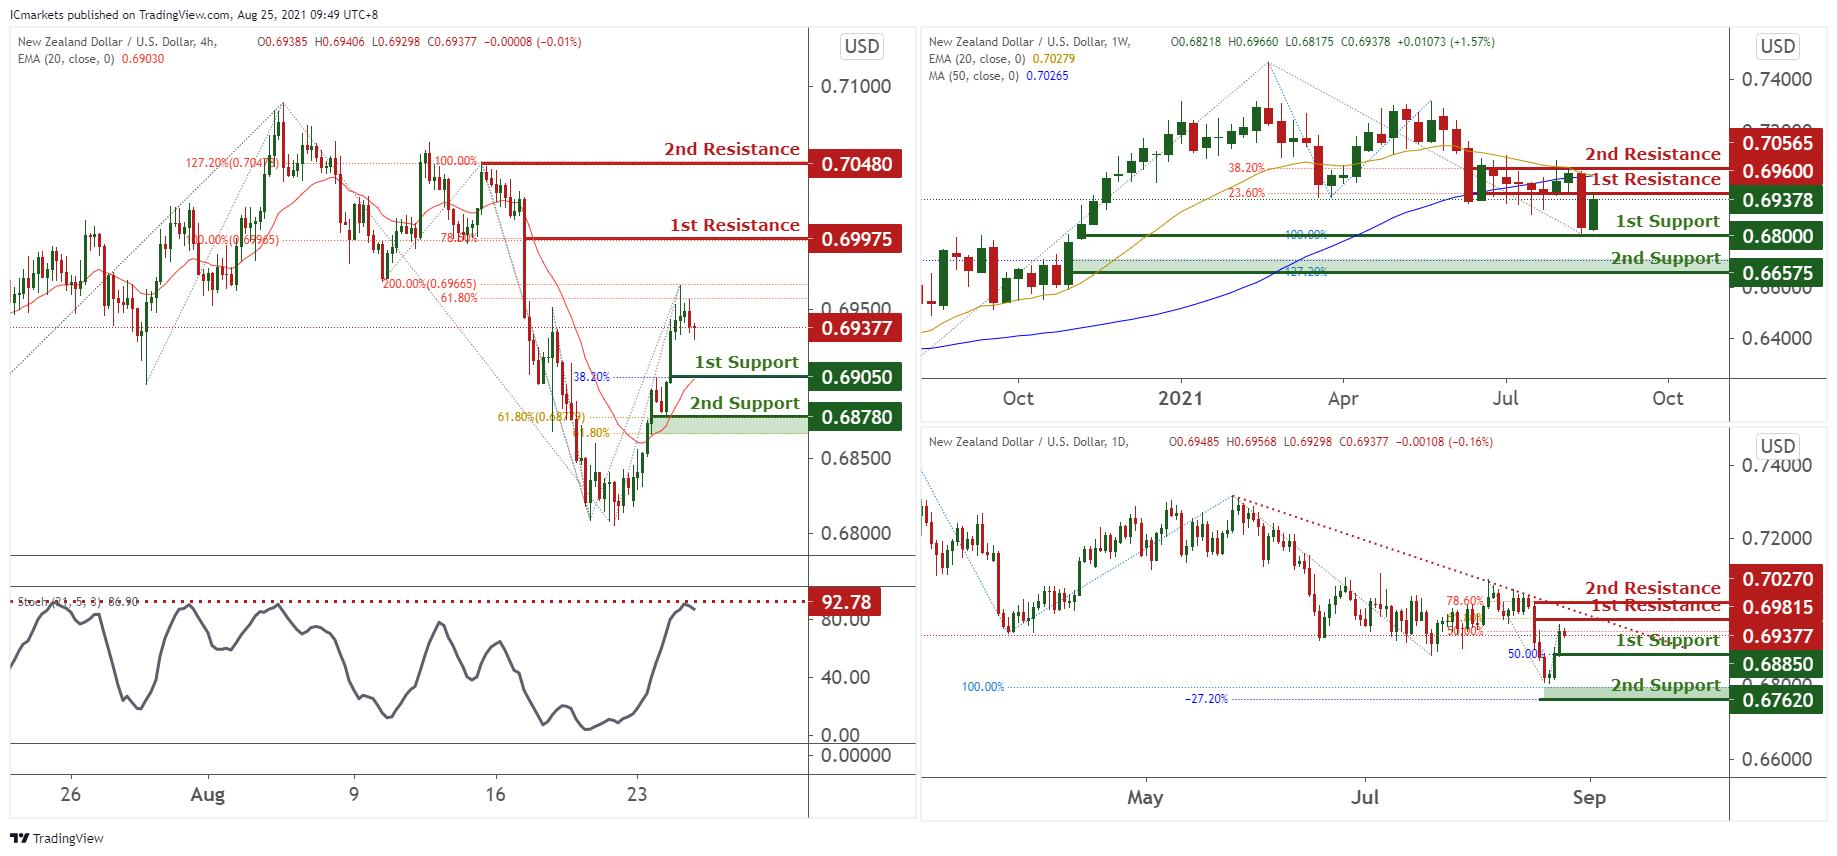
NZD/USD:
Looking at the weekly chart we could see that price is bouncing off support at 0.68000, in-line with 100% Fibonacci extension. On the Daily chart, price swung towards resistance at 0.69475, in-line with 50% Fibonacci extension and horizontal overlap resistance. We could potentially see the price facing bearish pressure for pull-back.
On the H4 timeframe, price swung towards resistance at 0.69665, in-line with 61.8% Fibonacci retracement and 200% Fibonacci extension. Price could potentially pull-back to first support at 0.69050, in-line with 38.2% Fibonacci retracement and 20EMA. Stochastic is also at resistance level where previous drops occurred. The next potential support will be at 0.68780, in-line with 61.8% Fibonacci retracement and 61.8% Fibonacci extension.
If price bounces higher, it could potentially swing towards next resistance at 0.69975, in-line with 78.6% Fibonacci retracement and 100% Fibonacci extension. The next potential resistance could be at 0.70480, in-line with 100% Fibonacci retracement and 127.2% Fibonacci extension
Areas of consideration:
- H4 time frame, support level at 0.69050 and 68780
- H4 time frame, resistance level at 69975 and 0.70480
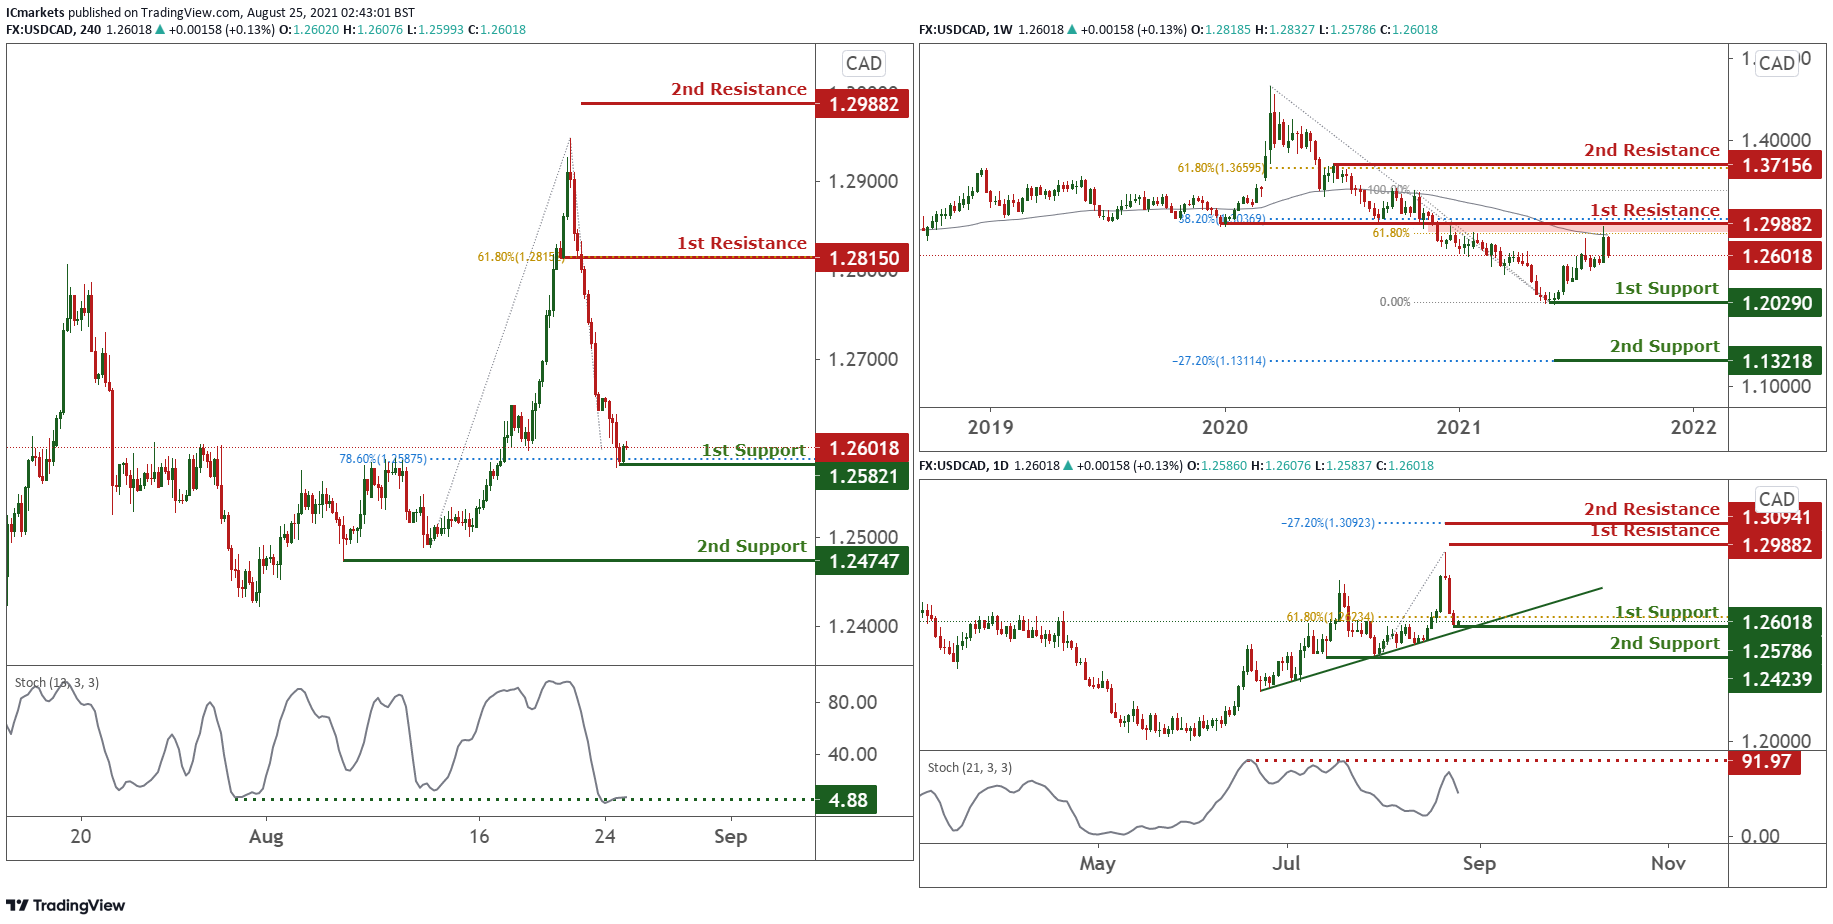
USD/CAD:
On the Weekly timeframe, price is testing long term moving average and also both 38.2% and 61.8% Fibonacci retracement level at 1.29882. As long as the price is holding below this level, we could potentially see the price facing further bearish pressure in the long term. On the Daily price pulled back sharply. With stochastics reacting below resistance where price dropped in the past, we see price facing further bearish pressure and could likely find support at the ascending trendline support, in line with 61.8% Fibonacci retracement level.
On the H4, price edged lower overnight and is still testing and holding around 78.6% Fibonacci retracement and our 1st support at 1.25821. With stochastics approaching support where price bounced in the past, we may see price face bullish pressure above our 1st support and push higher towards our 1st resistance at 1.28150. Otherwise, breaking below 1st support, price may swing lower towards 2nd support at 1.24747.
Areas of consideration:
- H4 time frame, support level at 1.25821
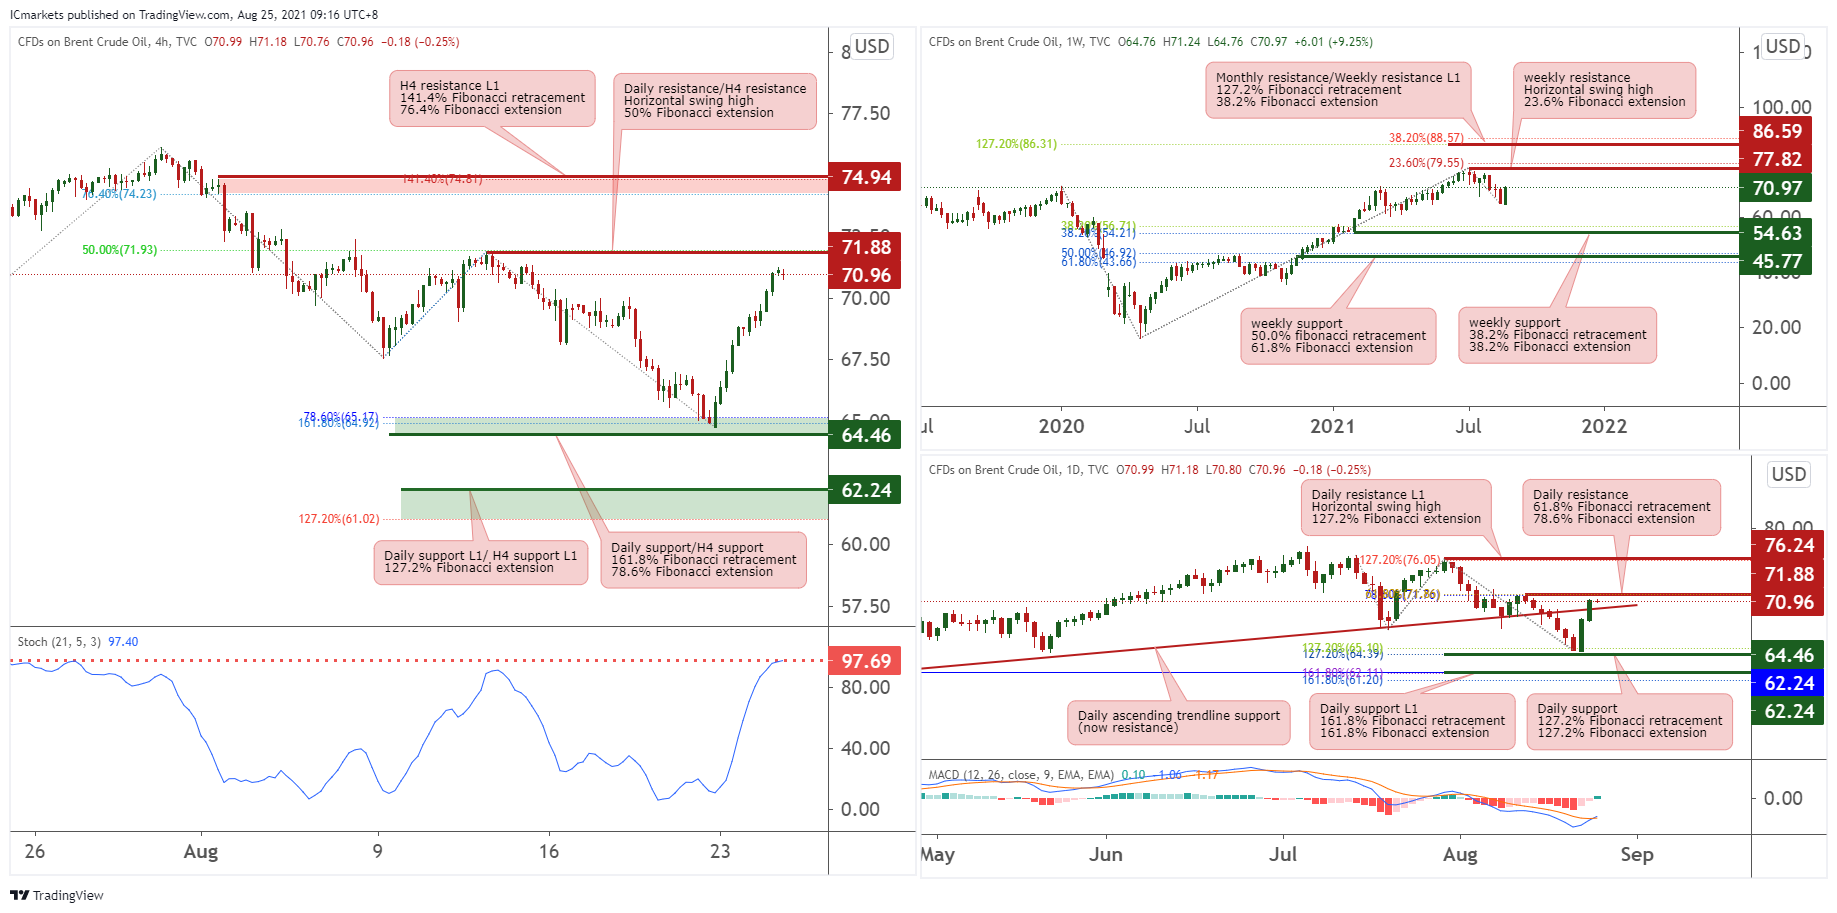
OIL:
On Weekly timeframe, we can see price has reversed from weekly resistance from horizontal swing high at 77.82 in line with 23.6% Fibonacci extension. Price may continue its bearish momentum and may find support at 54.63 in line with 38.2% Fibonacci retracement and 38.2% Fibonacci extension. However, if price breaks above 77.82 which is weekly resistance at horizontal swing high in line with 23.6% Fibonacci extension, it may swing up towards the Weekly resistance L1 at 86.59 in line with 127.2% Fibonacci retracement and 38.2 Fibonacci extension.
On the Daily timeframe, we are seeing a similar bearish pressure as price breakthroughs the ascending trendline support (now resistance) and retesting the Daily resistance at 71.88 in line with 61.8% Fibonacci retracement and 78.6% Fibonacci extension and may find Daily support at 64.46 which is in line with 127.2% Fibonacci retracement and 127.2% Fibonacci extension. Our bearish bias is further supported by how MACD is shown to be holding below the 0 line. Otherwise, price may move towards the Daily resistance L1 at 76.24 in line with Horizontal swing high and 127.2% Fibonacci extension.
Lastly, on the H4 timeframe, price may continue to bearish below the H4 resistance at 71.88 in line with Horizontal swing high and 50% Fibonacci extension and may continue to bearish towards H4 support at 64.46 in line with 161.8% Fibonacci retracement and 78.6% Fibonacci extension. Our bearish bias is further supported by how Stocastic is testing resistance where price dropped in the past. Otherwise price may move towards the H4 resistance L1 at 74.94 in line with 141.4% Fibonacci retracement and 76.4% Fibonacci extension
Areas of consideration:
- 94 resistance level on the H4 timeframe
- 46 support level on the H4 timeframe
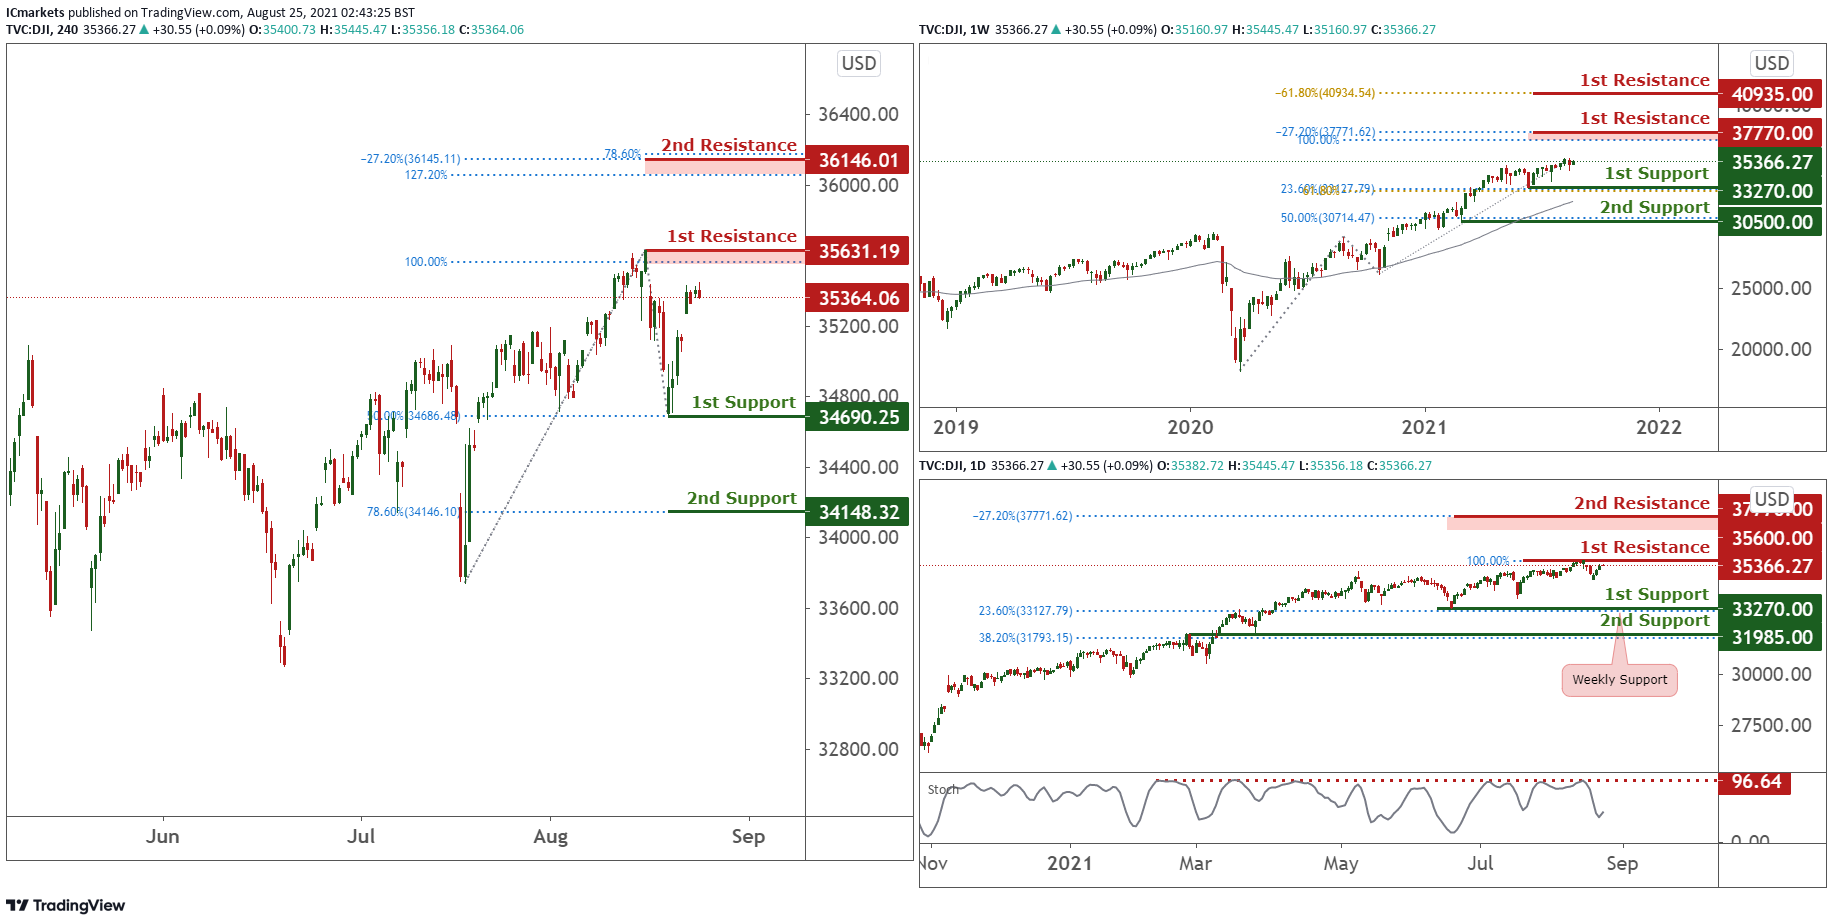
Dow Jones Industrial Average:
On the weekly chart, price is trading sideways holding between 33270 support and 38119.37 resistance. With price holding above long term moving average, we see a possibility of price facing further bullish pressure.
On the Daily chart, price is still testing and holding below resistance at 36021. With stochastic still holding below resistance where price dropped in the past, we see price facing possible bearish pressure.
On the H4, price drifted sideways overnight and is still approaching 1st resistance at 35631. We see a low probability bearish scenario where sellers may try to add to their shorts to push price lower towards our 1st support at 34690. Otherwise a break above our 1st resistance will see price swing higher towards next resistance at 36146
Areas of consideration:
- 35631 resistance level on the H4 timeframe
The accuracy, completeness and timeliness of the information contained on this site cannot be guaranteed. IC Markets does not warranty, guarantee or make any representations, or assume any liability regarding financial results based on the use of the information in the site.
News, views, opinions, recommendations and other information obtained from sources outside of www.icmarkets.com.au, used in this site are believed to be reliable, but we cannot guarantee their accuracy or completeness. All such information is subject to change at any time without notice. IC Markets assumes no responsibility for the content of any linked site.
The fact that such links may exist does not indicate approval or endorsement of any material contained on any linked site. IC Markets is not liable for any harm caused by the transmission, through accessing the services or information on this site, of a computer virus, or other computer code or programming device that might be used to access, delete, damage, disable, disrupt or otherwise impede in any manner, the operation of the site or of any user’s software, hardware, data or property.


