
EUR/USD:
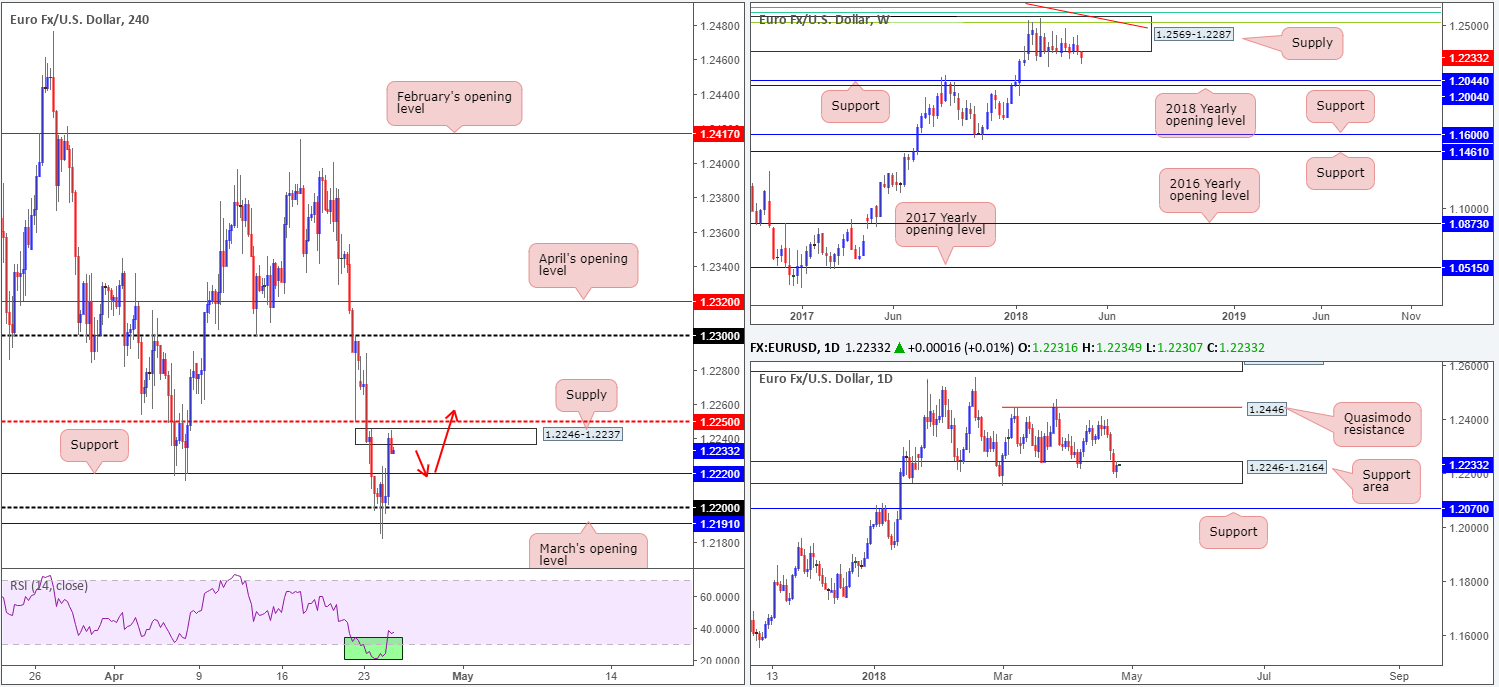
Following a three-day slide, the single currency staged a modest recovery on Tuesday after whipsawing through both the 1.22 handle and March’s opening level at 1.2191 seen on the H4 timeframe. Yesterday’s upside move was bolstered by a USD correction, which failed to hold above the 91.00 mark (DXY) despite the 10 year Treasury yield breaching the 3% barrier. As you can see, the day ended with the euro shaking hands with a minor H4 supply positioned just south of 1.2250 at 1.2246-1.2237.
The story on the daily timeframe reveals buying seen from within the boundaries of a daily support area plotted at 1.2246-1.2164. Formed from a daily supply back in 2014, this zone has governed downside action since the beginning of the year. In terms of weekly structure, though, downside remains favored. Weekly supply noted at 1.2569-1.2287 has held the EUR/USD captive since late January. Although the buyers still have a strong hand in this fight (see overall trend), we feel the pair may want to shake hands with nearby support targets (weekly support band at 1.2044, shadowed closely by the 2018 yearly opening level at 1.2004) before making its next play.
Potential trading zones:
Although buyers made an entrance during trade on Tuesday, is it enough to warrant additional upside?
Buying into the current H4 supply/H4 mid-level resistance at 1.2250 is not something the team would label high probability. We would need to see support establish off of 1.2220 (as per the red arrows), followed by a decisive H4 close above 1.2250 before convinced of buyer intent. Assuming this comes to fruition, a retest of 1.2250 as support would mark a firm platform for a long trade, targeting 1.23s. Constant monitoring of the trade is recommended, though, since let’s remember where we are trading from on the weekly timeframe!
Data points to consider today: No high-impacting events scheduled.
GBP/USD:
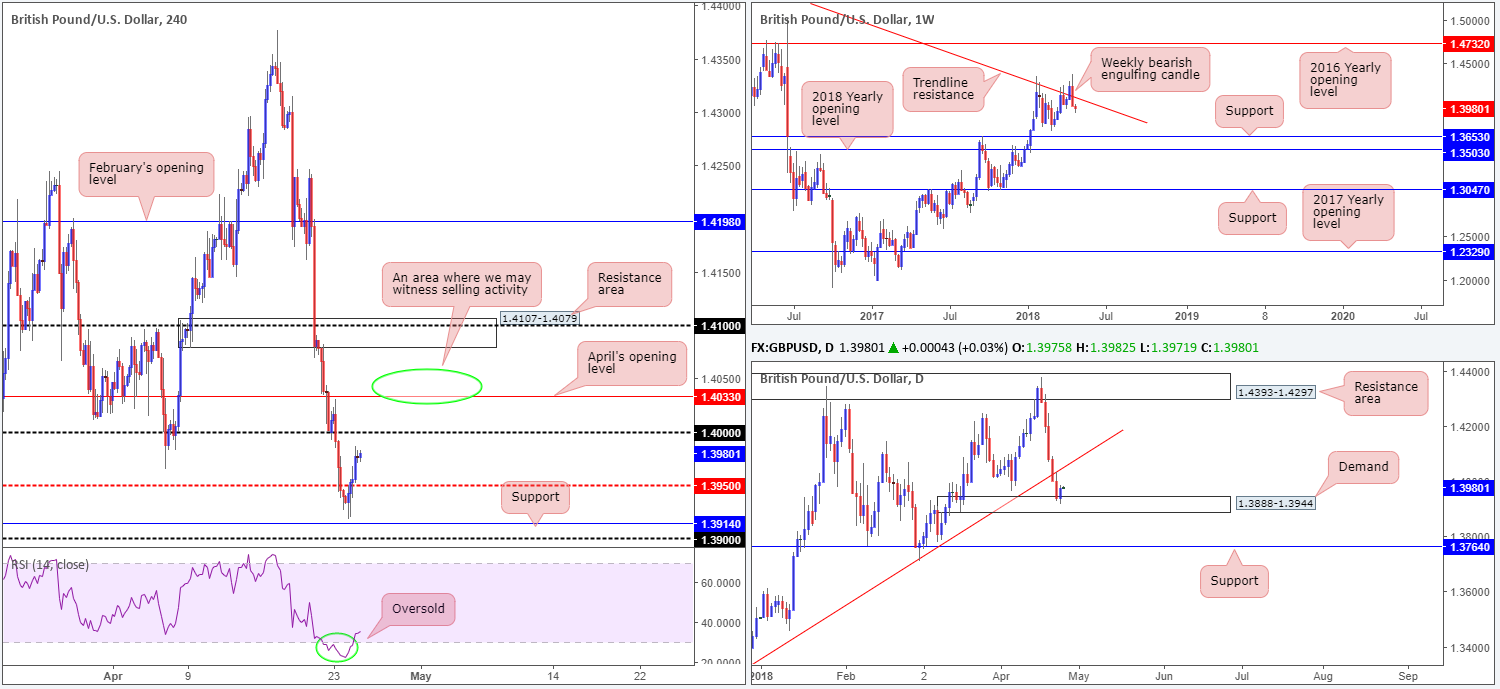
Breaking a firm four-day bearish phase, the British pound chalked up a modest recovery on Tuesday. Enthusiasm over the USD faded somewhat during yesterday’s movement, with the DXY unable to hold ground above 91.00 despite a firm push above the 3% mark seen in the US Treasury yield market.
Leaving the H4 support at 1.3914 unchallenged, the H4 candles bottomed and reclaimed H4 mid-level resistance plotted at 1.3950, and is now seen eyeing the key figure 1.40. Not only was this move bolstered by a weakening USD, we also noted the H4 RSI indicator trading deep within oversold territory along with daily price bumping heads with demand printed at 1.3888-1.3944. Likely still weighing on downside, though, is the fact that last week’s movement formed a striking weekly bearish engulfing candle that nose-dived back beneath a long-term weekly trend line resistance taken from the high 1.5930.
Potential trading zones:
According to daily structure, further upside may be seen until we connect with the daily trend line support-turned resistance taken from the low 1.3061. As a consequence, this could lead to a brief spell above 1.40 and potentially bring in orders from April’s opening level seen on the H4 timeframe at 1.4033. Given how close by 1.40 is right now, buying this market may not be the best path to take, in our humble view. Instead, we would be more inclined to focus the spotlight on shorts from the 1.4033/1.4050ish range (green circle), judging by higher-timeframe structure.
Data points to consider today: No high-impacting events scheduled.
AUD/USD:
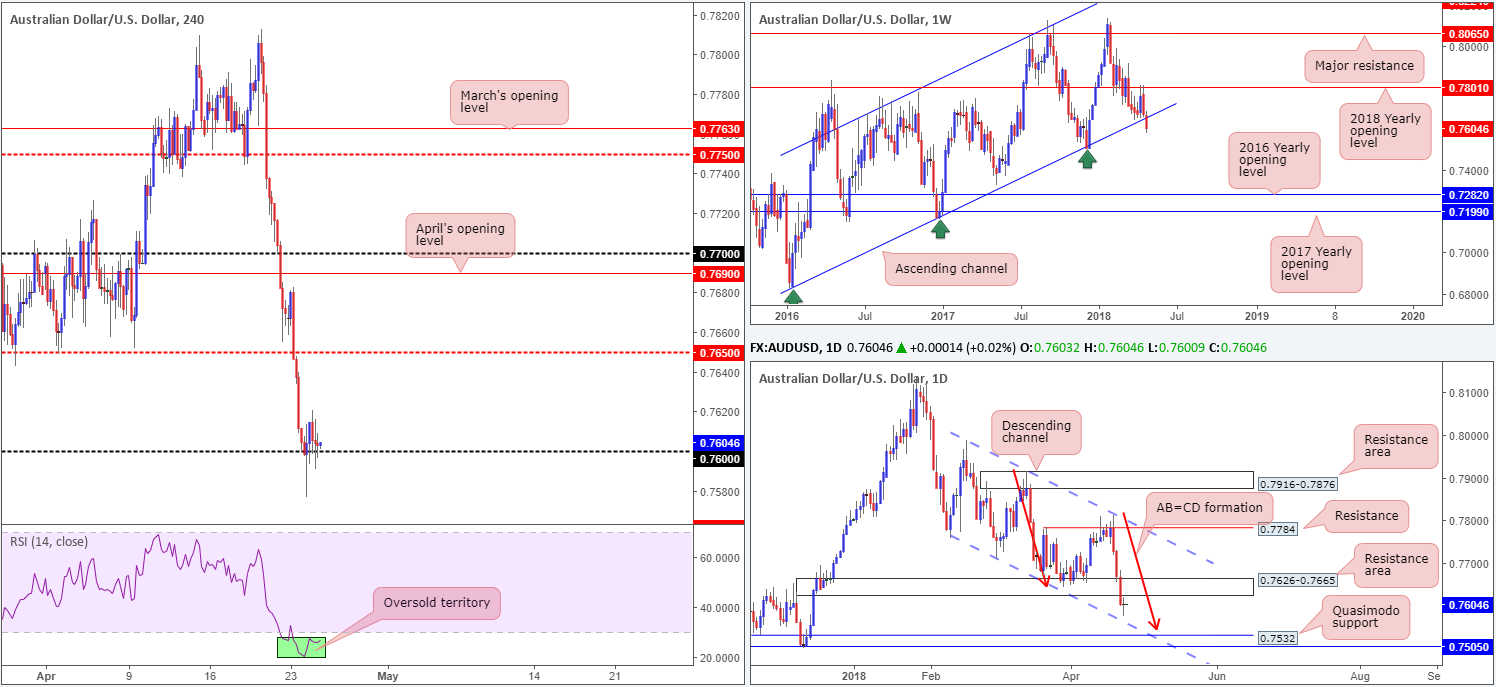
Despite a brief flicker of activity seen in the early hours of Asia on the back of Aussie inflation numbers, it was a quiet day in the AUD/USD market on Tuesday. Coated with indecision off of the 0.76 handle seen on the H4 timeframe, the pair’s daily range failed to exceed 45 pips. In view of this, much of the following report will echo thoughts put forward in Tuesday’s analysis.
Weekly flow remains trading beneath a long-term weekly channel support extended from the low 0.6827, after a solid push to the downside on Monday. The daily demand zone printed at 0.7626-0.7665 was taken out in strong fashion on Monday (now acting resistance area), technically opening the path south to a daily channel support drawn in from the low 0.7758, followed then by a daily Quasimodo support at 0.7532. Also worth noting is the potential AB=CD correction that terminates just ahead of the daily Quasimodo level (see red arrows).
Potential trading zones:
According to higher-timeframe structure, there is potential to drive beyond 0.76 this week.
Trading from 0.76 may offer an intraday bounce today. Though, we’d be surprised to see much of a move materialize. The main focus, therefore, is on December’s opening level at 0.7562 (not seen on the screen) for potential long plays, as this level aligns rather nicely with the noted daily channel support. However, what this also means is that traders could pursue intraday shorts beneath 0.76 (preferable to wait for a retest of 0.76 before pulling the trigger) as well, targeting 0.7562 as the initial take-profit zone.
Data points to consider today: Australian markets closed in observance of Anzac Day. No high-impacting events scheduled.
USD/JPY:
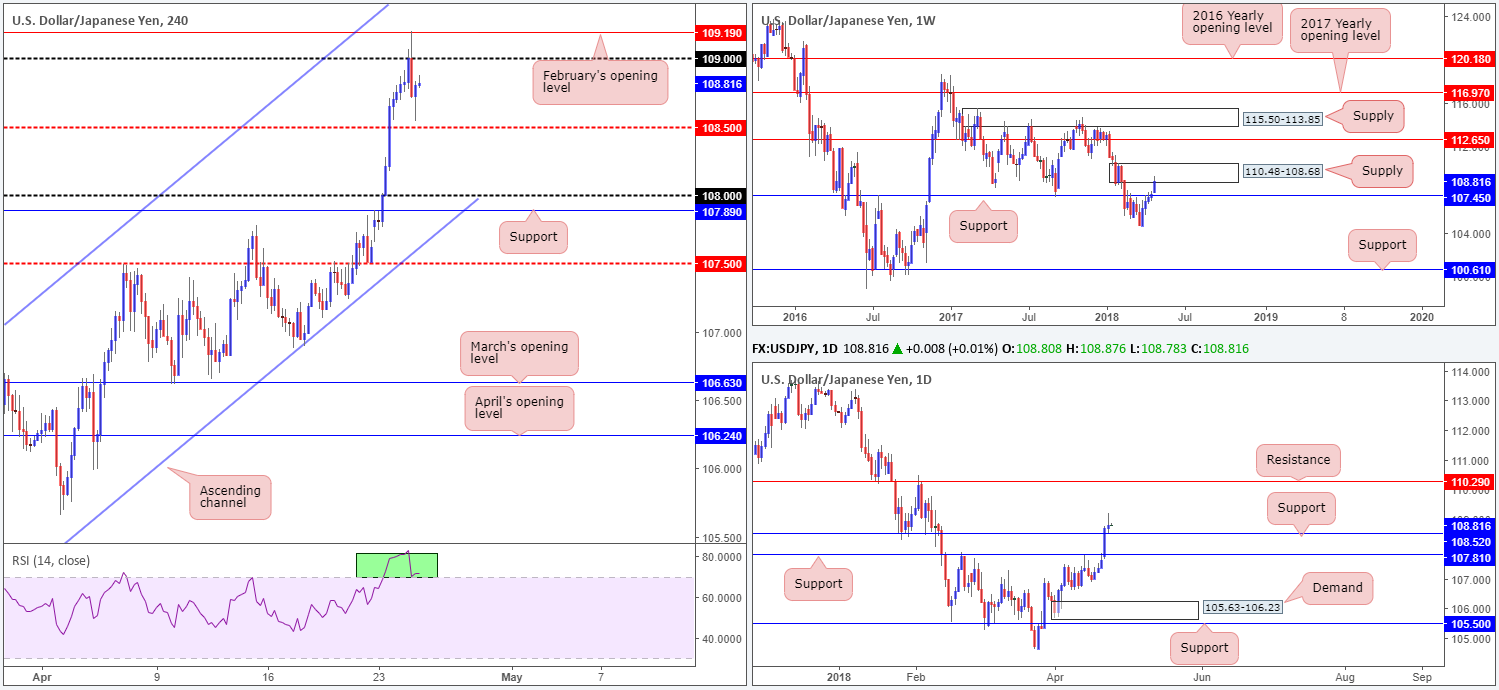
Led by US equities and Treasury yields, the USD/JPY was unable to sustain gains beyond 109 on Tuesday, turning aggressively lower after challenging February’s opening level seen on the H4 timeframe at 109.19. It’s not all doom and gloom, though, as the H4 candles managed to establish a bottom just ahead of the H4 mid-level support at 108.50, likely helped by nearby daily support propped up at 108.52.
Although the market remains entrenched within a phase of corrective buying at the moment, there is a chance that we could observe a fall in the USD over the coming weeks. On the weekly scale, price is seen shaking hands with weekly supply priced in at 110.48-108.68, after conquering weekly resistance at 107.45.
Potential trading zones:
Trading this market medium-term may be a challenge, given we have daily price holding above support and weekly action trading from supply.
A H4 close beneath 108.50 would likely confirm downside to 108/H4 support at 107.89, followed then by daily support at 107.81. What this would also do is confirm seller intent within weekly supply, albeit on an intraday basis for now.
So, following a H4 close beneath 108.50 that retests the underside of this level as resistance (preferably in the shape of a full or near-full-bodied bearish H4 candle), a short could be something to consider.
In regard to longs, we would exercise caution knowing that weekly supply is in play, despite daily price showing room to punch as high as a daily resistance level at 110.29 (seen within the upper limits of the weekly supply).
Data points to consider today: No high-impacting events scheduled.
USD/CAD:
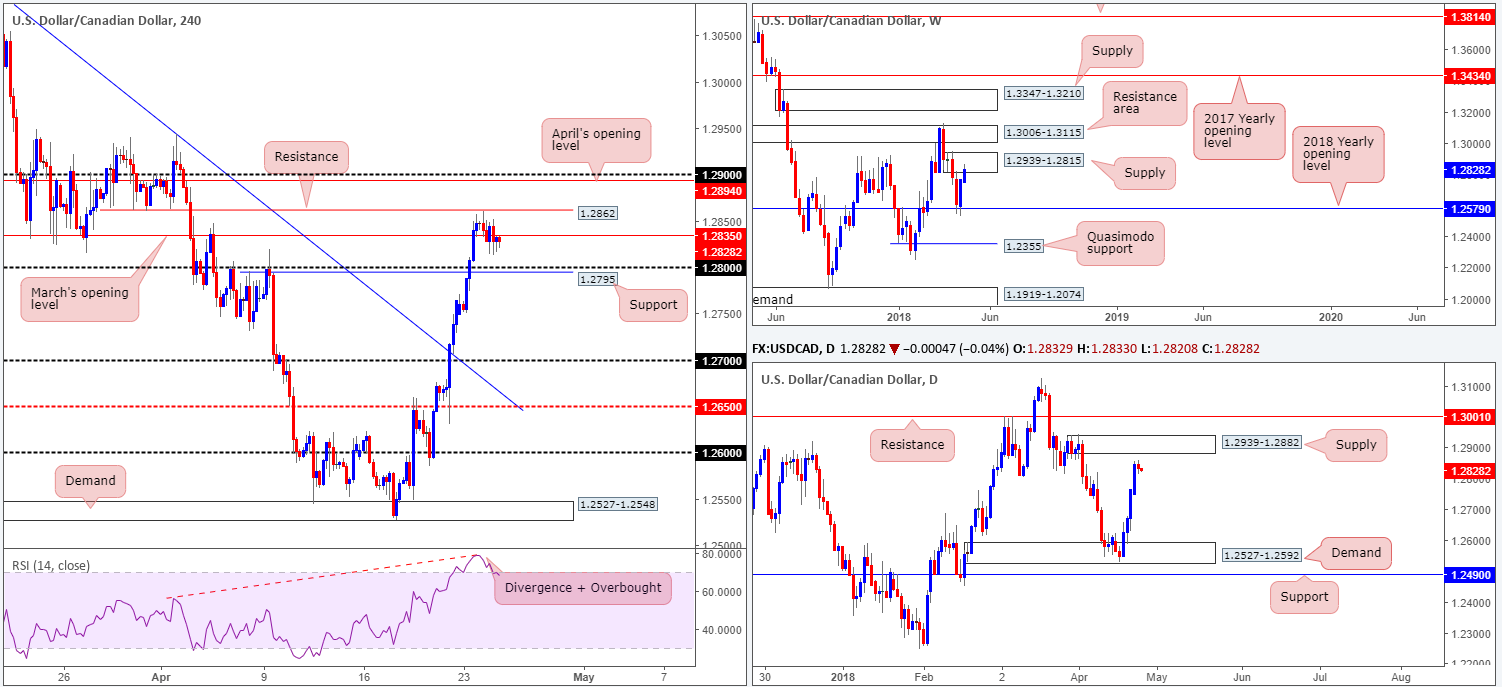
During the course of a somewhat quiet trading session on Tuesday, the USD/CAD turned lower after coming within two pips of testing H4 resistance at 1.2862, amidst ongoing hopes of a NAFTA agreement in the not too distant future. As is shown on the H4 timeframe, this pressured price action to take out March’s opening level at 1.2835, consequently exposing 1.28 and H4 support at 1.2795. Also worth noting is the H4 RSI indicator displays a strong overbought/divergence reading.
The story on the higher timeframes show weekly price trading within the walls of a weekly supply at 1.2939-1.2815, while daily action shows some room to move higher until we reach daily supply at 1.2939-1.2882 (positioned within the upper limits of the said weekly supply).
Potential trading zones:
In a similar fashion to Tuesday’s outlook, price movement is likely to remain somewhat restricted today. Upside continues to face resistance from 1.2862 (H4 resistance) and now March’s opening level mentioned above at 1.2835. Downside, as mentioned above, now has nearby support targets at 1.28/H4 support at 1.2795. As you can see, this does not leave a lot of wiggle room.
In saying this, though, April’s opening level seen above at 1.2894 is particularly interesting for shorts, as it is located within the lower limits of the noted daily supply zone, which itself is (as highlighted above) located within the upper boundary of weekly supply! Safe stop-loss placement would therefore be beyond the higher-timeframe supplies.
Data points to consider today: Crude oil inventories and BoC Governor Poloz speaks.
USD/CHF:
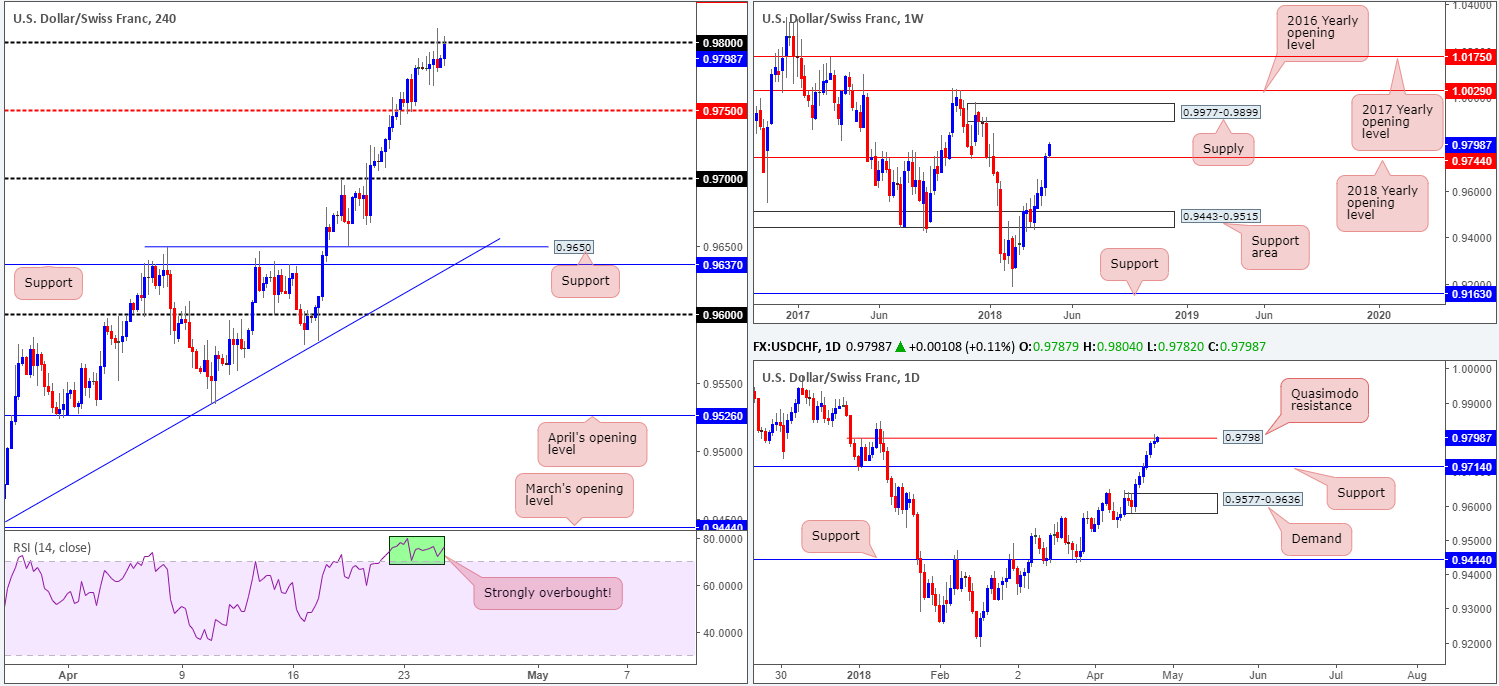
In recent hours, we’ve seen the USD/CHF push higher and attempt to take on the 0.98 handle on the H4 timeframe, despite yesterday’s H4 bearish pin-bar formation off of this number. A firm break of this level could lead to a test of H4 resistance priced in at 0.9835 (not seen on the screen).
Let’s remember, though, that before H4 price can truly consume orders around 0.98, daily price will need to overcome a daily Quasimodo resistance printed at 0.9798. Supporting further upside in this market is the weekly timeframe. Weekly action, as you can see, recently closed above the 2018 yearly opening level at 0.9744, which in turn has potentially cleared the path north up to weekly supply posted at 0.9977-0.9899.
Potential trading zones:
Having seen yesterday’s H4 bearish pin-bar formation fail to bring in sellers, selling from 0.98 is a risky play, in our book, despite daily price still testing a daily Quasimodo resistance. In light of this information, the team has noted to keep firm eyes on 0.98. A decisive H4 close above this number followed up with a retest in the shape of a full or near-full-bodied H4 bull candle would be enough to validate a long position, targeting the aforementioned H4 resistance as your initial take-profit target.
Data points to consider today: No high-impacting events scheduled.
DOW 30:
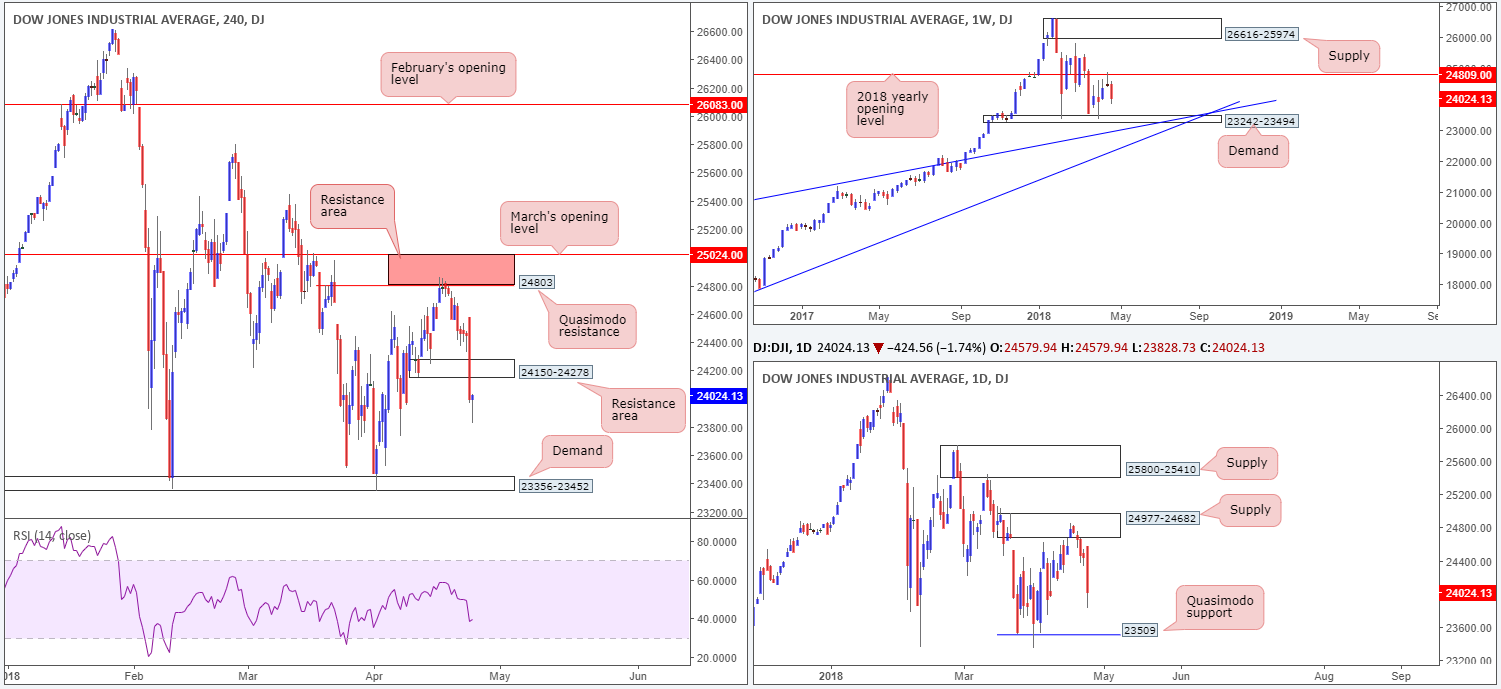
Higher US Treasury yields and potential interest rate hikes weighed on US equities on Tuesday. Although the Dow Jones Industrial Average opened higher, the index plunged lower and sliced through H4 demand positioned at 24150-24278, ending the day crafting a H4 bullish pin-bar formation off a low of 23828.
Technically speaking, the desk remains bearish this market. This is largely due to higher-timeframe structure. Weekly activity recently extended to the downside following a weekly bearish pin-bar formation off of the 2018 yearly opening level baked in at 24809. Alongside this, daily price is seen driving lower from daily supply noted at 24977-24682 and shows room to continue south until we connect with a daily Quasimodo support at 23509.
Potential trading zones:
The team has noted to keep an eyeball on the H4 demand at 23356-23452 as the next downside target which happens to be positioned just beneath the daily Quasimodo support mentioned above at 23509.
The break of 24150-24278 on the H4 timeframe may provide a favorable opportunity to sell this market and target the lower H4 demand. An ideal sell signal would be for a retest to the underside of the current H4 demand as resistance in the shape of a full or near-full-bodied H4 bearish candle.
Data points to consider today: No high-impacting events scheduled.
GOLD:
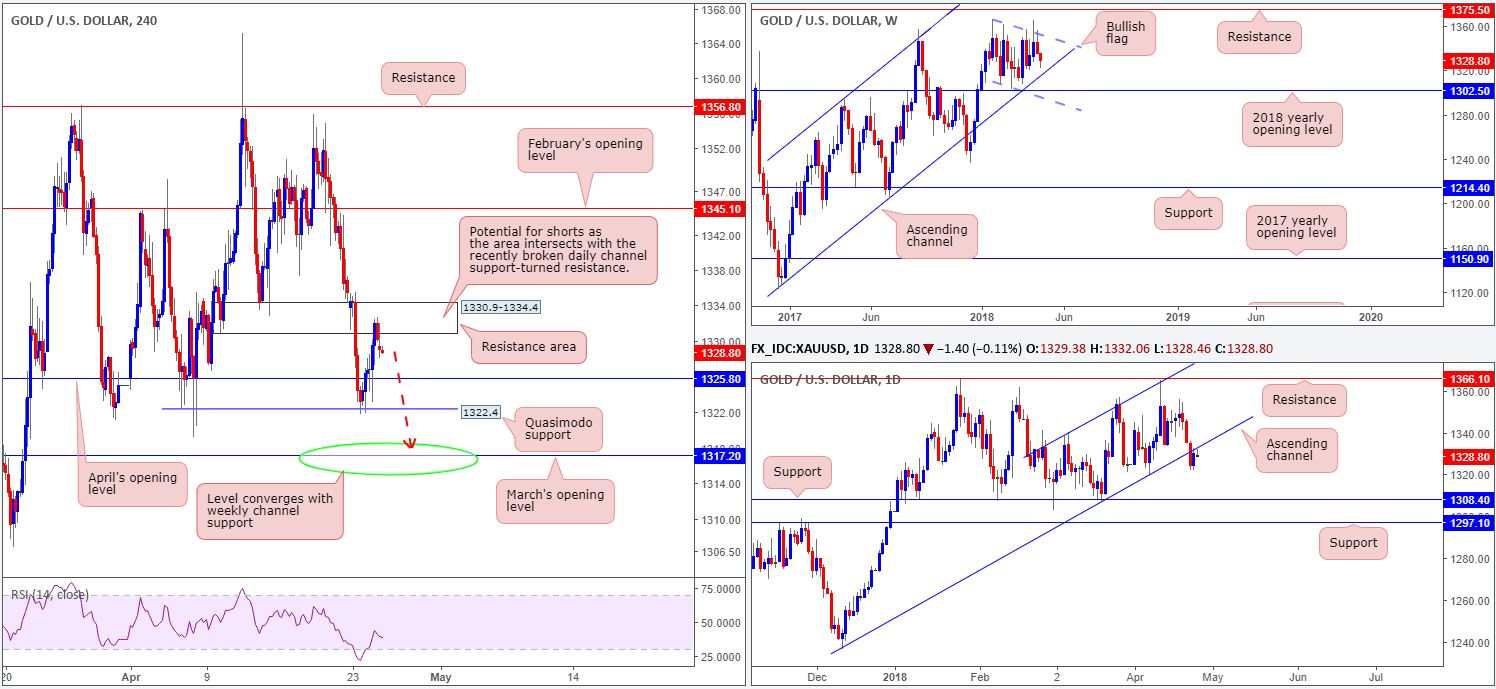
Buyers elbowed their way into the spotlight on Tuesday, following a three-day bearish phase. H4 price established support off of a Quasimodo level seen at 1322.4 – breached April’s opening level at 1325.8 – and shook hands with a H4 resistance area marked at 1330.9-1334.4. As noted on the chart, this H4 zone has the potential to hold price action lower, which is what we’re seeing as we write. This is largely due to the area intersecting with the recently broken daily channel support-turned resistance taken from the low 1236.6. There is a strong chance that we may see bullion extend these losses today, targeting March’s opening level seen on the H4 timeframe at 1317.2, which happens to converge with a long-term weekly channel support taken from the low 1122.8 (the next downside target on the weekly scale).
Potential trading zones:
We believe further selling is on the cards after H4 price bumped heads with the noted H4 resistance area. Therefore, shorting this market could be an option should it agree with your trading plan. As highlighted above, the downside target from this area can be seen at March’s opening level on the H4 timeframe at 1317.2. Given its connection to weekly structure, this is not only a take-profit zone, but also a valid area to be considering longs from as well.
This site has been designed for informational and educational purposes only and does not constitute an offer to sell nor a solicitation of an offer to buy any products which may be referenced upon the site. The services and information provided through this site are for personal, non-commercial, educational use and display. IC Markets does not provide personal trading advice through this site and does not represent that the products or services discussed are suitable for any trader. Traders are advised not to rely on any information contained in the site in the process of making a fully informed decision.
This site may include market analysis. All ideas, opinions, and/or forecasts, expressed or implied herein, information, charts or examples contained in the lessons, are for informational and educational purposes only and should not be construed as a recommendation to invest, trade, and/or speculate in the markets. Any trades, and/or speculations made in light of the ideas, opinions, and/or forecasts, expressed or implied herein, are committed at your own risk, financial or otherwise.
The use of the site is agreement that the site is for informational and educational purposes only and does not constitute advice in any form in the furtherance of any trade or trading decisions.
The accuracy, completeness and timeliness of the information contained on this site cannot be guaranteed. IC Markets does not warranty, guarantee or make any representations, or assume any liability with regard to financial results based on the use of the information in the site.
News, views, opinions, recommendations and other information obtained from sources outside of www.icmarkets.com.au, used in this site are believed to be reliable, but we cannot guarantee their accuracy or completeness. All such information is subject to change at any time without notice. IC Markets assumes no responsibility for the content of any linked site. The fact that such links may exist does not indicate approval or endorsement of any material contained on any linked site.
IC Markets is not liable for any harm caused by the transmission, through accessing the services or information on this site, of a computer virus, or other computer code or programming device that might be used to access, delete, damage, disable, disrupt or otherwise impede in any manner, the operation of the site or of any user’s software, hardware, data or property.


