
Waiting for lower timeframe confirmation is our main tool to confirm strength within higher timeframe zones, and has really been the key to our trading success. It takes a little time to understand the subtle nuances, however, as each trade is never the same, but once you master the rhythm so to speak, you will be saved from countless unnecessary losing trades. The following is a list of what we look for:
- A break/retest of supply or demand dependent on which way you’re trading.
- A trendline break/retest.
- Buying/selling tails/wicks – essentially we look for a cluster of very obvious spikes off of lower timeframe support and resistance levels within the higher timeframe zone.
- Candlestick patterns. We tend to stick with pin bars and engulfing bars as these have proven to be the most effective.
We typically search for lower-timeframe confirmation between the M15 and H1 timeframes, since most of our higher-timeframe areas begin with the H4. Stops are usually placed 1-3 pips beyond confirming structures.
EUR/USD:
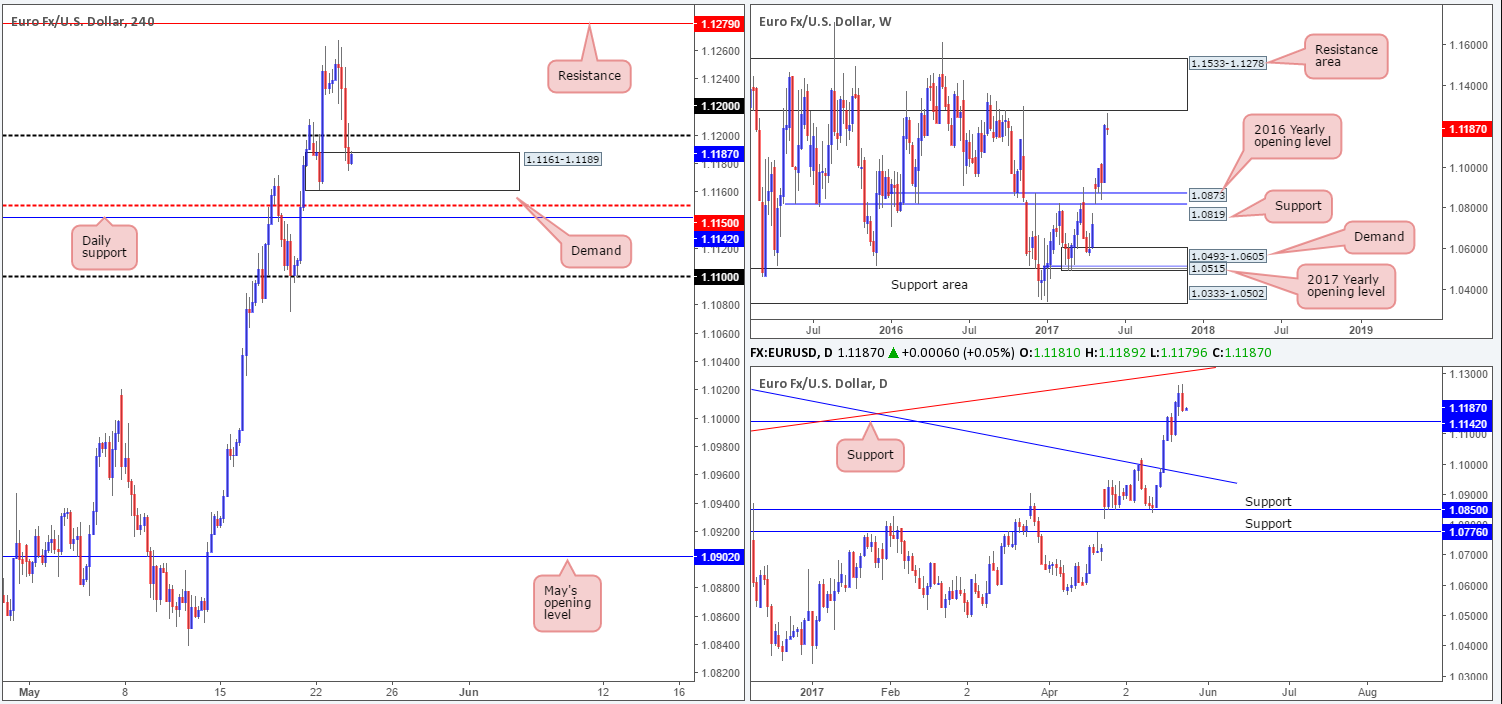
Kicking this morning’s report off with a look at the weekly timeframe reveals that price recently came within striking distance of a formidable resistance area coming in at 1.1533-1.1278. As you can see, the pair responded bearishly and has, at the time of writing, chalked up a reasonably strong selling wick.
Moving down to the daily timeframe, the single currency was unable to challenge the trendline resistance etched from the low 1.0711, before turning south yesterday. This has placed the EUR nearby a neighboring support penciled in at 1.1142, which boasts strong historical significance noted all the way back to early 2015!
Looking over to the H4 timeframe, the recent selloff saw the market surpass the 1.12 handle going into yesterday’s London close, which left price free to test demand at 1.1161-1.1189. We find this demand appealing due to the robust momentum seen from the base. However, buying from here is risky for several reasons. Firstly, the 1.12 handle could be a potentially troublesome resistance barrier to overcome. Secondly, not only do we have the H4 mid-level support at 1.1150 plotted a few pips below; we also have the said daily support lurking just below that. In addition to this, let’s remember where weekly price is trading FROM (see above)!
Our suggestions: From our perspective, we do not see a lot to hang our hat on at the moment. Entering long is not really something we would advise for reasons stated above. And playing this market short, knowing that we’re trading within H4 demand that sits above a daily support, is also just as risky we believe.
Therefore, we feel remaining on the sidelines may very well be the better path to take for the moment.
Data points to consider: ECB President Draghi speaks at 1.45pm. FOMC meeting minutes at 7pm, FOMC member Kaplan speaks at 11pm GMT+1.
Levels to watch/live orders:
- Buys: Flat (stop loss: N/A).
- Sells: Flat (stop loss: N/A).
GBP/USD:
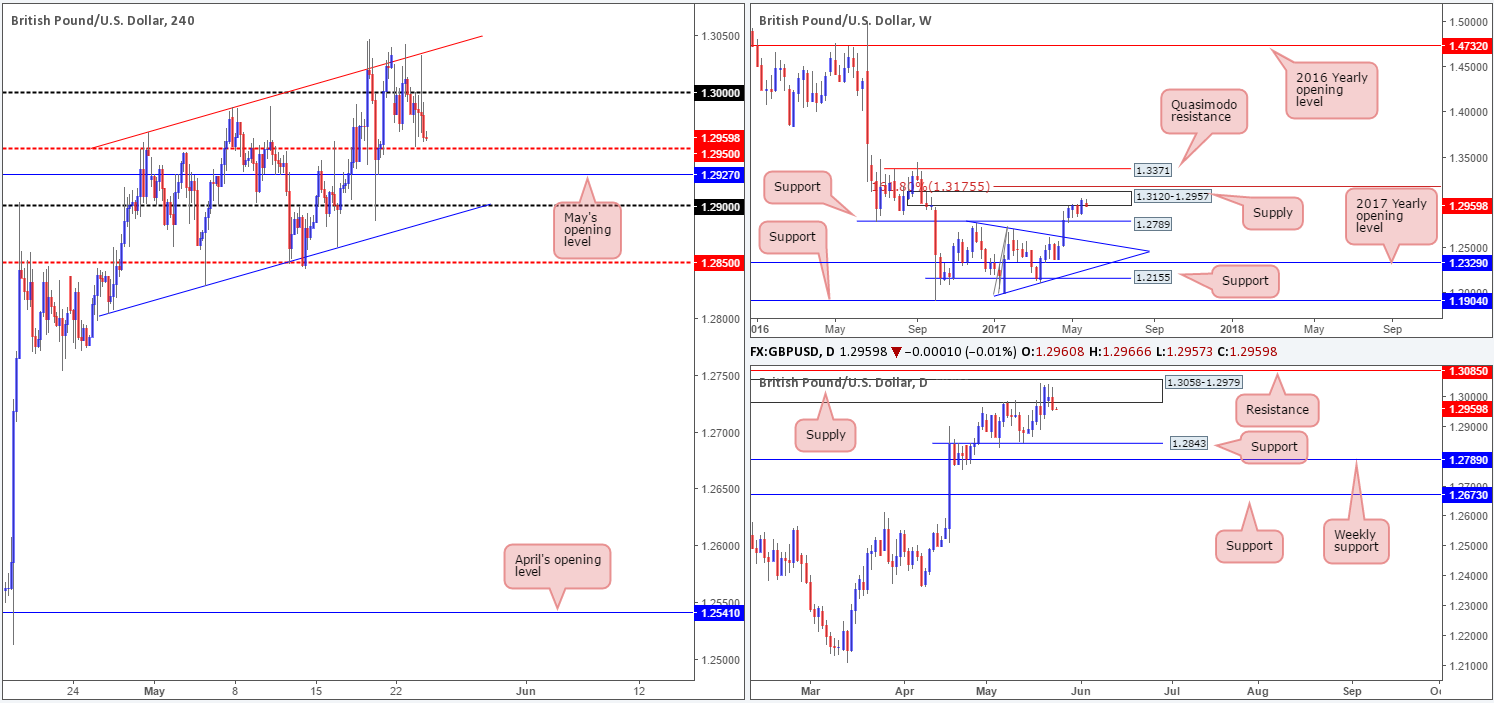
In recent trading, the GBP/USD crossed below the large psychological handle 1.30 and is now seen within shouting distance of the H4 mid-level support at 1.2950. The UK Prime Minister Theresa May recently came out and stated that the UK’s terror threat level has been raised to critical, which undoubtedly helped push the GBP lower. With that being said though, we can also see that the technical landscape indicates further selling could be on the cards. The pair remains trading within the walls of a weekly supply base drawn from 1.3120-1.2957, and daily action continues to trade around supply seen within the said weekly supply at 1.3058-1.2979.
Our suggestions: While we believe the bears will continue to drive lower, selling knowing that price is lurking just ahead of 1.2950, followed closely by May’s opening level at 1.2927, is just too risky for our liking.
The nearest support target seen on the higher timeframes at the moment is the daily support coming in at 1.2843. This sits just below the H4 mid-level support at 1.2850. In the event that price reaches the H4 channel support etched from the low 1.2804, there’s a good chance that we’ll witness a rotation from here. At the same time though, one should also expect a possible fakeout down to 1.2850 given its connection with the said daily support before we see serious buyers step in here.
Data points to consider: FOMC meeting minutes at 7pm, FOMC member Kaplan speaks at 11pm GMT+1.
Levels to watch/live orders:
- Buys: Currently have our eye on longs around the H4 channel support taken from the low 1.2804.
- Sells: Flat (stop loss: N/A).
AUD/USD:
(Trade update: Stopped out for a loss at 0.7490).
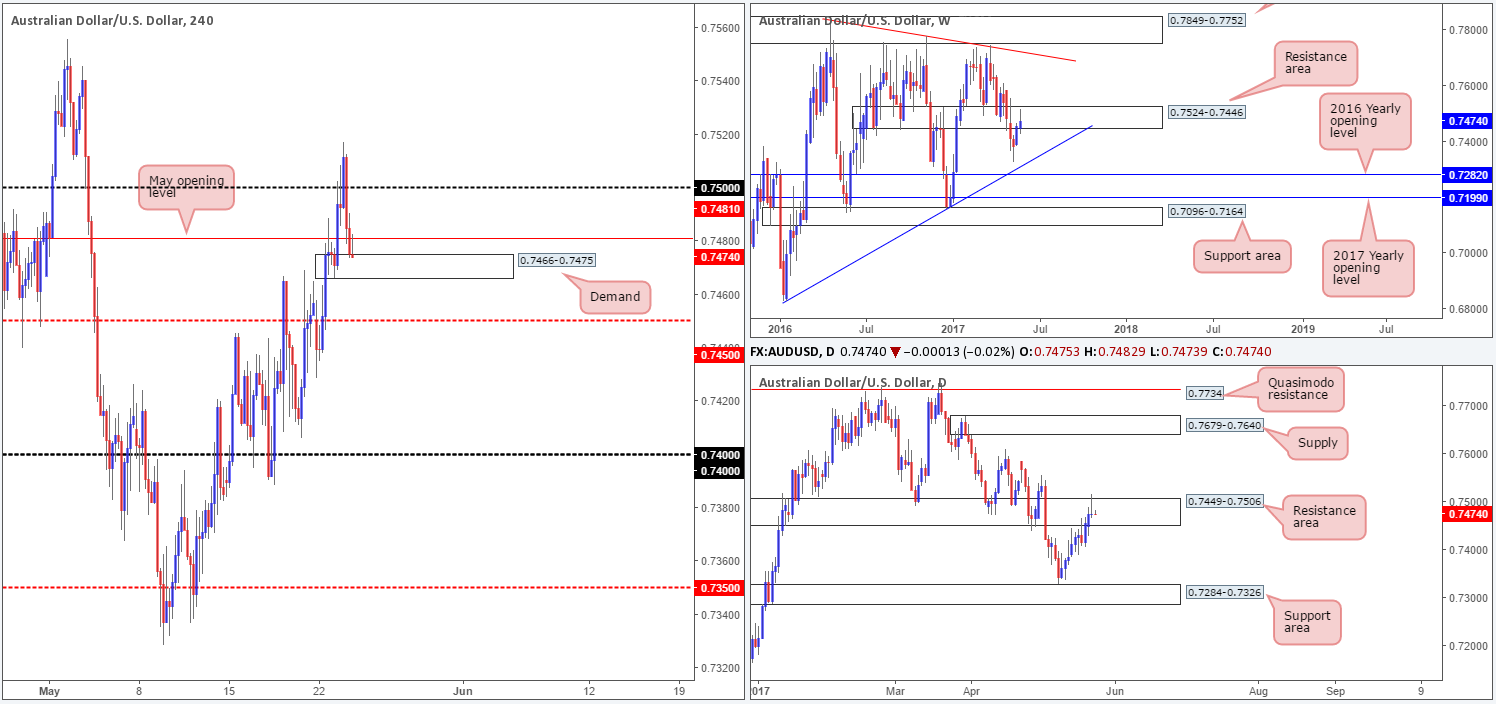
Unable to sustain gains beyond the 0.75 handle yesterday, the commodity currency turned lower and ended the day closing below May’s opening level at 0.7481. What’s also notable from a technical perspective is that H4 price is now seen trading within the confines of a small demand base drawn from 0.7466-0.7475.
Over on the bigger picture, the weekly resistance area at 0.7524-0.7446 remains in play, as does the daily resistance zone which is seen housed within the said weekly area at 0.7449-0.7506. Also of interest here is the daily selling wick printed during yesterday’s segment.
Our suggestions: Entering long from the current H4 demand is not really something our desk would be comfortable with in light of the higher-timeframe structure. So, with that in mind, we are expecting this H4 area to give way at some point during the day and see price challenge the H4 mid-level support pegged at 0.7450. It would only be upon seeing a decisive H4 close beyond 0.7450 would the team become interested in shorts.
While there are two H4 demands located below this number seen marked with green circles around 0.7440/0.7416, we believe these areas will easily be consumed and price will at least achieve the 0.74 handle, as let’s not forget that we have higher-timeframe sellers currently in the game!
As a result, a close below 0.7450 and a retest as resistance, followed by a reasonably sized H4 bearish candle (preferably a full-bodied candle), would have us looking to short, targeting 0.74.
Data points to consider: FOMC meeting minutes at 7pm, FOMC member Kaplan speaks at 11pm GMT+1.
Levels to watch/live orders:
- Buys: Flat (stop loss: N/A).
- Sells: Watch for H4 price to engulf 0.7450 and then look to trade any retest seen thereafter ([waiting for a H4 bearish candle to form following the retest is advised] stop loss: ideally beyond the candle’s wick).
USD/JPY:
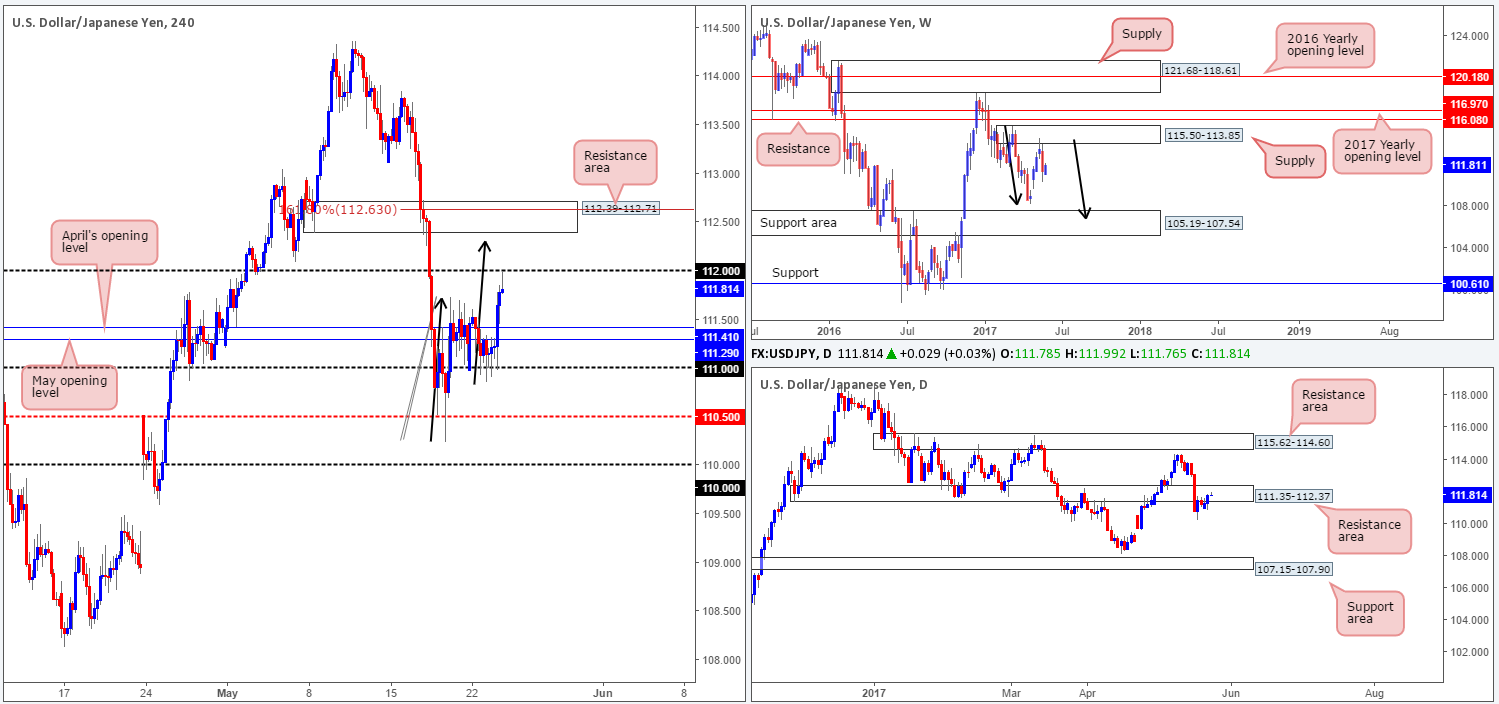
With US bond yields advancing, we saw the USD/JPY bulls go on the offensive yesterday from the 111 handle. The move took out May/April’s opening levels at 111.29/111.41 and has recently seen the pair challenge the 112 handle. Although the bulls do look incredibly strong at the moment, it might be worth noting that daily price is seen trading within a resistance area at 111.35-112.37. In addition to this, there’s a H4 AB=CD pattern that terminates between 112 and a H4 resistance area coming in at 112.39-112.71.
Our suggestions: Given that this H4 resistance area converges closely with the AB=CD pattern, we are interested in shorting from here. More specifically, we are interested in selling from the H4 AB=CD 161.8% Fib ext. at 112.63, with stops planted at 112.81 (this gives us 10 pips breathing space above the current H4 area).
Data points to consider: FOMC meeting minutes at 7pm, FOMC member Kaplan speaks at 11pm GMT+1.
Levels to watch/live orders:
- Buys: Flat (stop loss: N/A).
- Sells: 112.63 ([pending order] stop loss: 112.81).
USD/CAD:
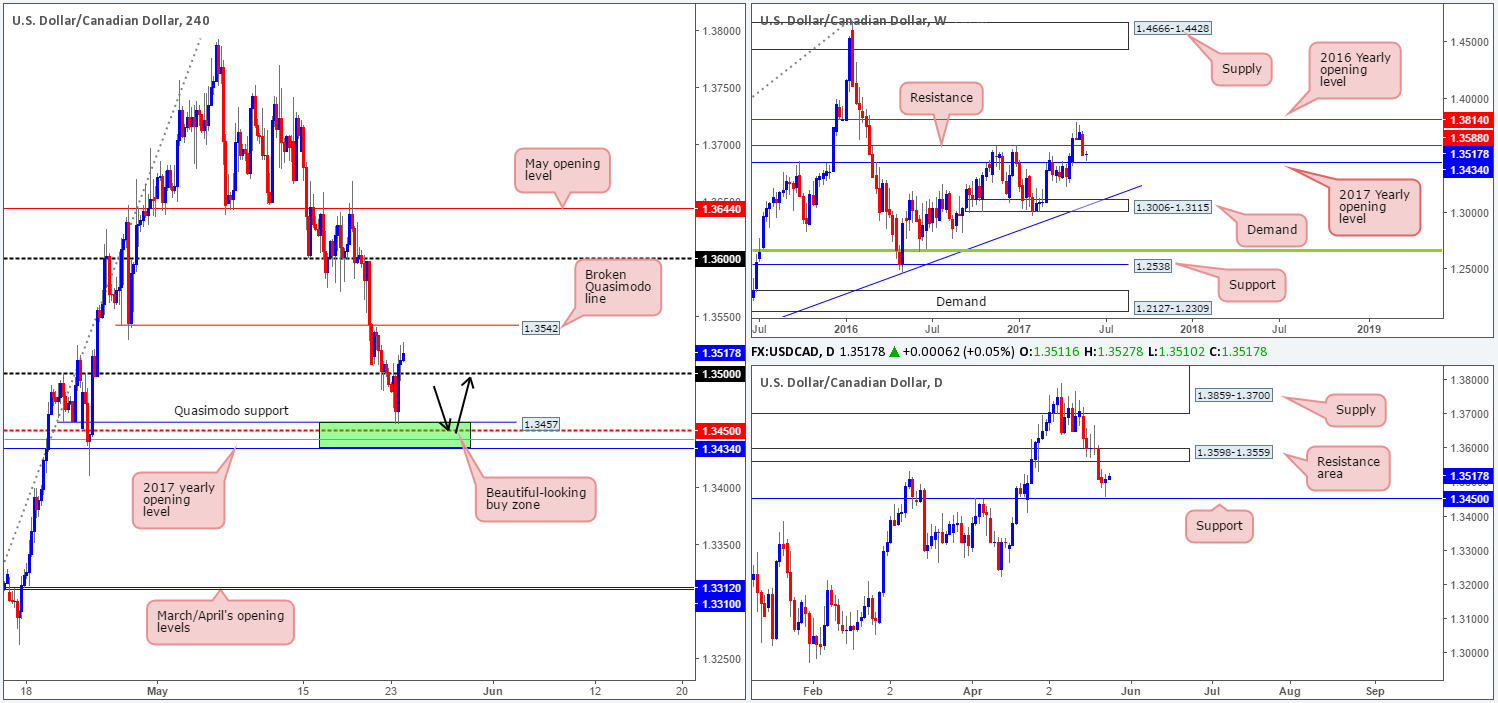
For those who read Tuesday’s report you may recall our desk highlighting that a pending buy order was placed at 1.3548 with a stop set at 1.3408. Our rationale behind setting this order was due to a very appealing H4 buy zone seen marked in green at 1.3434/1.3457. This area boasted a H4 Quasimodo support at 1.3457, a H4 61.8% Fib support at 1.3441 taken from the low 1.3223 (green line), a H4 mid-level support at 1.3450 which also happens to represent daily support and the 2017 yearly opening level seen on the weekly chart at 1.3434.
As you can see, our order was filled yesterday and price has rallied beyond the 1.35 handle. We took 50% off the table around 1.35 and reduced risk to breakeven, so we’re effectively in a free trade right now. Our next port of call is 1.3542: a H4 broken Quasimodo line. And then beyond here we have our eye on the 1.36 handle. Price, however, may struggle to reach 1.36, since before this number we have to contend with a daily resistance area at 1.3598-1.3559 and a weekly resistance level at 1.3588.
Well done to any of our readers who managed to join us on this trade.
Data points to consider: FOMC meeting minutes at 7pm, FOMC member Kaplan speaks at 11pm GMT+1. BoC Rate statement at 3pm, Crude oil inventories at 3.30pm GMT+1.
Levels to watch/live orders:
- Buys: 1.3458 ([pending order] stop loss: Breakeven).
- Sells: Flat (stop loss: N/A).
USD/CHF:
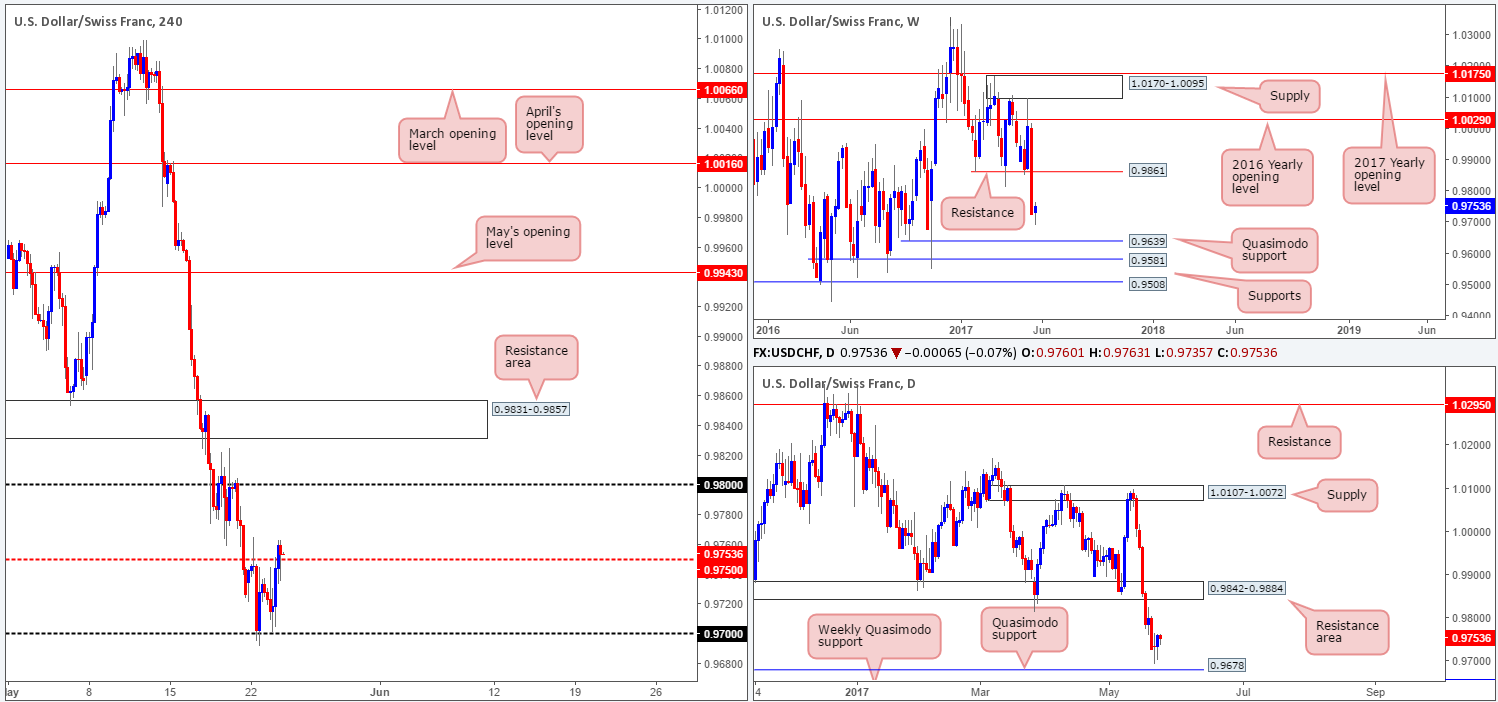
With the EUR/USD selling off during yesterday’s segment, USD/CHF bulls found another pocket of bids around the 0.97 handle. Rallying to a high of 0.9763 and closing above the H4 mid-level resistance at 0.9750, the pair now looks poised to continue north and test the 0.98 handle. The bigger picture also indicates that there’s room to advance north, with the closest resistance not coming into view until 0.9842-0.9884: a daily resistance area that houses a weekly resistance level at 0.9861.Should 0.9750 hold firm as support today, this could be a reasonably logical platform in which to look for a long setup from, targeting 0.98, followed closely by the H4 resistance area at 0.9831-0.9857.
Our suggestions: Personally, we’ll need to see not only H4 price hold firm around 0.9750, but we’d also like to see a lower-timeframe buy setup (see the top of this report) before pulling the trigger.
Data points to consider: FOMC meeting minutes at 7pm, FOMC member Kaplan speaks at 11pm GMT+1.
Levels to watch/live orders:
- Buys: 0.9750 region ([waiting for a lower-timeframe buy signal to form before pulling the trigger is advised] stop loss: dependent on where one confirms the area).
- Sells: Flat (stop loss: N/A).
DOW 30:
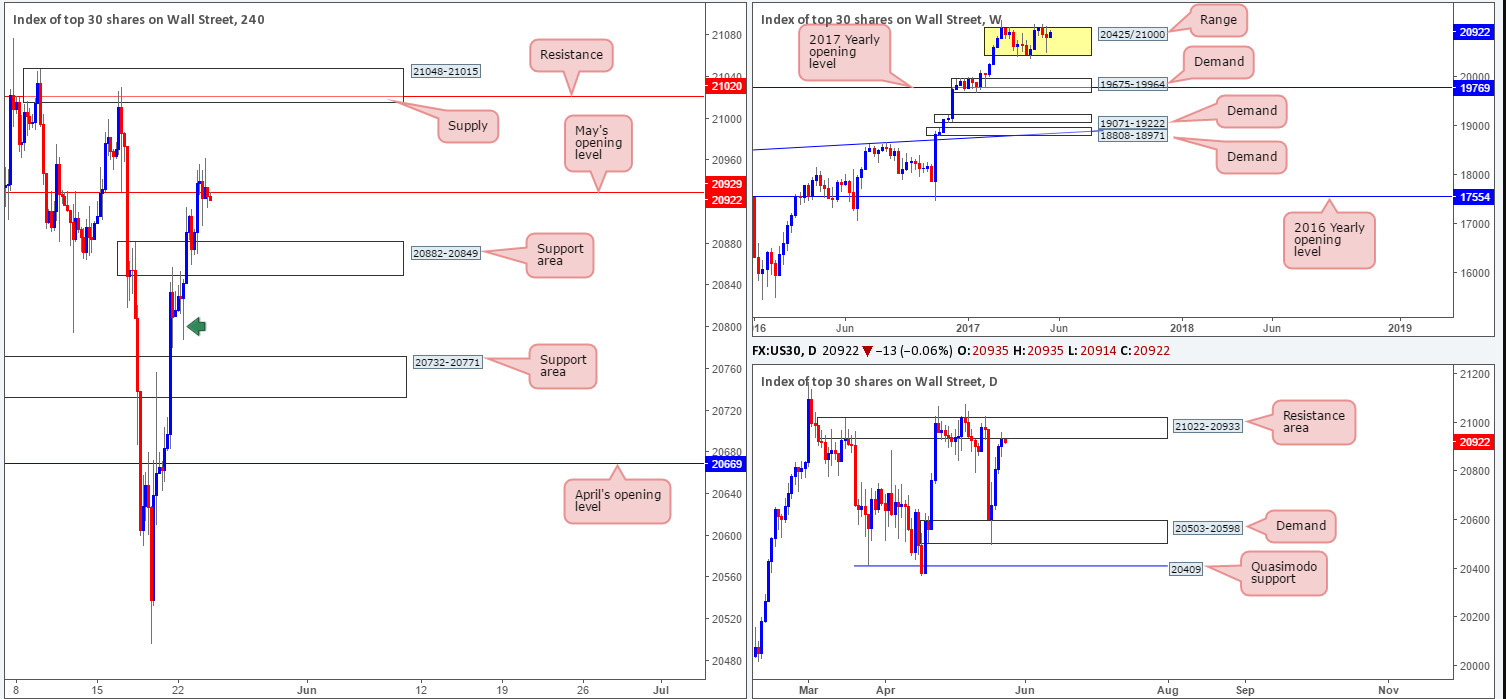
As can be seen from the H4 chart, US equities were slightly more subdued on Tuesday as price spent the day seesawing around May’s opening level at 20929. With daily price now teasing the underside of a resistance area at 21022-20933, and weekly action heading towards the top edge of its current range at 20425 (yellow area), we believe the bears may make an appearance soon. While this may be the case, shorting is risky seeing as how there’s a H4 support area plotted nearby at 20882-20849.
Our suggestions: Wait for H4 price to close below the current H4 support area. Once/if this occurs, then we see little stopping price from trading down to the H4 support area coming in at 20732-20771, followed by April’s opening level at 20669. The reason for not including the H4 demand base seen below around the 20816ish area simply comes down to the large H4 demand consumption tail seen marked with a green arrow at 20788.
Data points to consider: Several FOMC members set to take the stage at different times today.
Levels to watch/live orders:
- Buys: Flat (stop loss: N/A).
- Sells: Watch for H4 price to engulf 20882-20849 and then look to trade any retest seen thereafter ([waiting for a H4 bearish candle to form following the retest is advised] stop loss: ideally beyond the candle’s wick).
GOLD:
(Trade update: Closed the remainder of our long position at 1257.8).
Gold prices pulled back yesterday as the dollar recovered from lows of 96.80. Leaving the H4 61.8% Fib resistance at 1264.5 (green line) extended from the high 1295.4 unchallenged, the yellow metal sold off from H4 supply at 1268.3-1262.7. The move, as you can see, brought bullion down to within striking distance of March/April’s opening levels at 1245.9/1248.0. Whether these lines can hold the market higher for a second time is difficult to judge, since there are daily sellers likely in play now from the resistance area drawn from 1265.2-1252.1. Also noteworthy here is the daily bearish engulfing candle printed yesterday!
Our suggestions: With the above information in mind, where does this leave us in terms of potential setups? Well, we do not really favor a second bounce from the above said H4 monthly levels knowing that daily sellers could drag price below here. And selling would be highly risky without a decisive H4 close seen beyond these two monthly levels. But even then, the bears would have to contend with the H4 trendline support etched from the high 1278.0.
Therefore, opting to stand on the sidelines here may very well be the better path to take today.

Levels to watch/live orders:
- Buys: Flat (stop loss: N/A).
- Sells: Flat (stop loss: N/A).


