
EUR/USD:
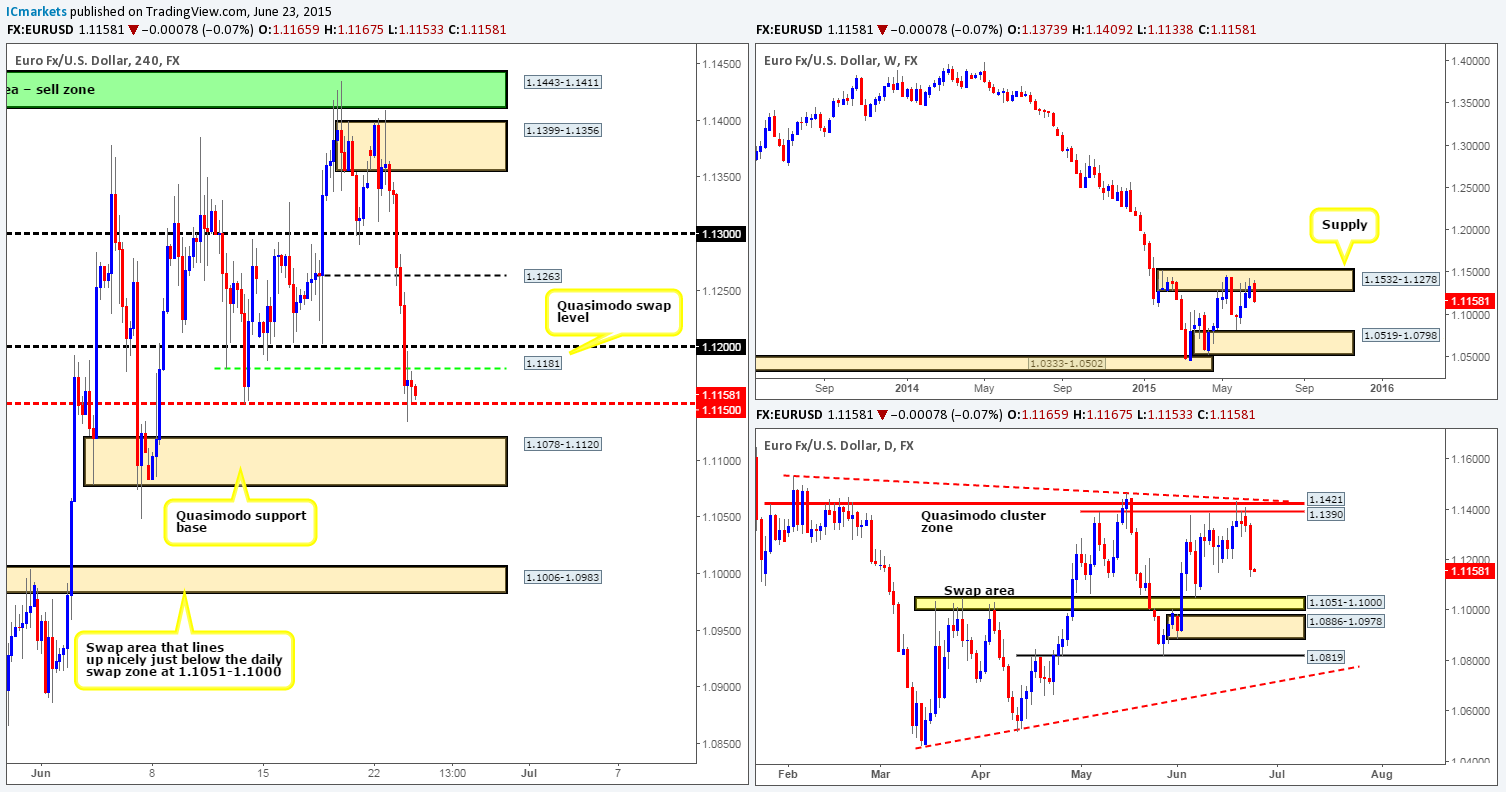
Weekly view: From the weekly timeframe, we can see that price is selling off from a weekly supply area at 1.1532-1.1278. This supply zone is a very significant hurdle in our opinion (held price lower since the 11th May) since if there’s a sustained break above this area, our long-term bias (currently short) on this pair will very likely shift north.
Daily view: Following Tuesday’s bearish response to the underside of a daily Quasimodo cluster zone at 1.1390/1.1421 (located relatively deep within the aforementioned weekly supply area), price aggressively extended lower during the course of yesterday’s session. In the event that this selling continues, it is likely we’ll see price collide with a daily swap area coming in at 1.1051-1.1000.
4hr view: The recent tumble on the Euro saw price take out several 4hr technical levels during its onslaught. It was only once price hit the mid-level number 1.1150 did we see the market stabilize. This move was likely triggered by comments from Federal Reserve member Jerome Powell who suggested a Fed rate hike could come as early as September.
Going into today’s sessions, however, we’re going to steer away from longs as we expect this market to continue selling off due to there being little to no supportive structures seen on the higher timeframes until the daily swap zone at 1.1051-1.1000. Therefore, it will only be once/if we see price connect with the 4hr swap area coming in at 1.1006-1.0983 (positioned just below the aforementioned daily swap zone) will our team be looking for buys in this market.
With regards to sells, nonetheless, our objective is simple. Watch for a convincing push below the 4hr Quasimodo support base at 1.1078-1.1120 (the space for price to move below this zone is very nice), and attempt to trade any retest seen that has corresponding lower timeframe confirming price action, targeting the aforementioned 4hr swap area.
Levels to watch/live orders:
- Buys: 1.1006-1.0983 [Tentative – confirmation required] (Stop loss: 1.0975).
- Sells: Flat (Stop loss: N/A).
GBP/USD:
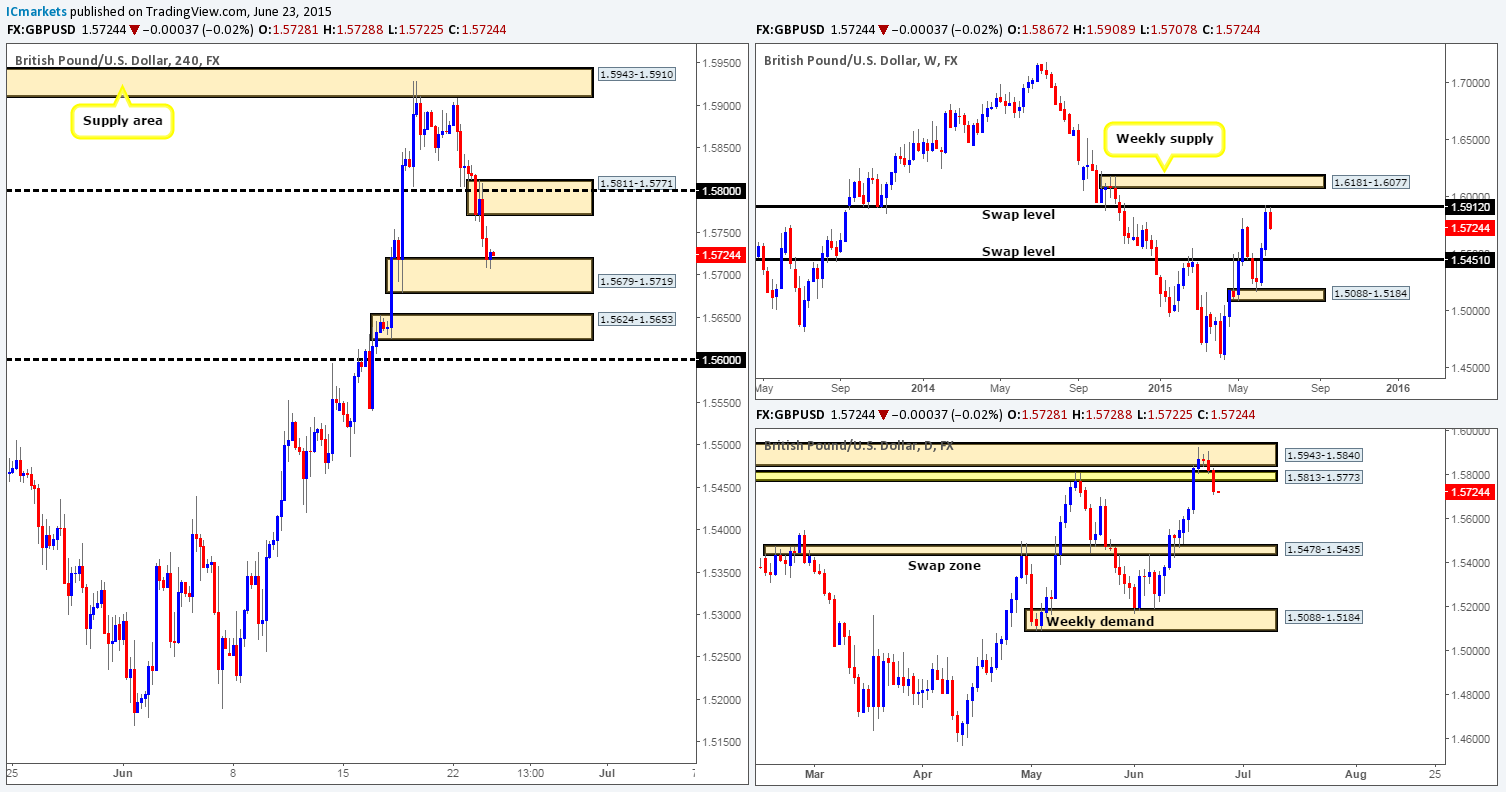
Weekly view – Following the recent two-week advance, selling interest is currently being seen around the underside of a very significant weekly swap level coming in at 1.5912.
Daily view: Yesterday’s daily candle reveals that price continued to sell off from the initial bounce seen from the daily supply area at 1.5943-1.5840 (encapsulates the aforementioned weekly swap level). This move, as you can see, forced price to close below the daily swap zone at 1.5813-1.5773, suggesting a bearish tone may take over this market today.
4hr view: For those who read our previous report on this pair, you may recall that we mentioned selling this market if 1.5800 was broken and retested. This, as you can see did indeed happen (picture-perfect setup seen on the 15 minute timeframe to enter short at 1.5806). Unfortunately though, we were not at our desks at this time and missed the trade completely, which went direct to our target – the 4hr demand area at 1.5679-1.5719.
Price is currently holding firm at this 4hr demand area, and it will be here an important decision needs to be made. Break lower or trade higher? A push lower would likely confirm further selling down to at least the small 4hr demand area at 1.5624-1.5653. And conversely, buying would likely push this market up to the newly-formed 4hr supply at 1.5811-1.5771.
Given the current location of price on the higher timeframe structures (see above in bold) at the moment, we have no interest in longs today. Shorts on the other hand, would only be permitted on the break of the current 4hr demand, but with the next target sitting only 25 or so pips below at 1.5624-1.5653; it would be difficult move to trade from a risk/reward perspective. Therefore, our team’s position remains flat.
Levels to watch/ live orders:
- Buys: Flat (Stop loss: N/A).
- Sells: Flat (Stop loss: N/A).
AUD/USD:
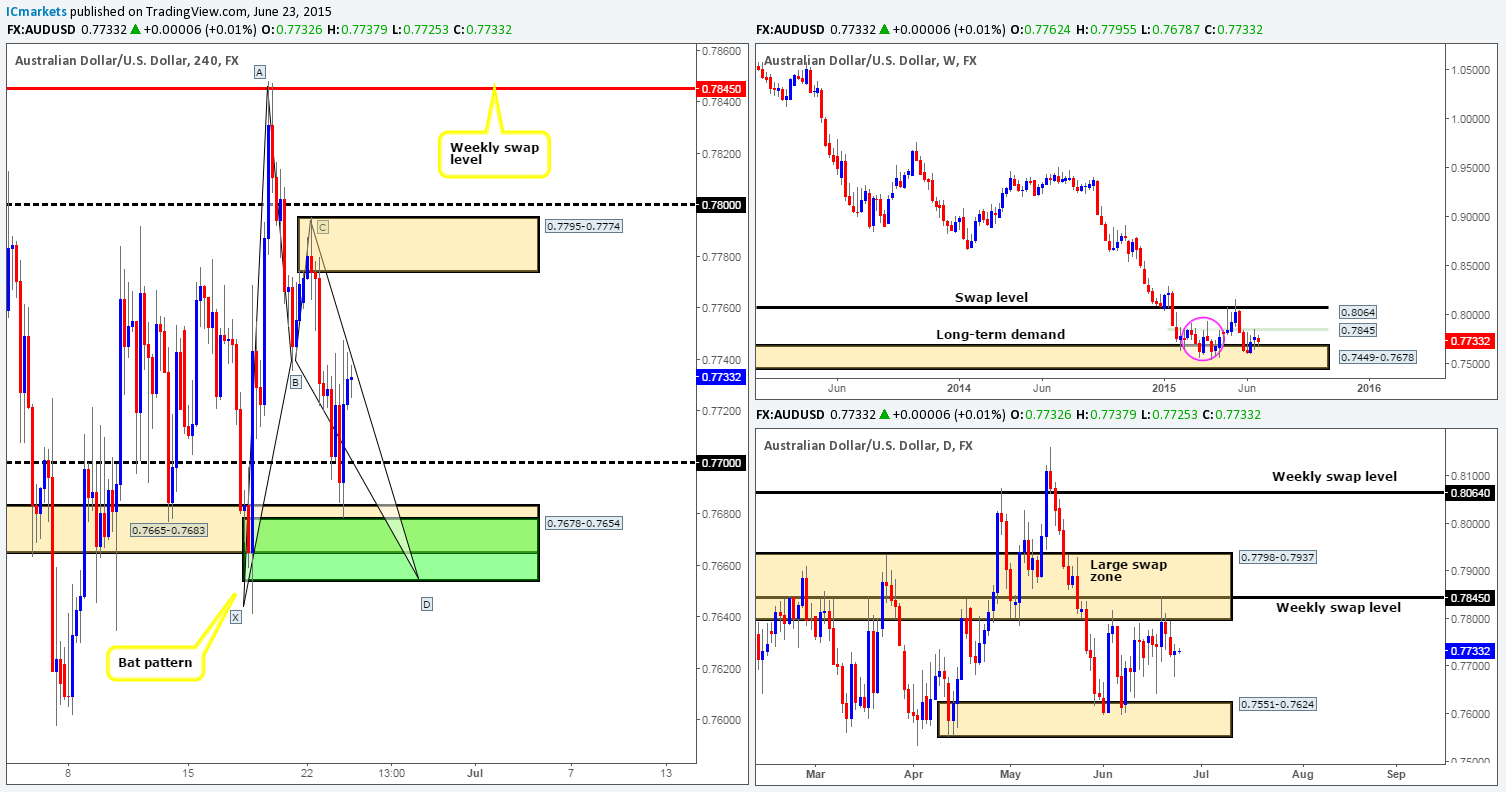
Weekly view – Following the rebound seen from the long-term weekly demand area at 0.7449-0.7678, price connected with a minor weekly swap level coming in at 0.7845 last week, consequently forming a weekly indecision candle. Judging by the sloppy reaction seen (pink circle – 02/02/15-06/04/15) between these two aforementioned weekly areas a few months ago, things could potentially get messy here again before we see any decisive move take place. From a long-term perspective, nonetheless, the trend direction on this pair is still very much south in our opinion, and will remain this way until we see a convincing break above 0.8064.
Daily view: From the pits of the daily scale, we can see that price has begun to consolidate (mid-range at the time of writing) between 0.7798-0.7937 (a large daily swap zone that surrounds the aforementioned weekly swap level), and 0.7551-0.7624 (a daily demand area that is located within the aforementioned weekly demand zone).
4hr view: For those who read our previous report on this pair, you may recall that we still had 30% of our remaining position running in the market from the short we took back up at 0.7842 on Thursday. As you can see, price hit the final take-profit target yesterday – the 4hr Harmonic Bat reversal zone seen in green at 0.7678-0.7654, which yielded a very nice return all in all.
We also mentioned to keep an eye out for longs at this 4hr Harmonic support. We personally did not buy here, but for anyone that did, great work! By now, if you’re following S. Carney’s trade management rules, your stop should be at breakeven as price has hit the 0.382% value of the A-D swing – some traders may choose to take partial profits here. The final take-profit target is seen at the 4hr supply area at 0.7795-0.7774, which lines up lovely with the 0.618% retracement value of the A-D swing, and as far as we can see is a nice area to be looking for confirmed shorts today should price reach thus high.
We’re also going to be keeping a close eye on 0.7700 for potential (confirmed) buying opportunities – lower timeframe confirmation is needed here since round numbers are prone to fakeouts.
Levels to watch/ live orders:
- Buys: 0.7700 [Tentative – confirmation required] (Stop loss: dependent on where one confirms this level).
- Sells: 0.7795-0.7774 [Tentative – confirmation required] (Stop loss: 0.7805).
USD/JPY:
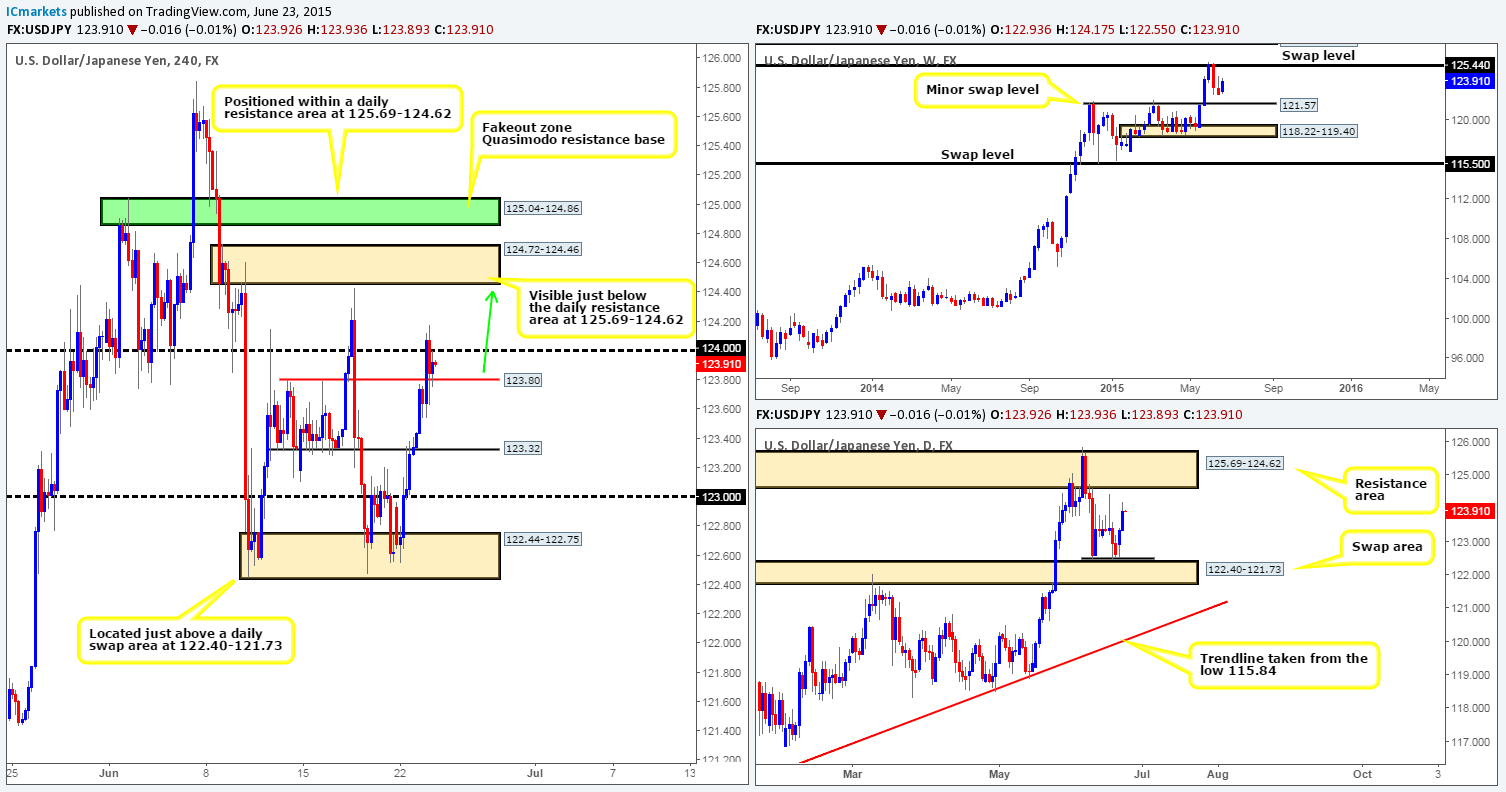
Weekly view – Buying interest is currently being seen from the 122.62 mark on the weekly timeframe. Provided this continues, we might, just might see price challenge the weekly swap level at 125.44 again. From a long-term perspective, however, the uptrend on this pair is still very much intact, and will remain that way in our opinion until the weekly swap level 115.50 is consumed.
Daily view: Monday’s rebound seen from around the low 122.44 (10/06/2015) saw further buying during the course of yesterday’s session, which confirmed, at least for us, price has formed a double-bottom formation just above the daily swap area at 122.40-121.73. In the event that the buyers can continue with this tempo today, it is likely price will challenge the daily resistance area seen at 125.69-124.62 (surrounds the aforementioned weekly swap level).
4hr view: The recent advance took out both the 4hr swap level at 123.32 and the 4hr Quasimodo resistance level (now acting support) at 123.80. It was only once price collided with the 124.00 region did we see this market stabilize.
The push above 124.00 has likely filled (and stopped out) the majority of sellers in this area, so if the buyers are able to hold out above 123.80 today (which at the time of writing appears like they are), the market could continue to rally up to at least the 4hr supply area seen at 124.72-124.46 (visible just below the aforementioned daily resistance area). However, for us to confidently buy from this area, we would need to see attractive lower timeframe buying confirmation beforehand.
Levels to watch/ live orders:
- Buys: 123.80 [Tentative- confirmation required] (Stop loss: dependent on where one confirms this level).
- Sells: Flat (Stop loss: N/A).
USD/CAD:
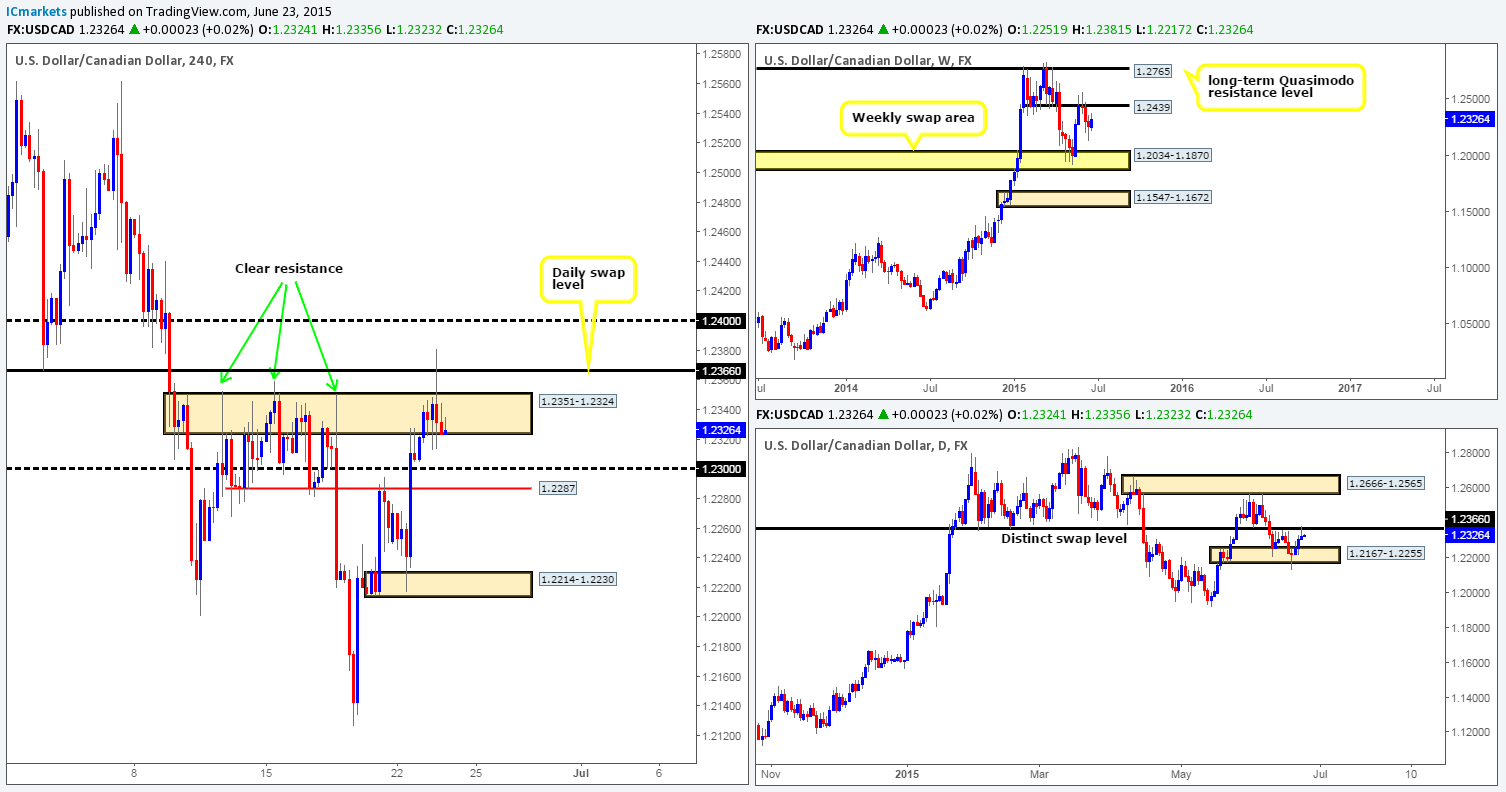
Weekly view – The USD/CAD pair met renewed buying interest last week around the 1.2126 mark, consequently causing a beautiful looking buying tail to form. However, it is difficult to tell from this timeframe why technical support came in at 1.2126 last week. Despite this recent buying, we can still see there is room for price to move south down to the weekly swap area at 1.2034-1.1870. With that being said though, our long-term bias on this pair remains long, and it will only be once/if we see a break below the aforementioned weekly swap area would our present bias likely shift.
Daily view: Following the fakeout spike below daily demand at 1.2167-1.2255 on Thursday, price has increased in value, forcing this market to cross swords with a daily swap level seen at 1.2366. It will only be once or indeed if we see a convincing push above this barrier will our team have the confidence to buy this pair.
4hr view: During the course of yesterday’s sessions, we saw price aggressively spike above a clear area of 4hr resistance at 1.2351-1.2324 to tie in with the aforementioned daily swap level.
As bearish as this may appear, selling this market right now is not something our team would be comfortable taking part in. The reason for why is simply because there is potential buy-side liquidity sitting just below around 123.00, which boasts a ‘buffer’ support just below in the form of a 4hr swap level in red at 1.2287. Therefore, until these levels are taken out, opting to stand on the side lines here may very well be the best position one can take.
Levels to watch/ live orders:
- Buys: Flat (Stop loss: N/A).
- Sells: Flat (Stop loss: N/A).
USD/CHF:
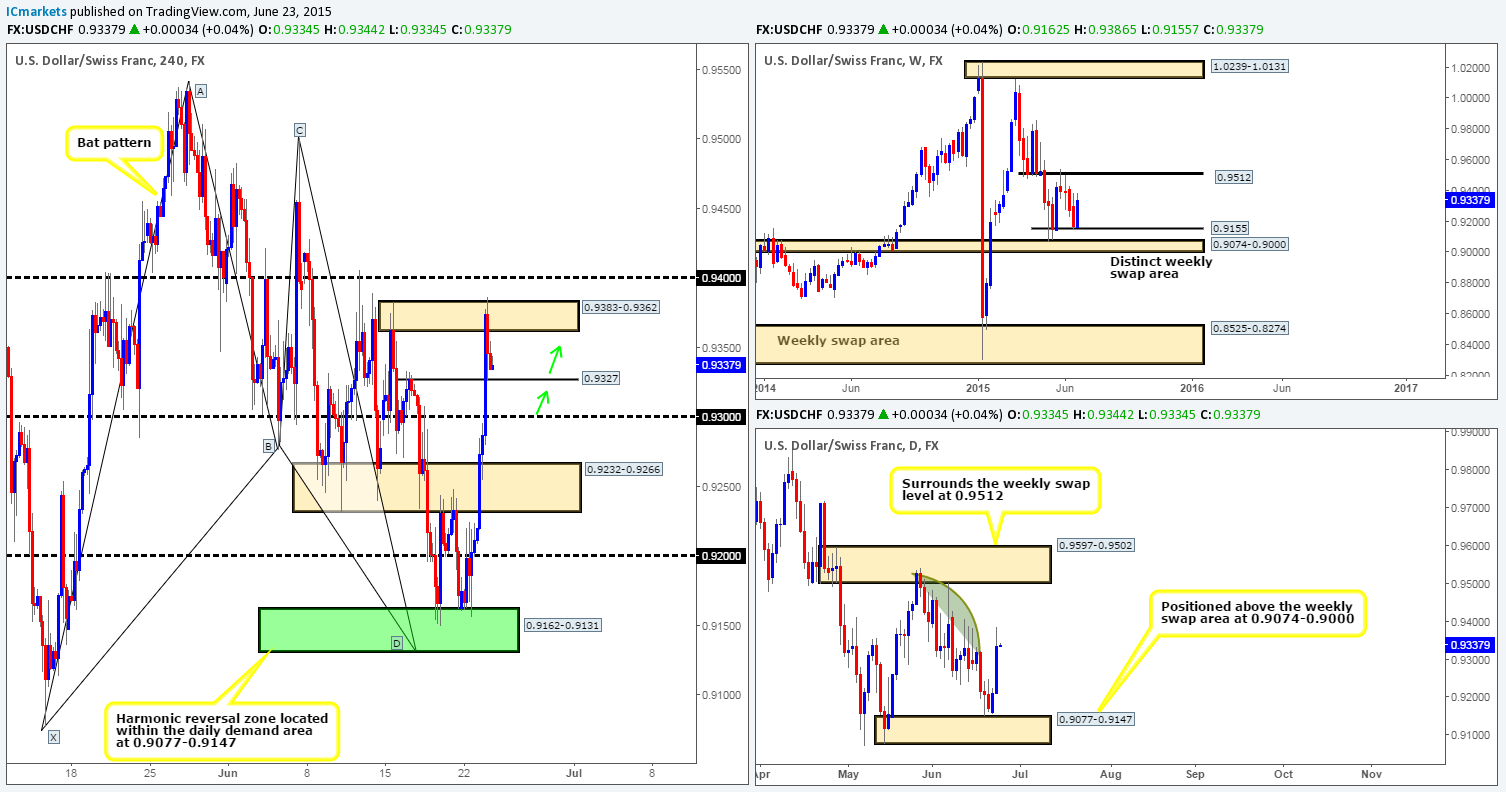
Weekly view – The view from the weekly timeframe is currently bullish. Price has found support around the 0.9155 mark. Continued buying from here could see price connect with 0.9512 – a proven weekly swap level.
Daily view: Following the rebound seen from just above daily demand at 0.9077-0.9147, price extended higher yesterday consequently pushing this market into a consumption zone (the green arc pattern). By consumption zone (in this case) we simply mean an area where we feel supply has already been taken out – check out the supply consumption wicks seen at 0.9405 and 0.9500. As such, if our analysis is correct, the path north should now be free up to the daily supply area at 0.9597-0.9502.
4hr view: As you can see, price rallied tremendously well from the 4hr Harmonic Bat reversal zone seen in green at 0.9162-0.9131 (located just within the aforementioned daily demand area). This move took out multiple 4hr technical levels and only really saw any selling interest once price tagged the 4hr supply area at 0.9383-0.9362, which lines up perfectly with the 0.618% retracement of A-D – final take-profit level if you follow Scott Carney’s trade management rules.
It is clear to see from this timeframe that price broke above the current 4hr supply by a few pips. This likely took out numerous buy stops, thus potentially clearing the path north up to 0.9400. Therefore, with possible direction being seen on this timeframe, and both the weekly and daily timeframes showing price trading from areas of support (see above) at the moment, our prime focus today will be looking for longs at the following levels:
- 4hr swap level at 0.9237.
- Round number 0.9300.
Just to be clear here though guys, lower timeframe confirmation will need to be seen at each level before we’d consider committing capital to a trade.
Levels to watch/ live orders:
- Buys: 0.9327 [Tentative – confirmation required] (Stop loss: dependent on where one confirms this level) 0.9300 [Tentative – confirmation required] (Stop loss: dependent on where one confirms this level).
- Sells: Flat (Stop loss: N/A).
US 30:
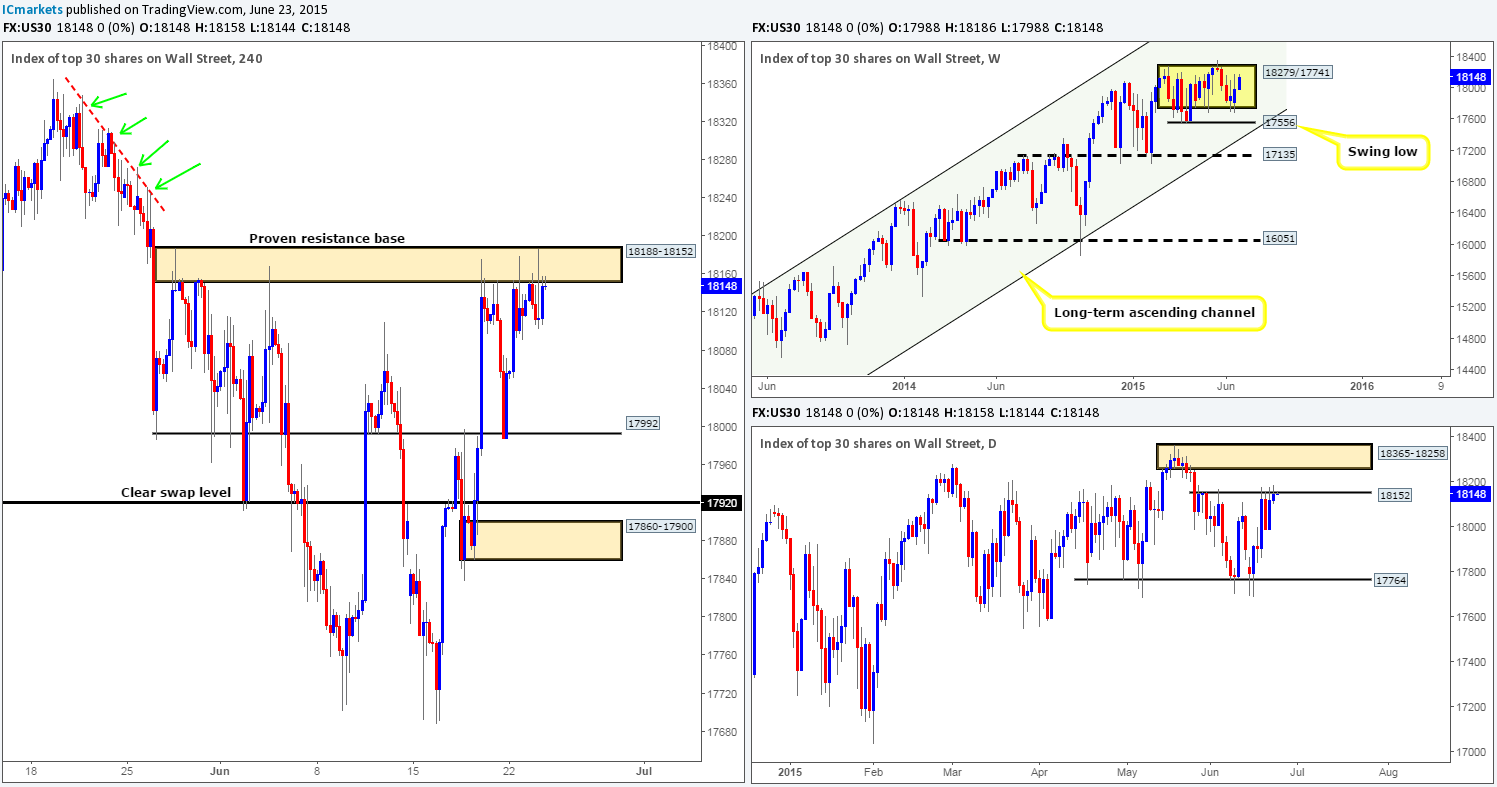
Weekly view – The weekly timeframe shows that the DOW continues to consolidate between 18279/17741 (yellow rectangle). With that being said though, price is currently nearing the upper limits of this range, so for any traders considering longs, you may want to take a note of this. From a longer-term perspective, however, the overall uptrend on this index is still very strong, and will remain this way in our opinion until we see a convincing push below 16051.
Daily view: From this viewpoint, we can see that price has been chomping at the underside of a minor daily resistance level at 18512 for the past few days. In the event that this level gives way, it is possible price will then advance to challenge the daily supply area at 18365-18258 (surrounds the aforementioned weekly swap level 18279 level).
4hr view: Much the same as the daily timeframe, the 4hr timeframe shows price is currently chewing on a 4hr resistance base coming in at 18188-18152 (essentially the same as our aforementioned daily resistance level) with little response being seen from the sellers. As such, taking short trades from this area is not something we’d feel comfortable taking part in today.
If price manages to break above this 4hr resistance barrier, the path north will potentially be free up until the overall high 18365 (the upper limit of the aforementioned daily supply area). Our rationale behind this idea comes from seeing little to no active supply above. Take a look at the red trendline, the green arrows point to where we believe potential supply consumption wicks reside (18171/18227/18313/18348). The reason these spikes exist (only our opinion mind you) is because pro money needed to fill unfilled sell orders in order to continue shorting, thus once price returns to this (possibly) consumed area, there should be very little sell-side liquidity to stop price from rallying until around 18365.
Levels to watch/ live orders:
- Buys: Flat (Stop loss: N/A).
- Sells: Flat (Stop loss: N/A).
XAU/USD (Gold)
Weekly view – The weekly timeframe shows gold is now effectively range bound (in our opinion) between a weekly resistance barrier at 1223.1-1204.5 and a weekly demand at 1142.5-1167.3. From a long-term perspective, however, gold is still trending south in our opinion, and It will only be once/if we see a close above the weekly trendline extended from the high 1488.0 would we begin to feel that this market may be reversing.
Daily view: Following Monday’s sell off from the daily supply area at 1214.7-1205.5 (located within the aforementioned weekly supply area), price continued to spiral south yesterday, consequently pushing gold deeper into a daily buy zone coming in at 1170.3-1184.0.
4hr view: The 4hr timeframe shows that after price retested the recently broken 4hr swap area at 1188.1-1185.7, price fell during the course of yesterday’s sessions, forcing this market to cross swords with a 4hr buy zone seen at 1175.1-1177.5 (located deep within the aforementioned daily buy zone).
Buying from this zone is certainly a possibility today in our opinion. With that being said though, we must stress that we have no intention to buy at market, we’ll need to see extremely attractive lower timeframe buying confirmation here before risking capital to this idea. In addition to this, even though this trade would be supported by a daily buy zone, we have to be prepared for the possibility that price could still effectively break below the current 4hr demand to tie in with the lower limit of the weekly range (see above for levels), so trade carefully here guys!
Levels to watch/ live orders:
- Buys: 1175.1-1177.5 [Tentative – confirmation required] (Stop loss: 1172.3).
- Sells: Flat (Stop loss: N/A).


