
A note on lower timeframe confirming price action…
Waiting for lower timeframe confirmation is our main tool to confirm strength within higher timeframe zones, and has really been the key to our trading success. It takes a little time to understand the subtle nuances, however, as each trade is never the same, but once you master the rhythm so to speak, you will be saved from countless unnecessary losing trades. The following is a list of what we look for:
- A break/retest of supply or demand dependent on which way you’re trading.
- A trendline break/retest. Buying/selling tails – essentially we look for a cluster of very obvious spikes off of lower timeframe support and resistance levels within the higher timeframe zone.
- Candlestick patterns. We tend to only stick with pin bars and engulfing bars as these have proven to be the most effective.
For us, lower timeframe confirmation starts on the M15 and finishes up on the H1, since most of our higher timeframe areas begin with the H4. Stops usually placed 5-10 pips beyond your confirming structures.
EUR/USD:
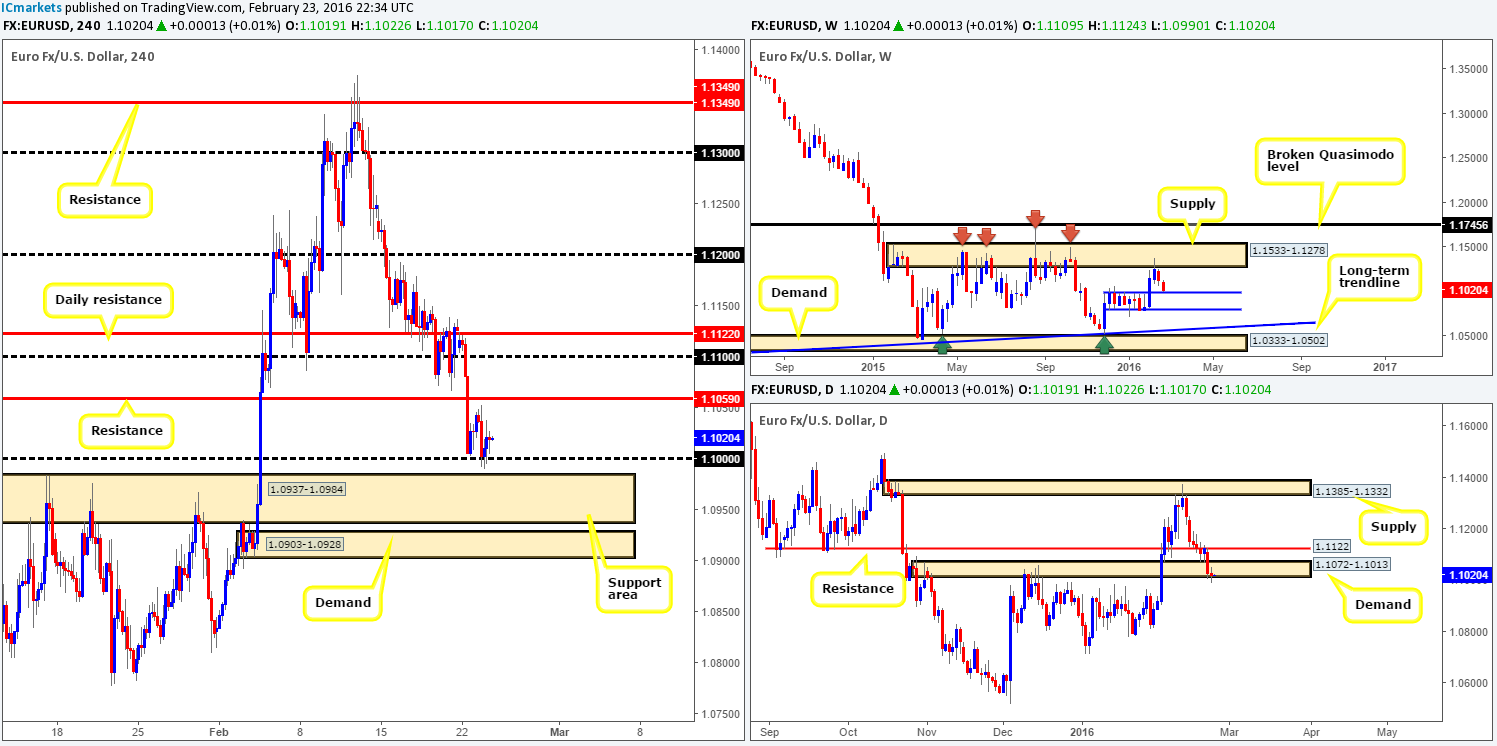
On the whole, it was a relatively quiet day in this market yesterday. Disappointing German IFO data saw the single currency whipsaw through the large psychological support 1.1000, likely grinding through a ton of sell stops sitting just below. Following this, the EUR managed to bounce back to highs of 1.1037 on the day.
Given that price printed new lows yesterday, more stops have also likely been churned up beneath daily demand at 1.1072-1.1013, which ended with a daily indecision candle forming. What is more, this allowed the market to come within seven pips of connecting with weekly support at 1.0983. In our previous report (http://www.icmarkets.com/blog/tuesday-23rd-february-daily-technical-outlook-and-review/) we spoke of looking for longs from 1.1000, which as we have already seen, did hold firm. Well done to any of our readers who managed to lock in some intraday pips here!
An ideal setup for us, at this point in time, would be another dive below 1.1000. This time, however, we’d like to see price collide with the H4 support area at 1.0937-1.0984 for a confirmed entry long. Not only would price then be shaking hands with the aforementioned weekly support, but there’s also a very good chance that most, if not all of the stops beneath the above said daily demand would be consumed (thus giving pro money a bucket load of liquidity to buy into). The reason for needing confirmation here is simple – just below sits an impressive H4 demand drawn from 1.0903-1.0928, which could act as a magnet for price and pull the market a lower before buyers make an appearance.
Levels to watch/live orders:
- Buys: 1.0937-1.0984 [Tentative – confirmation required] (Stop loss: dependent on where one confirms this area).
- Sells: Flat (Stop loss: N/A).
GBP/USD:
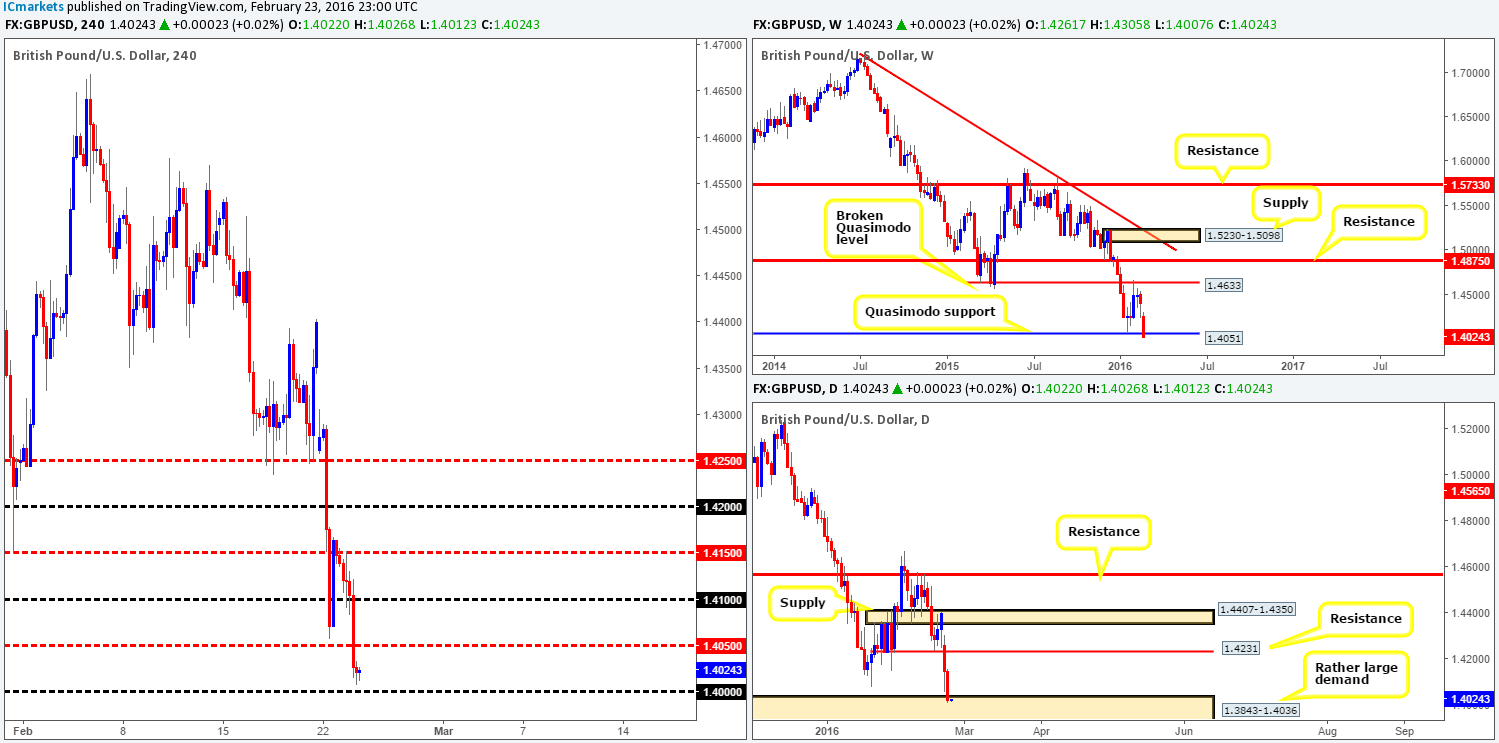
Weighed on heavily by fears of a Brexit, further downside was seen on the GBP/USD pair yesterday. U.S. based selling continued to pummel this market, reaching 1.4007 by the days end.
Putting the fundamentals aside for a minute, the technicals show buyers and sellers currently battling for position around a weekly Quasimodo support penciled in at 1.4051, whilst (something we missed yesterday), daily demand at 1.3843-1.4036 has now been brought into view. In addition to this, the H4 chart shows that price is hovering a few pips above a large psychological support drawn from 1.4000, which no doubt a lot of traders are paying close attention to. Collectively, this is a strong floor of support to break through in our opinion and Cable could be due for a bounce soon.
Conversely, however, buying here puts one against the predominant trend, and with investors unloading pound sterling here due to the political situation in the U.K, we’re going to remain flat for the time being. If one is comfortable entering from the above said structures, nevertheless, we would strongly advise only doing so with lower timeframe confirmation!
Levels to watch/live orders:
- Buys: Flat (Stop loss: N/A).
- Sells: Flat (Stop loss: N/A).
AUD/USD:
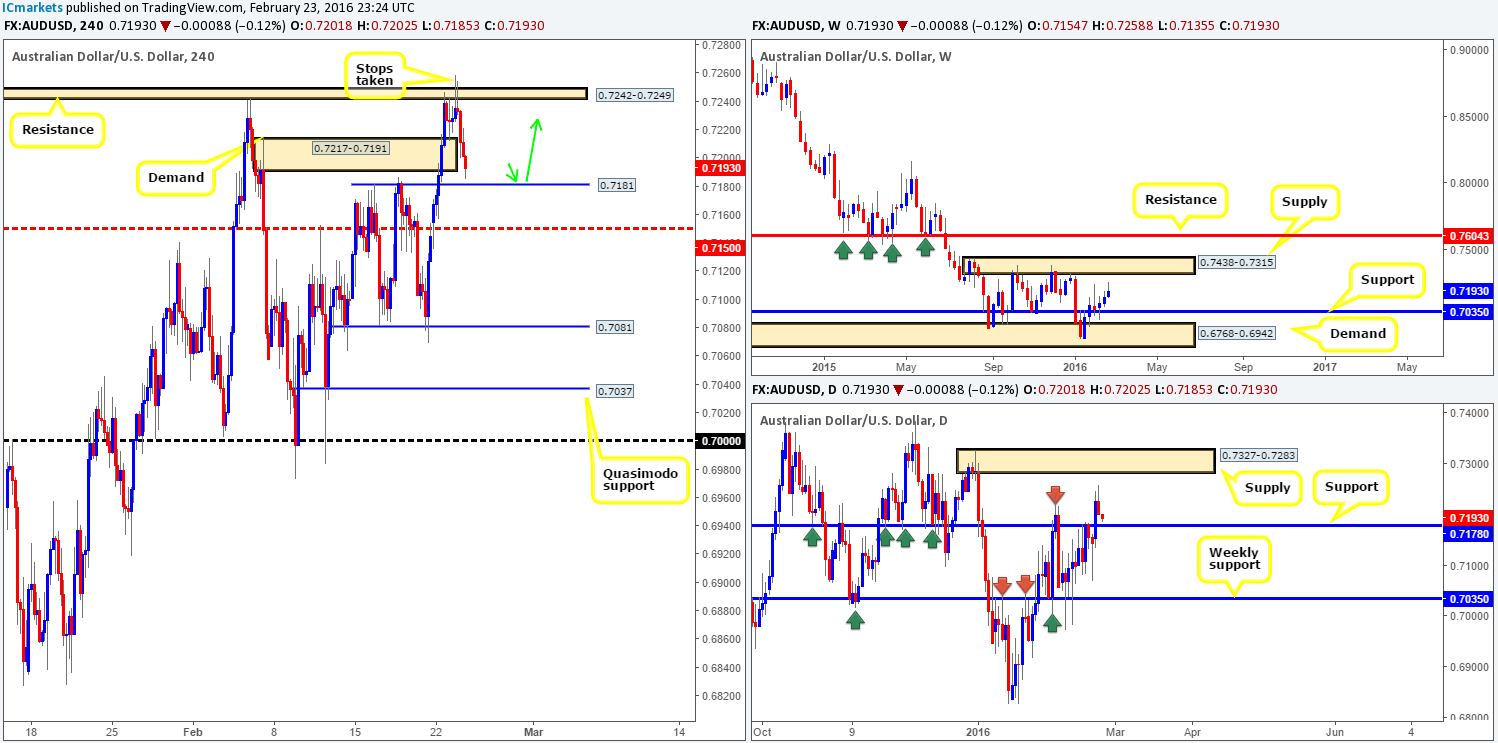
Beginning with the weekly chart this morning, we can see that the path north shows very little stopping this pair from rallying higher, at least up until supply drawn from 0.7438-0.7315. Zooming in and looking at the daily chart, however, price changed tracks yesterday and appears to be heading in the direction of support penciled in at 0.7178, which we believe is likely to hold.
Moving down to the H4 chart, two clear selling wicks were printed during yesterday’s sessions which saw the pair tumble lower and eventually pierce demand seen at 0.7217-0.7191. With stops likely taken out from above the resistance area at 0.7242-0.7249, and stops presently getting churned up around the aforementioned demand, we see price tagging in the 0.7181 level and rallying higher today. Not only is this level attractive on the H4 chart, it also boasts daily support mentioned above at 0.7178.
We are relatively confident a bounce will be seen from 0.7181 today, so we have set a pending buy order at 0.7182 using 50% of our usual position. We’ll enter the remaining 50% upon seeing some sort of lower timeframe buy signal. The stop-loss order is placed at 0.7172, just below the M30 demand (0.7173-0.7189) that surrounds the H4 level.
Levels to watch/live orders:
- Buys: 0.7182 [Pending order 50% of usual position] (Stop loss: 0.7172). 0.7181 [Tentative – confirmation required] (Stop loss: dependent on where one confirms this level).
- Sells: Flat (Stop loss: N/A).
USD/JPY:
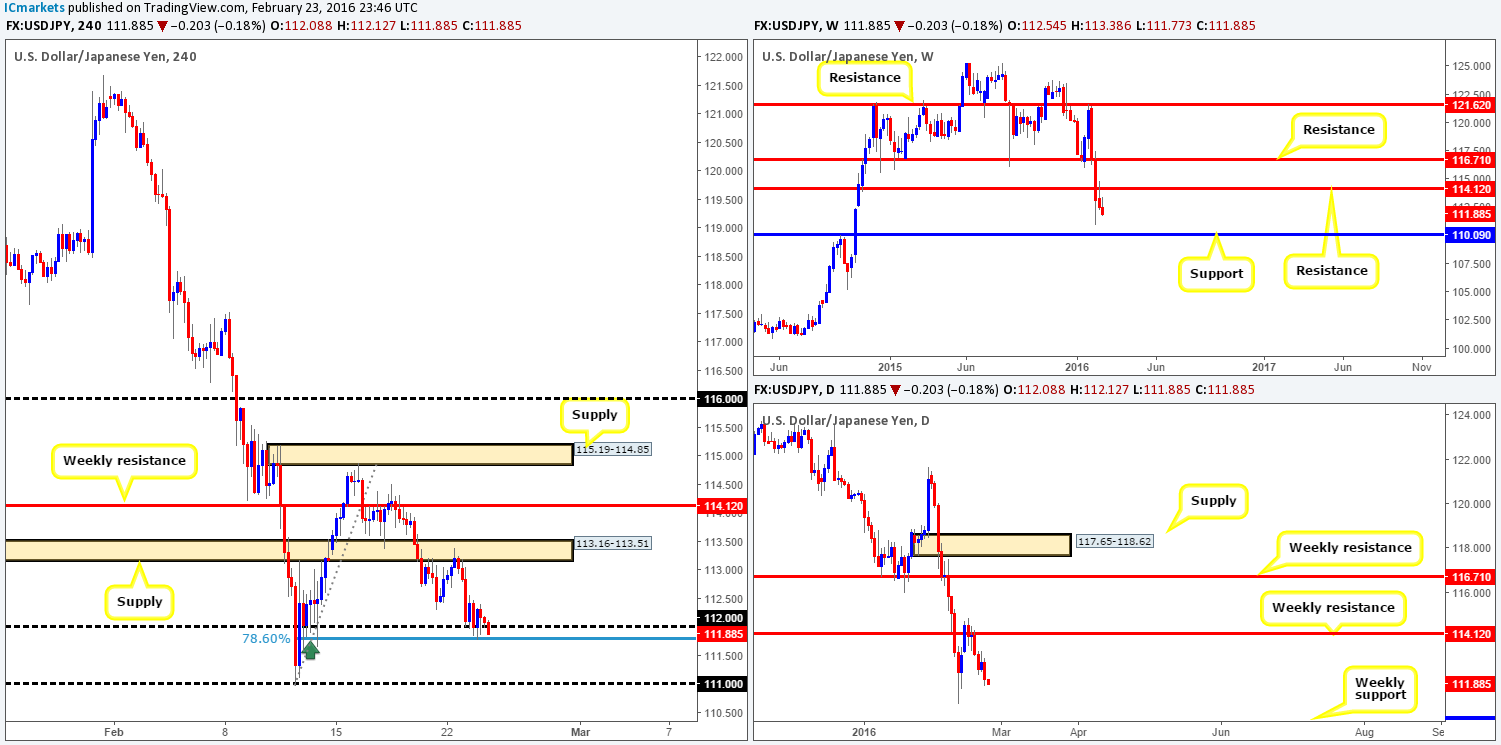
Following yesterday’s plunge from H4 supply at 113.16-113.51, the USD/JPY pair entered into a phase of consolidation, using the psychological number 112.00 as a base support. In our previous report (http://www.icmarkets.com/blog/tuesday-23rd-february-daily-technical-outlook-and-review/) we mentioned that a bounce from 112.00 is likely considering it boasts both a 78.6% Fibonacci level at 111.77 and a collection of very obvious buying tails marked with a dark green arrow. Well done to any of our readers who managed to lock in some intraday pips here. We hope most have already closed in profit as we did not expect much more from this move.
In view of weekly price respecting the underside of 114.12 as weekly resistance, there is a strong possibility that this pair will continue to grind lower to 110.09 – a long-term weekly support. Given this, what we have our eye on today is a break below and (confirmed) retest of 112.00 since at that point, you’d be trading in-line with weekly expectations. Should our analysis be correct and we manage to pin down a setup below 112.00 sometime today, we’ll be eyeing the 111.00 figure as our immediate take-profit target, followed by the weekly support at 110.09.
The reason for not including the daily chart in our analysis this time is simply because the 11th Feb daily low 110.96 lines up nicely with our first take-profit level (111.00). So if buyers should come into the market around this region, our position would still profit regardless.
Levels to watch/live orders:
- Buys: Flat (Stop loss: N/A).
- Sells: Watch for bids to be consumed around 112.00 and look to trade any retest seen thereafter (lower timeframe confirmation required).
USD/CAD:
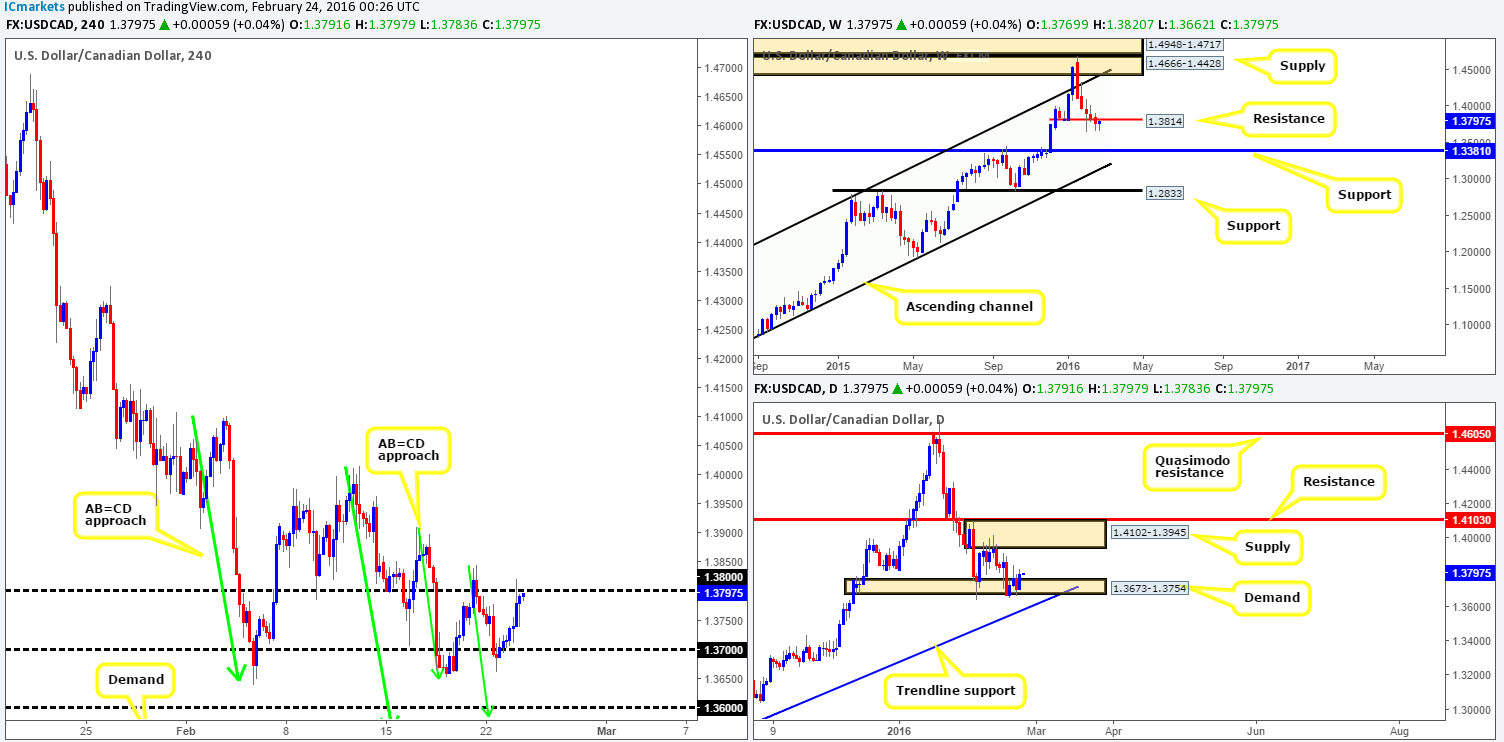
Kicking-off our analysis with a look at the weekly chart this morning shows that the USD/CAD recently retested the underside of the 1.3814 resistance, which could force this market to fresh lows sometime soon. Climbing down into the pits of the daily chart, however, demand at 1.3673-1.3754 continues to remain bid (although it appears very weak in our opinion).
Stepping down to the H4 chart, the buyers and sellers are currently seen battling for position around psychological resistance 1.3800. Any sustained move above this number could suggest that the weekly resistance discussed above may not hold, whereas a rejection of 1.3800 could see price attack 1.3700 again, and quite possibly much lower. Considering how strong this pair moves on a daily basis at the moment, we’re going to stick with our original outlook posted on Tuesday:
Current action appears to be chalking up two H4 AB=CD bull patterns (see green arrows) on approach to a psychological support at 1.3600 and a H4 demand fixed at 1.3516-1.3561. Both of these areas, as you can probably see, are supported by the daily trendline extended from the low 1.1919. Despite this, we favor longs from the demand. Our rationale behind this approach comes from the fact that psychological boundaries such as 1.3600 are notorious for fakeouts, and with a juicy-looking H4 demand lurking only forty pips below at 1.3516-1.3561, a break lower is very likely, hence our decision to focus on the demand.
Despite the confluence seen at this demand, nevertheless, we would highly recommend waiting for the lower timeframes to confirm this zone since, weekly action is presently showing room for a move lower to support at 1.3381.
Levels to watch/live orders:
- Buys: 1.3600 [Tentative – confirmation required] (Stop loss: dependent on where one confirms this level). 1.3516-1.3561 [Tentative – confirmation required] (Stop loss: dependent on where one confirms this area).
- Sells: Flat (Stop loss: N/A).
USD/CHF:
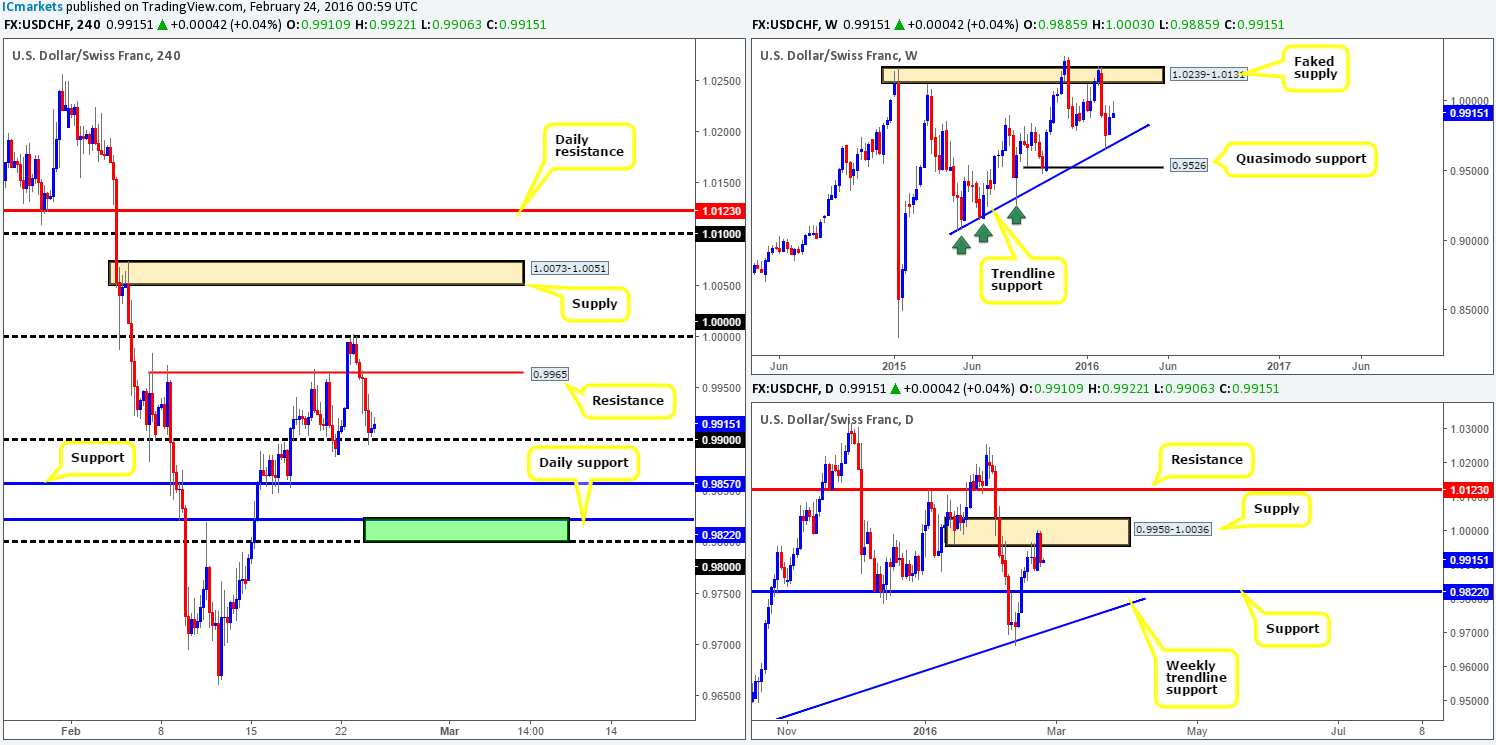
The USD/CHF pair, as you can see, sold off heavily from parity (1.0000) yesterday, ending the day jabbing into psychological support 0.9900, which, at the time of writing, is holding firm. In view of this, would we consider 0.9900 a viable platform to buy from today? Well, considering that price has just come from daily supply at 0.9958-1.0036, we have absolutely no intention of trading from here.
An area we are interested in, however, is seen between daily support at 0.9822 and the psychological number 0.9800 (green area). The reason being is this is the next objective to reach on the daily chart should price continue to decline. In addition, there is little resistance seen overhead on the weekly chart until price reaches a faked supply drawn from 1.0239-1.0131.
Therefore, the 0.9822/0.9800 region would be the only place we’d be willing to trade this market. Just to be clear here though, we will not be placing pending orders around this area since a fakeout through the zone is highly likely – waiting for price to confirm stability before taking action is, at least in our book, the best course of action.
Levels to watch/live orders:
- Buys: 0.9800/0.9822 [Tentative – confirmation required] (Stop loss: dependent on where one confirms this area).
- Sells: Flat (Stop loss: N/A).
DOW 30:
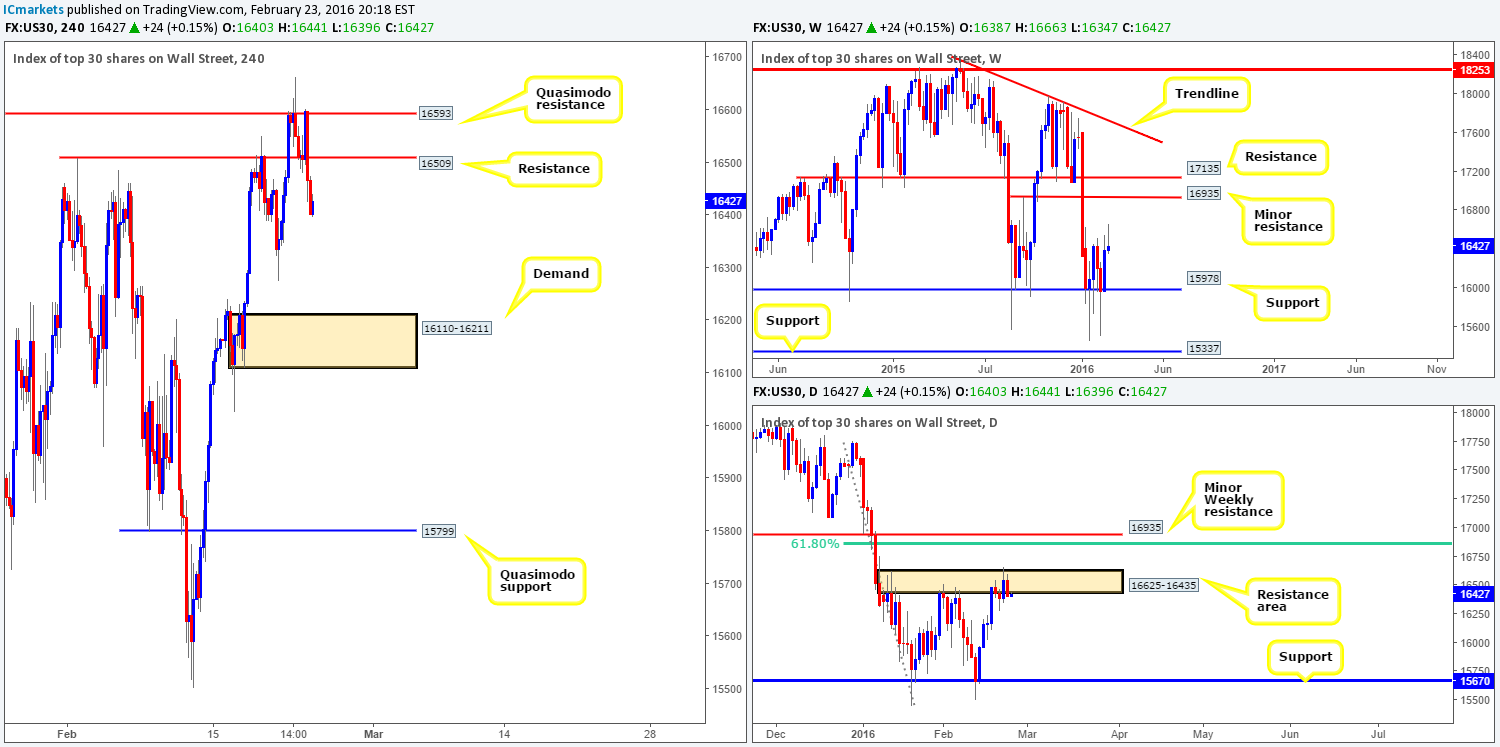
For those who read our previous report on the DOW (http://www.icmarkets.com/blog/tuesday-23rd-february-daily-technical-outlook-and-review/), you may recall us mentioning to watch for possible (lower timeframe) long entries from H4 support at 16509. As can be seen from the chart, price did indeed react here but quickly found the H4 Quasimodo resistance level at 16593 too strong to overcome. Well done to any of our readers who managed to lock in a position from here as we missed this move altogether! The sell-off from 16593 was strong, and consequently pushed price below the aforementioned H4 support (now resistance), reaching lows of 16402 by the close.
Taking all of the above on board, where do we go from here? Well, weekly action shows price loitering between support at 15978 and a minor resistance penciled in at 16935, whilst daily supply at 16625-16435 is currently seen capping upside to this market.
Personally, we do not like the look of the charts at the moment, as there is very little opportunity that catches our eye. Therefore, in the absence of clearer price action our team will remain flat going into today’s sessions.
Levels to watch/live orders:
- Buys: Flat (Stop loss: N/A).
- Sells: Flat (Stop loss: N/A).
XAU/USD: (Gold)
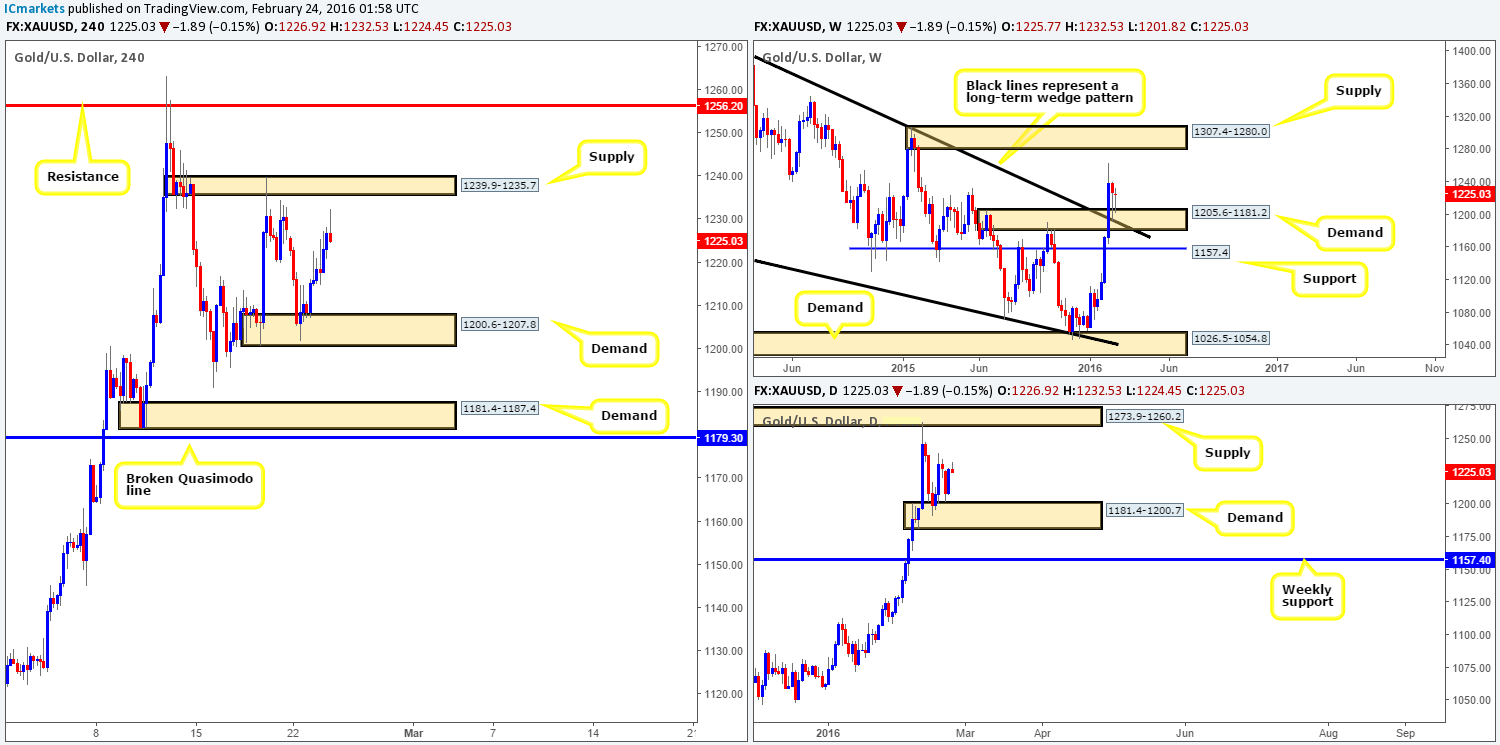
As we noted in our previous report (http://www.icmarkets.com/blog/tuesday-23rd-february-daily-technical-outlook-and-review/), the H4 demand at 1200.6-1207.8 was very significant. Not only did it sit on top of a daily demand at 1181.4-1200.7, it was also housed within the extremes of a weekly broken supply (now demand) at 1205.6-1181.2, that boasted a broken weekly wedge resistance (now support) taken from the high 1485.3.
Unfortunately, we were unable to pin down a lower timeframe (confirmed) entry from here yesterday! Well done to any of readers who did! Judging by the weekly timeframe, the yellow metal has room to continue advancing up to supply drawn from 1307.4-1280.0. By the same token, daily flow is also seen within a realistic reach of supply coming in at 1273.9-1260.2 (positioned just below the aforementioned weekly supply).
Given the above points, this is what we have logged so far:
- Seeing as price is trading close to a H4 supply zone at 1239.9-1235.7, it might be an idea for traders who went long from our original H4 demand at 1200.6-1207.8 to liquidate some of their position now.
- Should price break above the aforementioned H4 supply, this would likely open the trapdoor up to H4 resistance at 1256.2 (sits just below the aforementioned daily supply).
- A close higher not only indicates a further advance is likely on the horizon, but also opens up the doors to a possible (confirmed) buy trade on any retest seen of 1239.9-1235.7.
Should our analysis be correct and we manage to jump in long on any retest seen, we’ll look to liquidate our full position around 1256.2. Holding a long trade higher than this puts you against both daily and weekly supply (see above in bold), which will not likely do your account any favors!
Levels to watch/live orders:
- Buys: Watch for offers to be consumed around 1239.9-1235.7 and look to trade any retest seen thereafter (lower timeframe confirmation required).
- Sells: Flat (Stop loss: N/A).


