
Key risk events today:
RBNZ Official Cash Rate and Rate Statement; French Flash Services PMI and Flash Manufacturing PMI; German Flash Manufacturing PMI and Flash Services PMI; EUR Flash Manufacturing PMI and Flash Services PMI; UK Flash Manufacturing PMI and Flash Services PMI; US Flash Manufacturing PMI and Flash Services PMI; Fed Chair Powell Testifies; Crude Oil Inventories.
(Previous analysis as well as outside sources – italics).
EUR/USD:
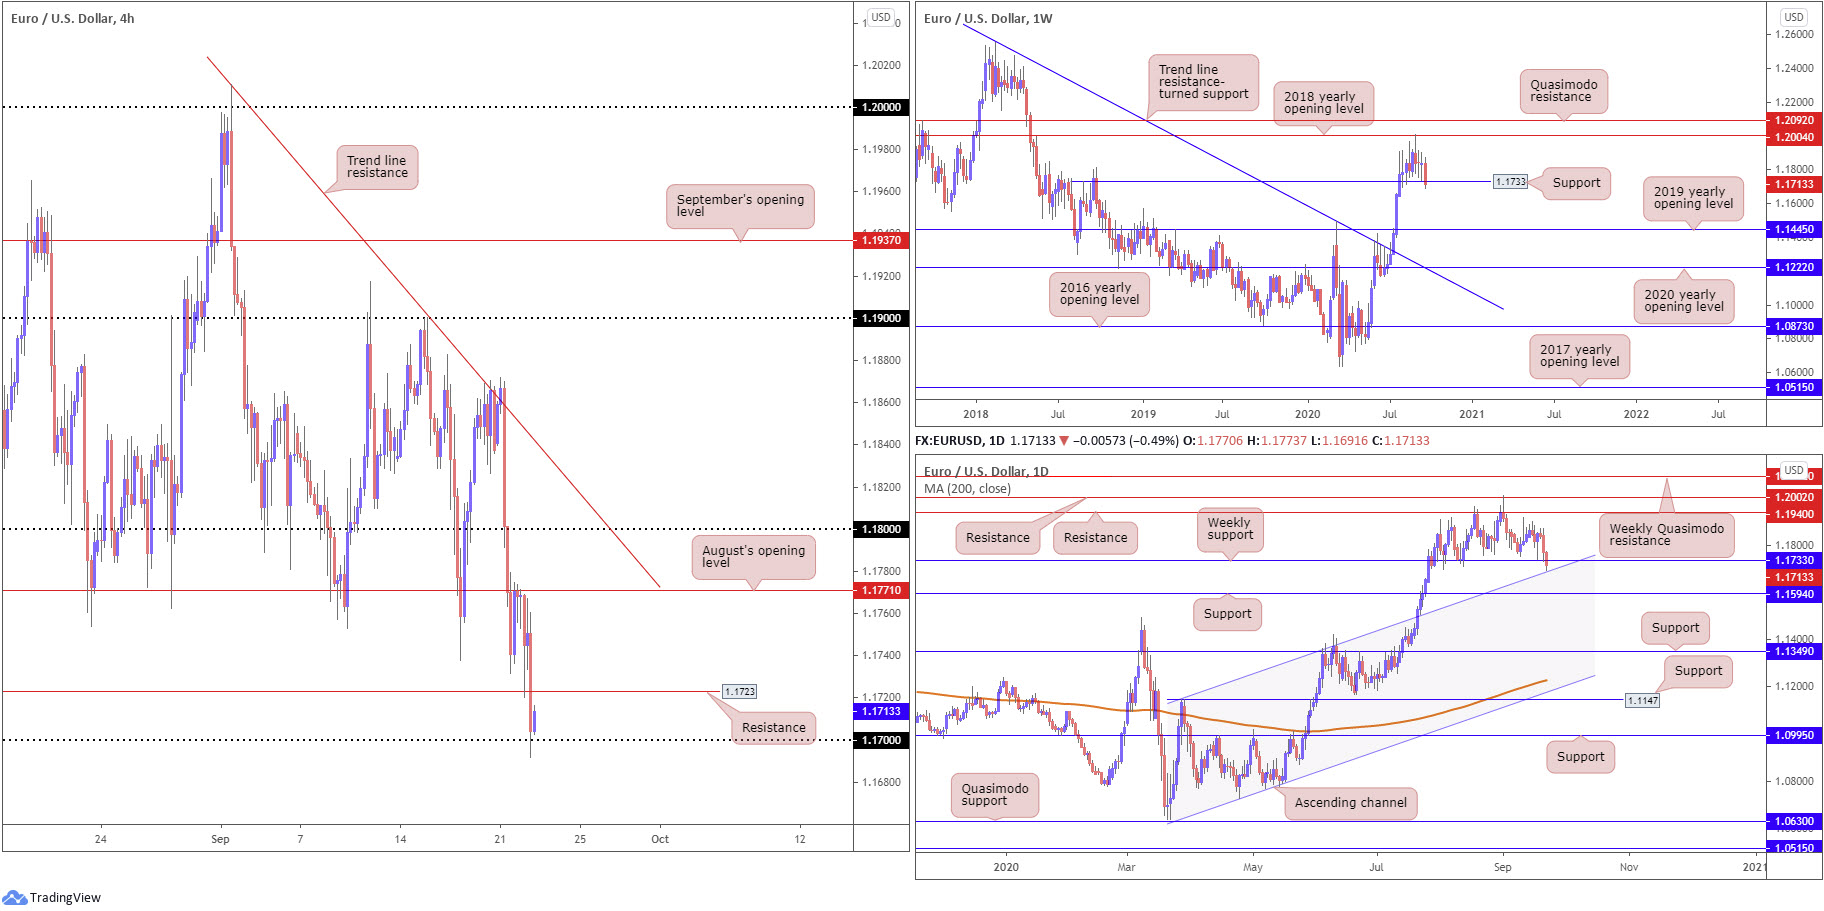
Europe’s shared currency depreciated further against its US counterpart Tuesday, shedding nearly half a percent.
Technical studies reveal H4 price retested August’s opening level at 1.1771, then followed through to shake hands with Quasimodo support at 1.1723. Following a short-lived recovery attempt, recent hours witnessed a decline to 1.17, which, as you can see, is so far holding. With 1.1723 expected to serve as resistance, additional underperformance today shifts focus towards support priced in at 1.1652 (not visible on the screen).
On the weekly timeframe, support at 1.1733, a prior Quasimodo resistance level, is under attack. A notable close beyond the aforementioned level shines the spotlight on the 2019 yearly opening level at 1.1445. Interestingly, on the daily timeframe, dipping sub 1.1733 positions price within striking distance of daily channel resistance-turned support, extended from the high 1.1147.
Areas of consideration:
Support on the weekly timeframe at 1.1733 remains a central theme in this market. Overlooking this level might prove a mistake, having seen daily channel support resting close by.
Prospective buyers off the 1.17 handle on the H4 are likely eyeing a close above resistance at 1.1723 before committing. However, as mentioned in Tuesday’s technical briefing, it is also worth keeping in mind that a fakeout could be seen through 1.17 into the aforementioned channel support on the daily timeframe (currently positioned around 1.1688) before buyers make an appearance.
GBP/USD:
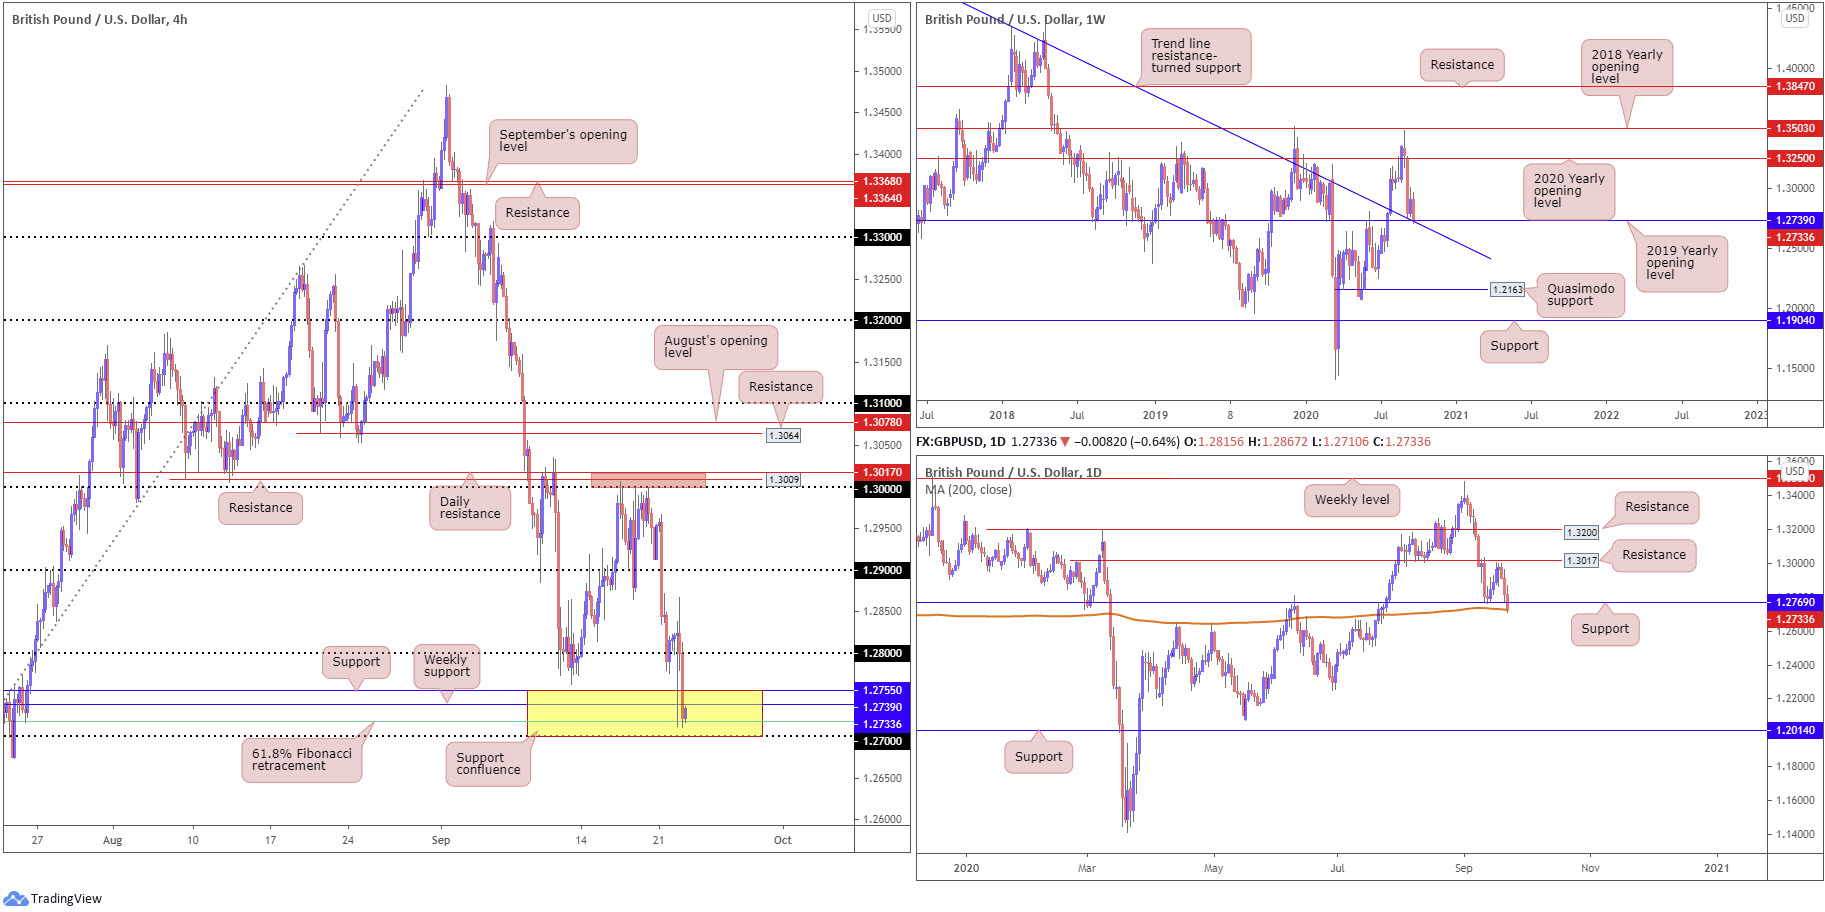
BoE comments sparked renewed downside pressure in GBP/USD Tuesday, as the Governor revealed the MPC has seriously considered cutting rates into negative territory.
For those who read Tuesday’s technical briefing you may recall the piece highlighted interesting support between
1.27/1.2755 ([yellow] made up of the 1.27 handle on the H4, a 61.8% H4 Fibonacci retracement ratio at 1.2718 [green], weekly support plotted at 1.2739 [the 2019 yearly opening value] and H4 support at 1.2755). In addition to this, traders may also wish to acknowledge the 200-day SMA (orange – 1.2724) resides within the support zone, as well as a weekly trend line resistance-turned support, taken from the high at 1.5930.
Areas of consideration:
While intraday sellers have likely locked in some profits under 1.28, traders, as underlined in Tuesday’s briefing, with a focus on multi-timeframe analysis will be conscious of the support area mentioned above at 1.27/1.2755 as within it carries some heavyweight levels. For that reason, a strong recovery from the aforementioned support would not be a surprise, with additional buying likely to occur once/if we break above 1.28.
AUD/USD:
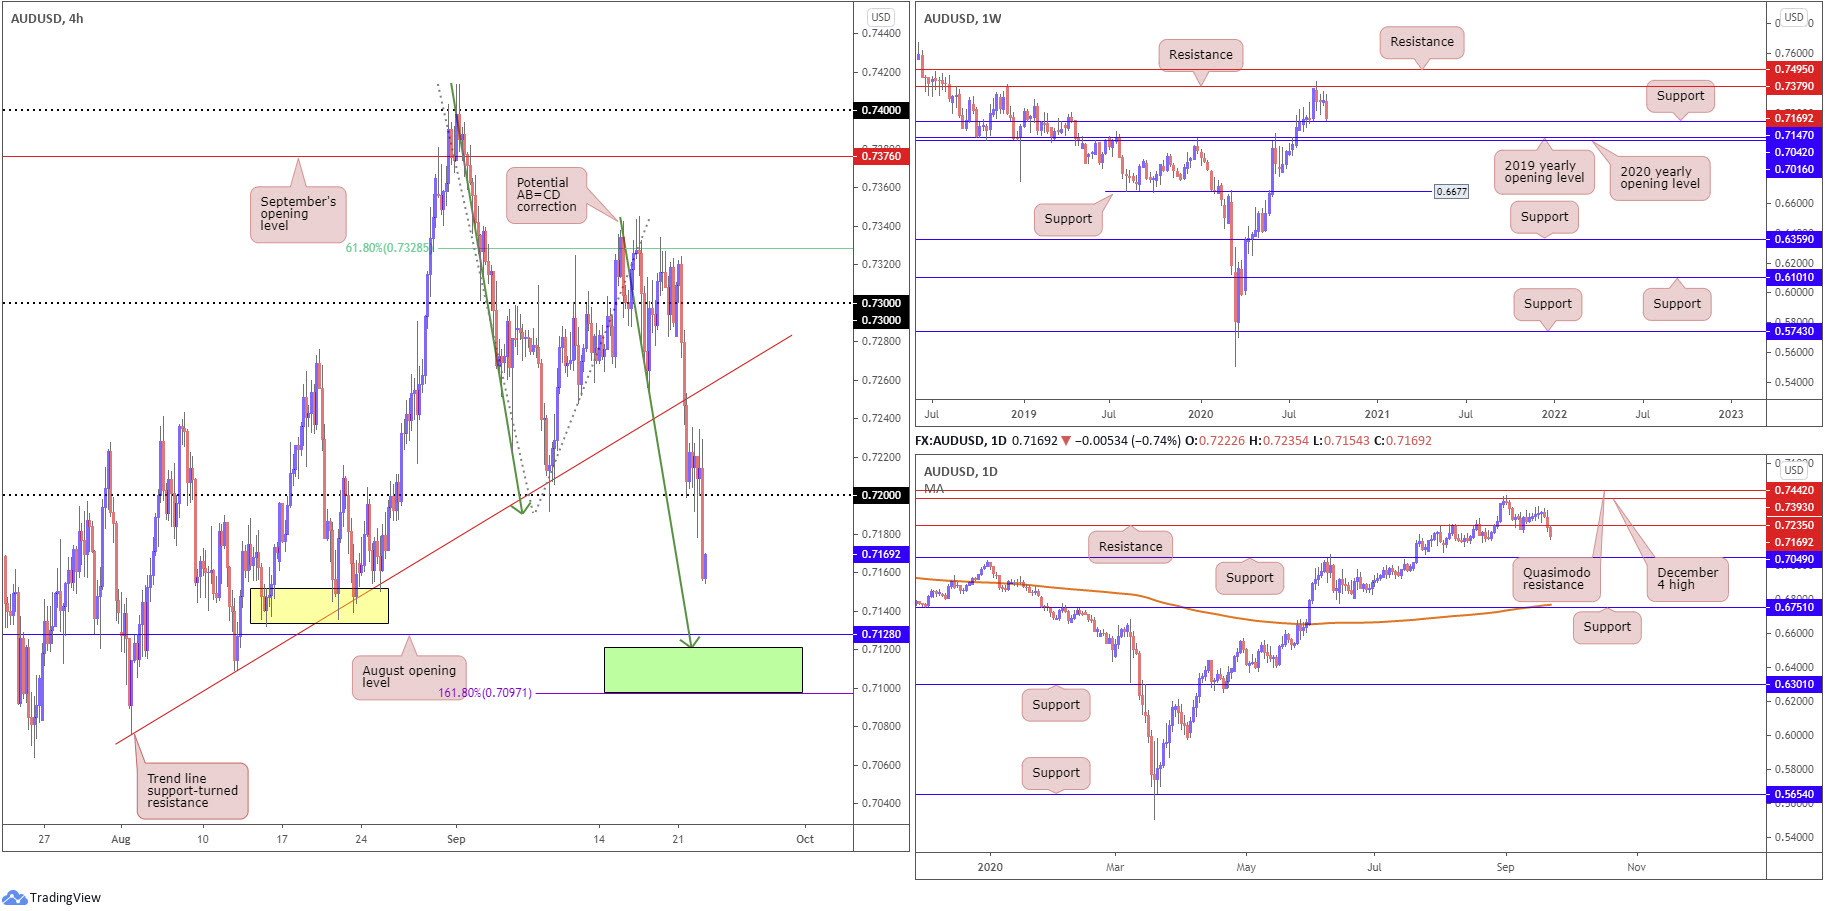
Recovery gains derived from 0.72 on the H4 were short-lived, unable to carry things past 0.7235. This, likely weighed by the DXY crossing above 93.00, guided H4 candles strongly beneath 0.72 to lows at 0.7154, throwing possible support around 0.7138ish in the firing range, closely followed by August’s opening value at 0.7128. Also of interest is a potential AB=CD correction (green arrows) at 0.7120 and a 1.618 BC projection at 0.7097 (green).
However, before reaching the aforementioned supports on the H4, traders are urged to pencil in the possibility of bullish activity emerging from weekly support at 0.7147. A break of this level on the weekly scale exposes the 2020 and 2019 yearly opening values at 0.7016 and 0.7042, respectively. On the daily timeframe, support at 0.7235 recently came under fire (now a serving resistance), with continued downside likely to target another layer of support at 0.7049.
Areas of consideration:
It was noted in Tuesday’s briefing to expect possible softness from buyers off 0.72, putting forward a bearish cue to approach weekly support at 0.7147, followed by 0.7140ish on the H4 timeframe.
Sellers still appear to have the advantage on the higher timeframes below 0.72 until weekly price crosses swords with the noted weekly support. A retest at 0.72, therefore would be an interesting scenario for sellers.
Given how close weekly support sits north of August’s opening level on the H4 at 0.7128 and the AB=CD correction (green arrows) at 0.7120/1.618 BC projection at 0.7097 (green), a spike through weekly support to test the H4 supports could be on the menu before buyers step in.
USD/JPY:
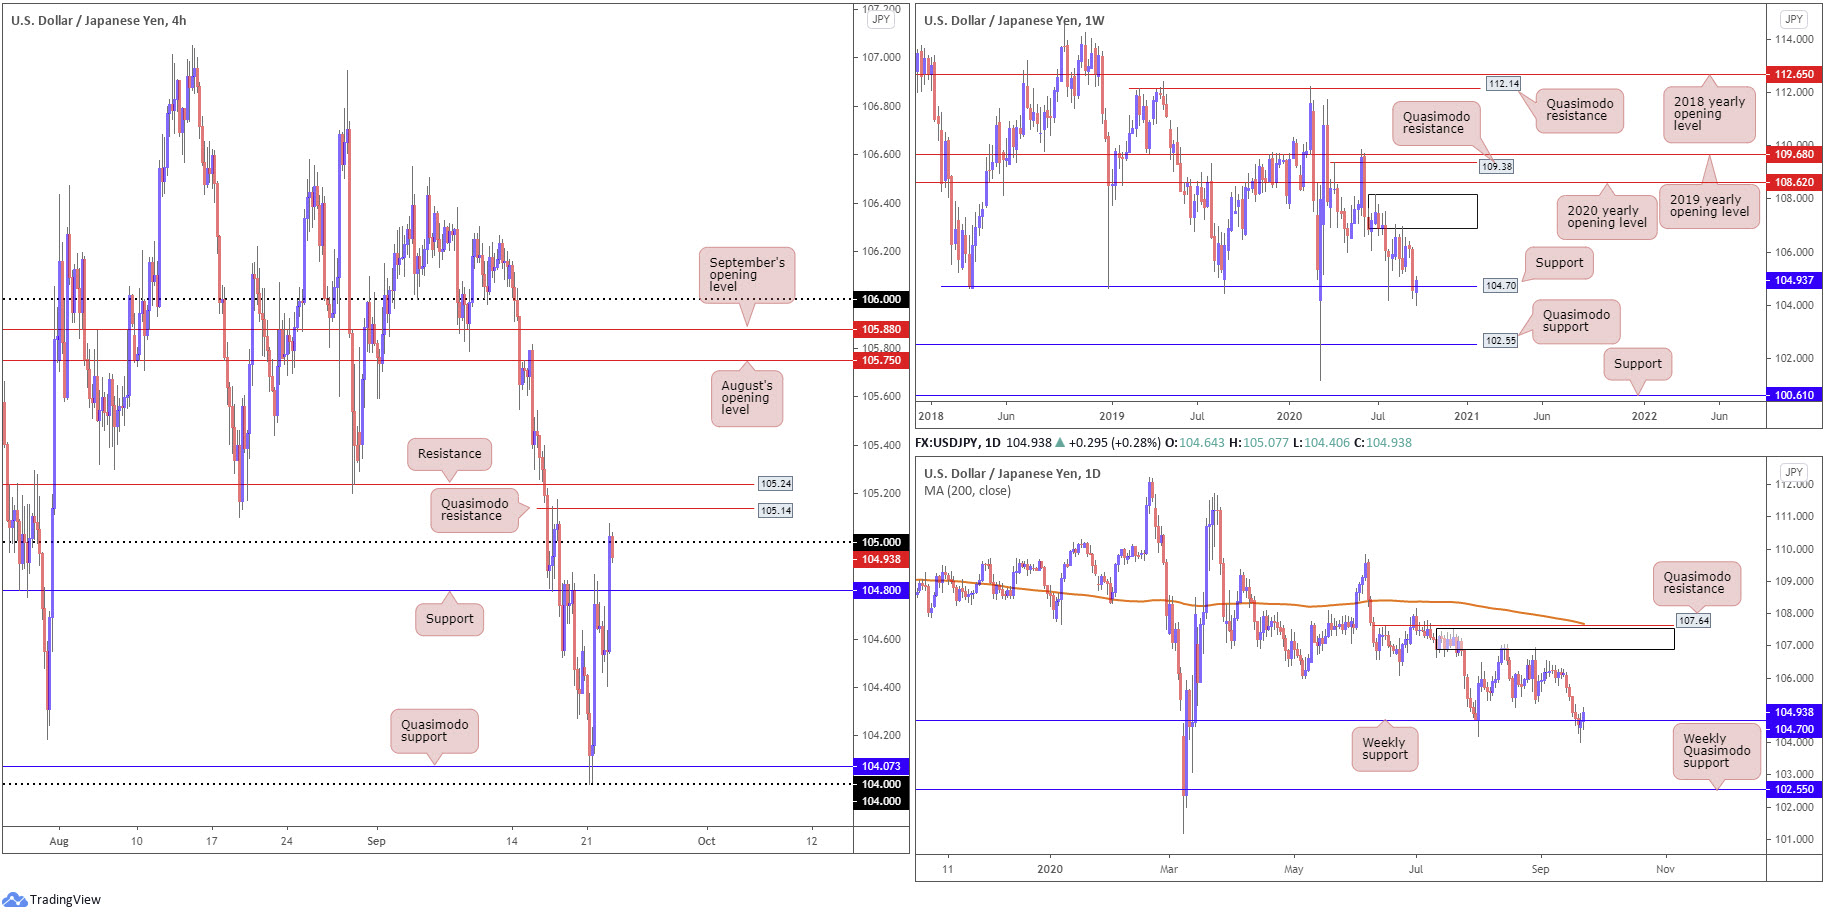
The US dollar continued to claw back lost ground against the Japanese yen Tuesday, recording a second consecutive daily gain. Reinforced by the DXY approaching 94.00 and major US equity benchmarks registering gains, H4 resistance at 104.80 was engulfed, allowing candles to bump into 105. Quasimodo resistance at 105.14 is seen as the next possible ceiling above here, followed by another resistance close by at 105.24.
As highlighted in recent analysis, the higher timeframes reveal the unit attempting to regain footing above weekly support at 104.70.
Areas of consideration:
Outlook mostly unchanged.
In order to climb above weekly support at 104.70 and make any progress, H4 resistances at 105, 105.14 and 105.24 must be cleared. Overthrowing H4 resistance at 105.24, therefore, may trigger bullish themes to take the currency pair up to at least August’s opening level at 105.75, with a break throwing September’s opening level at 105.88 into the mix.
Should H4 hold resistance at 105, this is a sign weekly buyers unlikely have enough gas in the tank to take things higher. In this case, bearish scenarios could be found to drive price back through H4 support at 104.80 towards the 104ish region.
USD/CAD:
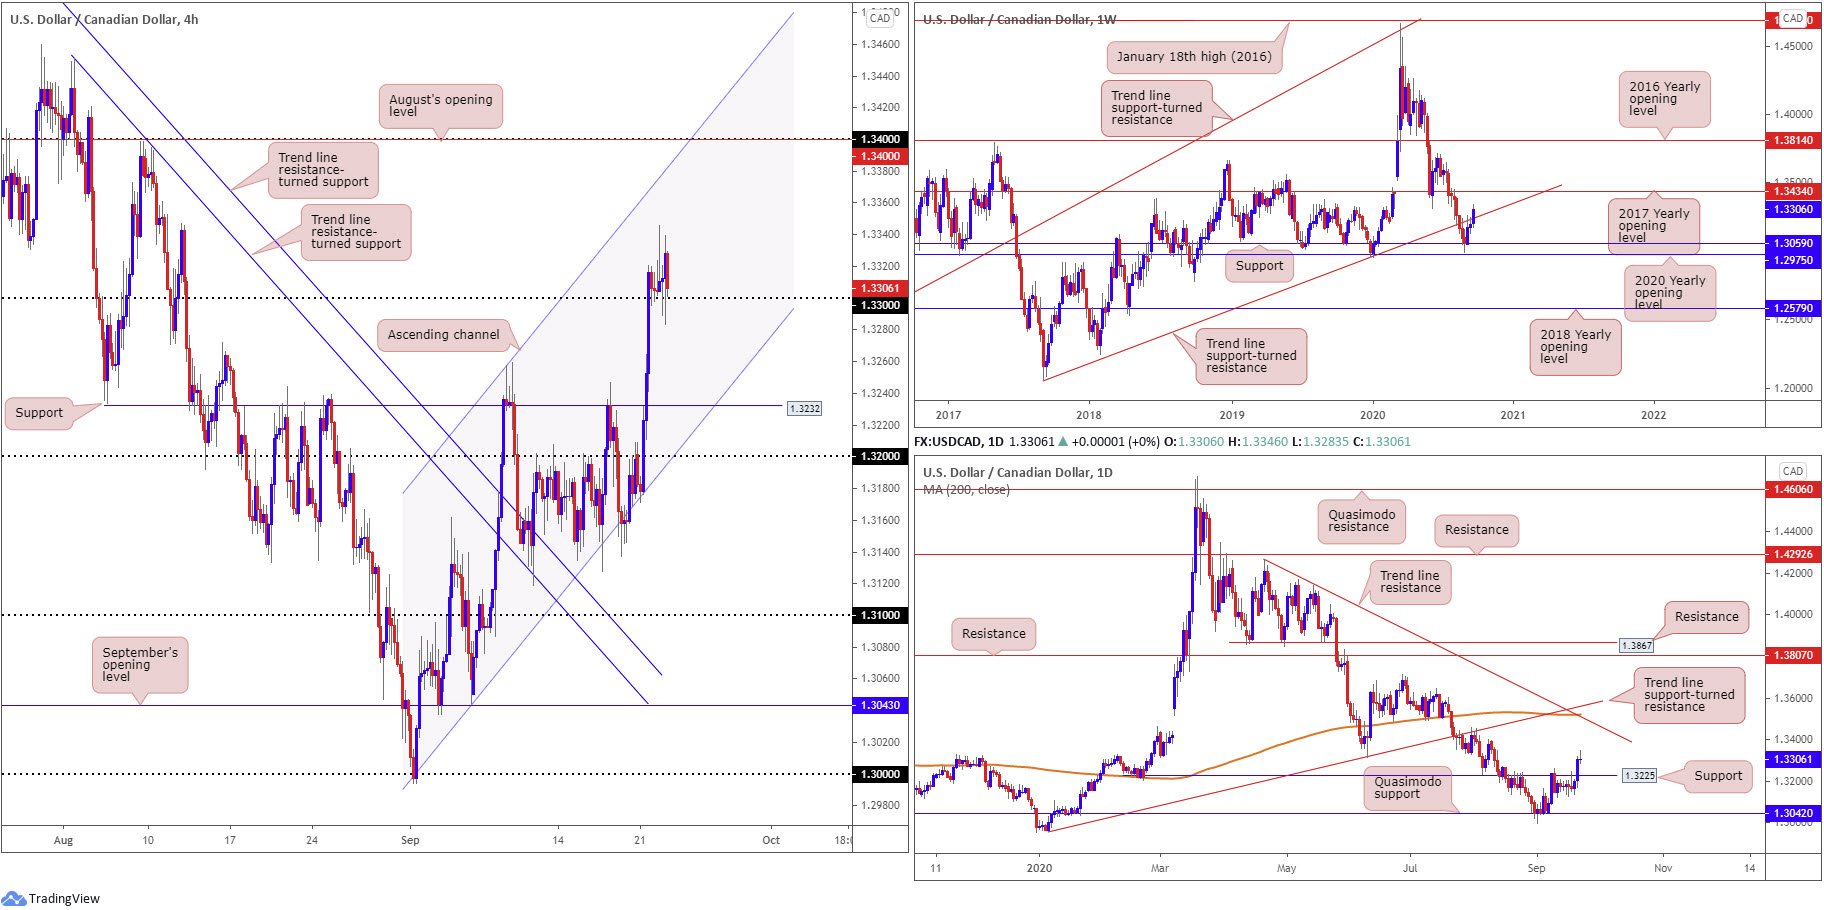
Tuesday had USD/CAD advance to six-week tops around 1.3346, aided on the back of technical buying from the 1.33 retest on the H4 timeframe, as well as the DXY rallying to 94.00. Further buying from here could advance as far north as the 1.34 handle/August’s opening level, plotted close by channel resistance, taken from the high 1.3257.
From the higher timeframes, research notes the following:
Following a stronger-than-expected recovery off support at 1.3059, pinned just north of the 2020 yearly opening level at 1.2975 on the weekly timeframe, weekly price has taken on trend line support-turned resistance, taken from the low 1.2061. Continued upside highlights the 2017 yearly opening value at 1.3434 as possible resistance.
A closer reading of price action on the daily timeframe reveals resistance at 1.3225 gave way in recent trading. It might also be worth noting that Tuesday finished in the shape of a shooting star candle pattern (bearish signal). In terms of resistance beyond 1.3225, we do not see much to hang our hat on until crossing swords with trend line resistance, etched from the high 1.4265, which happens to align closely with the 200-day SMA (orange – 1.3520). Also in close view is trend line support-turned resistance, taken from the low 1.2957. However, before reaching the said daily levels, we must contend with weekly resistance around 1.3434.
Areas of consideration:
Although buyers appear to lack passion off 1.33 at the moment, the retest of this level is notable knowing we have room for buyers to stretch their legs on the higher timeframes to at least weekly resistance placed at 1.3434 (the 2017 yearly opening level).
Conservative traders are likely to seek additional confirmation, perhaps in the form of a H4 bullish candlestick pattern, before pulling the trigger, targeting the aforementioned resistances highlighted in bold.
USD/CHF:
Broad USD strength hoisted USD/CHF to fresh weekly peaks at 0.9207 Tuesday, pencilling in a third consecutive daily gain.
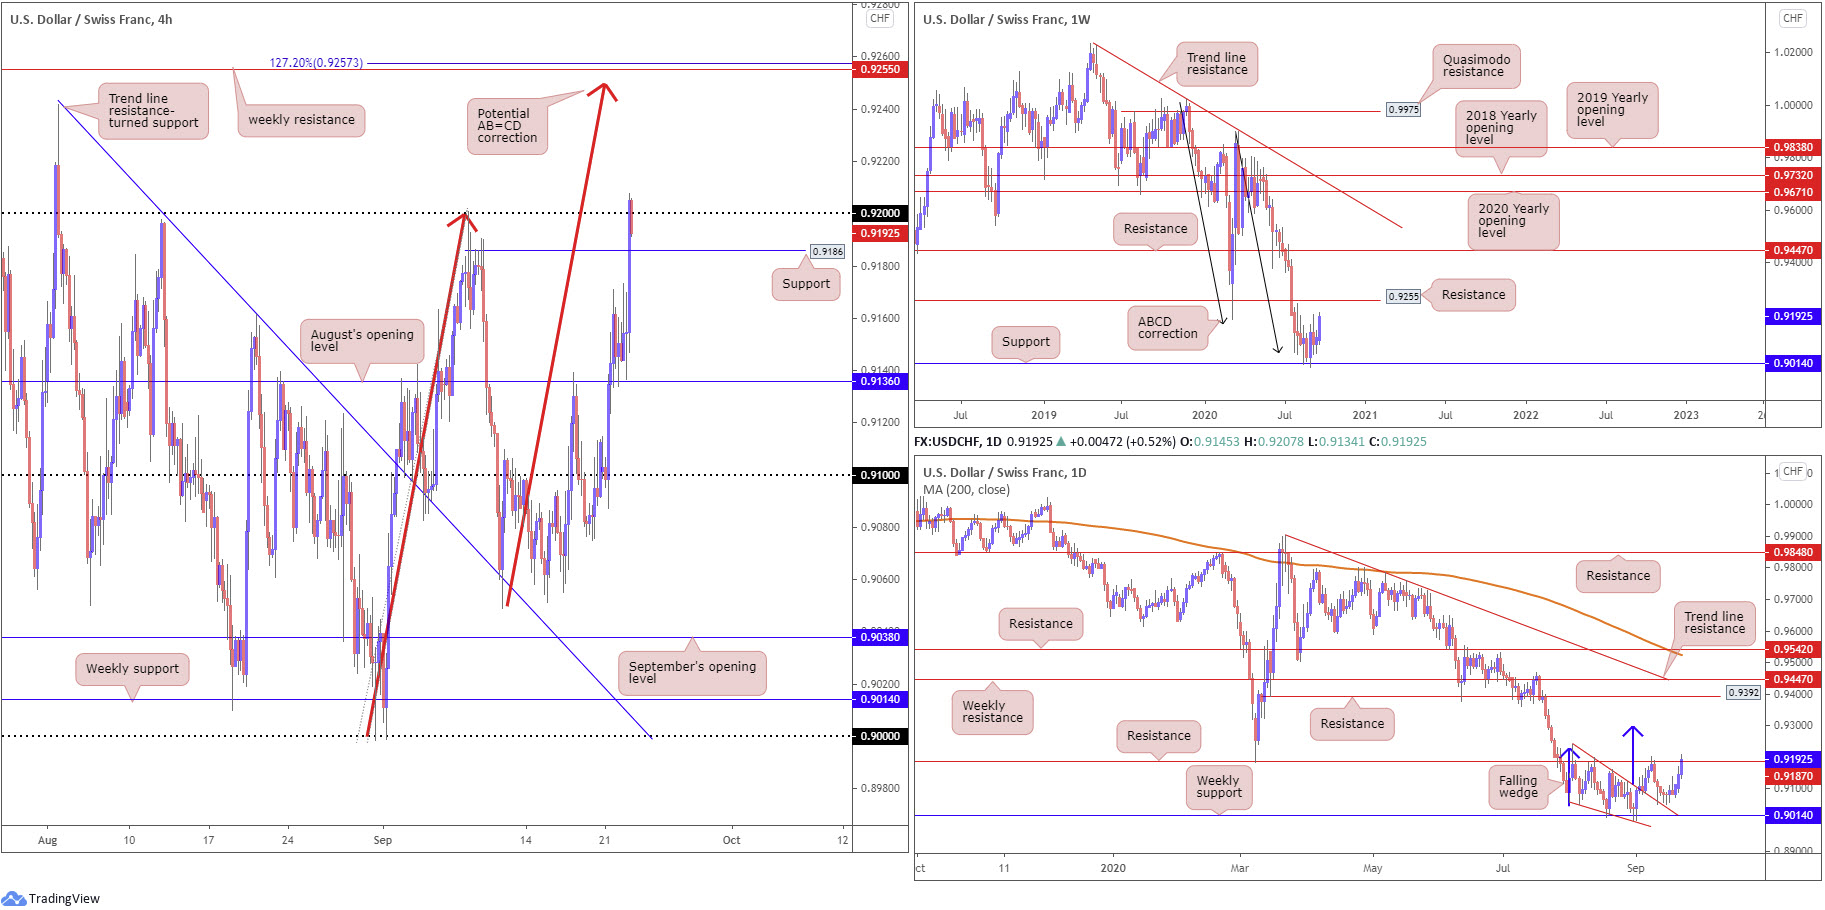
Technically, August’s opening value at 0.9136 supplied stable support yesterday, enough to see buyers take on Quasimodo resistance at 0.9186 (now a serving support) and test the 0.92 handle.
Movement on the weekly timeframe reveals buyers staging an approach to resistance at 0.9255 (a previous Quasimodo support level), following a recent bounce from support at 0.9014, potentially gleaning additional impetus from ABCD support at 0.9051 (black arrows).
The beginning of September observed the upper border of a falling wedge pattern (drawn from the high 0.9241 and a low of 0.9056) give way, consequently unlocking a bullish reversal signal. Resistance at 0.9187 swiftly put a lid on gains, however, directing moves to just north of the falling wedge. Since then, we’ve seen buyers regain consciousness with Tuesday marginally breaking the aforementioned resistance level. Weekly resistance at 0.9255 is next on tap, followed by the daily falling wedge take-profit target (blue arrows) at 0.9297.
Areas of consideration:
A decisive H4 close above 0.92 today could call for further buying (conservative traders will likely want to see a retest of the round number form before committing), targeting weekly resistance at 0.9255, which happens to merge closely with a H4 AB=CD (red arrows) completion at 0.9249 and 127.2% Fibonacci extension point at 0.9257.
Dow Jones Industrial Average:
US equities rallied across the board Tuesday, with the Dow Jones Industrial Average advancing 140.48 points, or 0.52%; the S&P 500 rallied 34.51 points, or 1.05% and the Nasdaq traded higher by 184.84 points, or 1.71%.
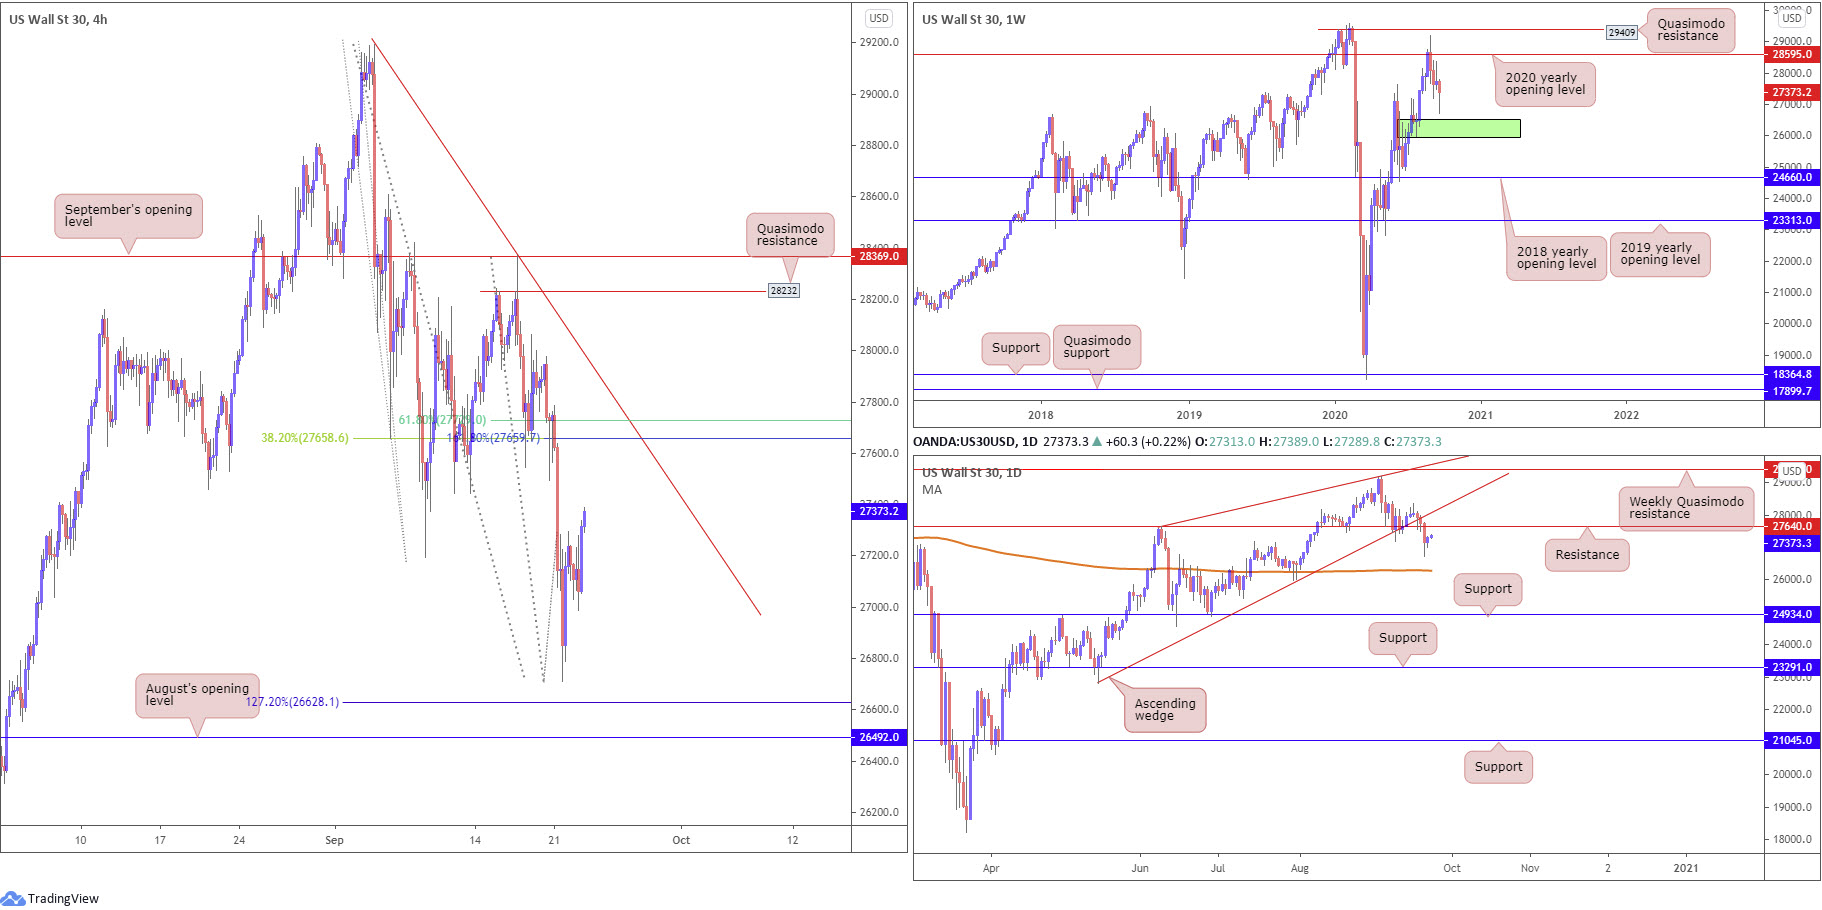
Technically, from the weekly timeframe, the unit continues to languish south of the 2020 yearly opening value at 28595 (sited just under Quasimodo resistance at 29409). Additional bearish sentiment advertises demand (green) at 25916-26523, an area active buyers may try and defend.
Recent trading saw price action elbow through the lower limit of an ascending wedge, taken from the low 22803 and support from 27640. This potentially sets the stage for a move to the 200-day SMA (orange – 26285), followed by a possible run to support priced in at 24934.
Across the page on the H4 timeframe, we can see the recent recovery ahead of a 127.2% Fibonacci extension point at 26628 has positioned price movement within striking distance of resistance around 27689 (made up of a 61.8% Fibonacci retracement ratio at 27727, a 38.2% Fibonacci retracement ratio at 27658, a 161.8% Fibonacci extension point at 27659 and trend line resistance [29193]).
Areas of consideration:
The weekly and daily timeframes point to the possibility of additional losses. Should H4 cross swords with trend line resistance and Fibonacci studies, this, given the situation unfolding on the higher timeframes, could be a location we see sellers make an appearance. What’s also attractive is daily resistance at 27640 residing close by.
XAU/USD (GOLD):
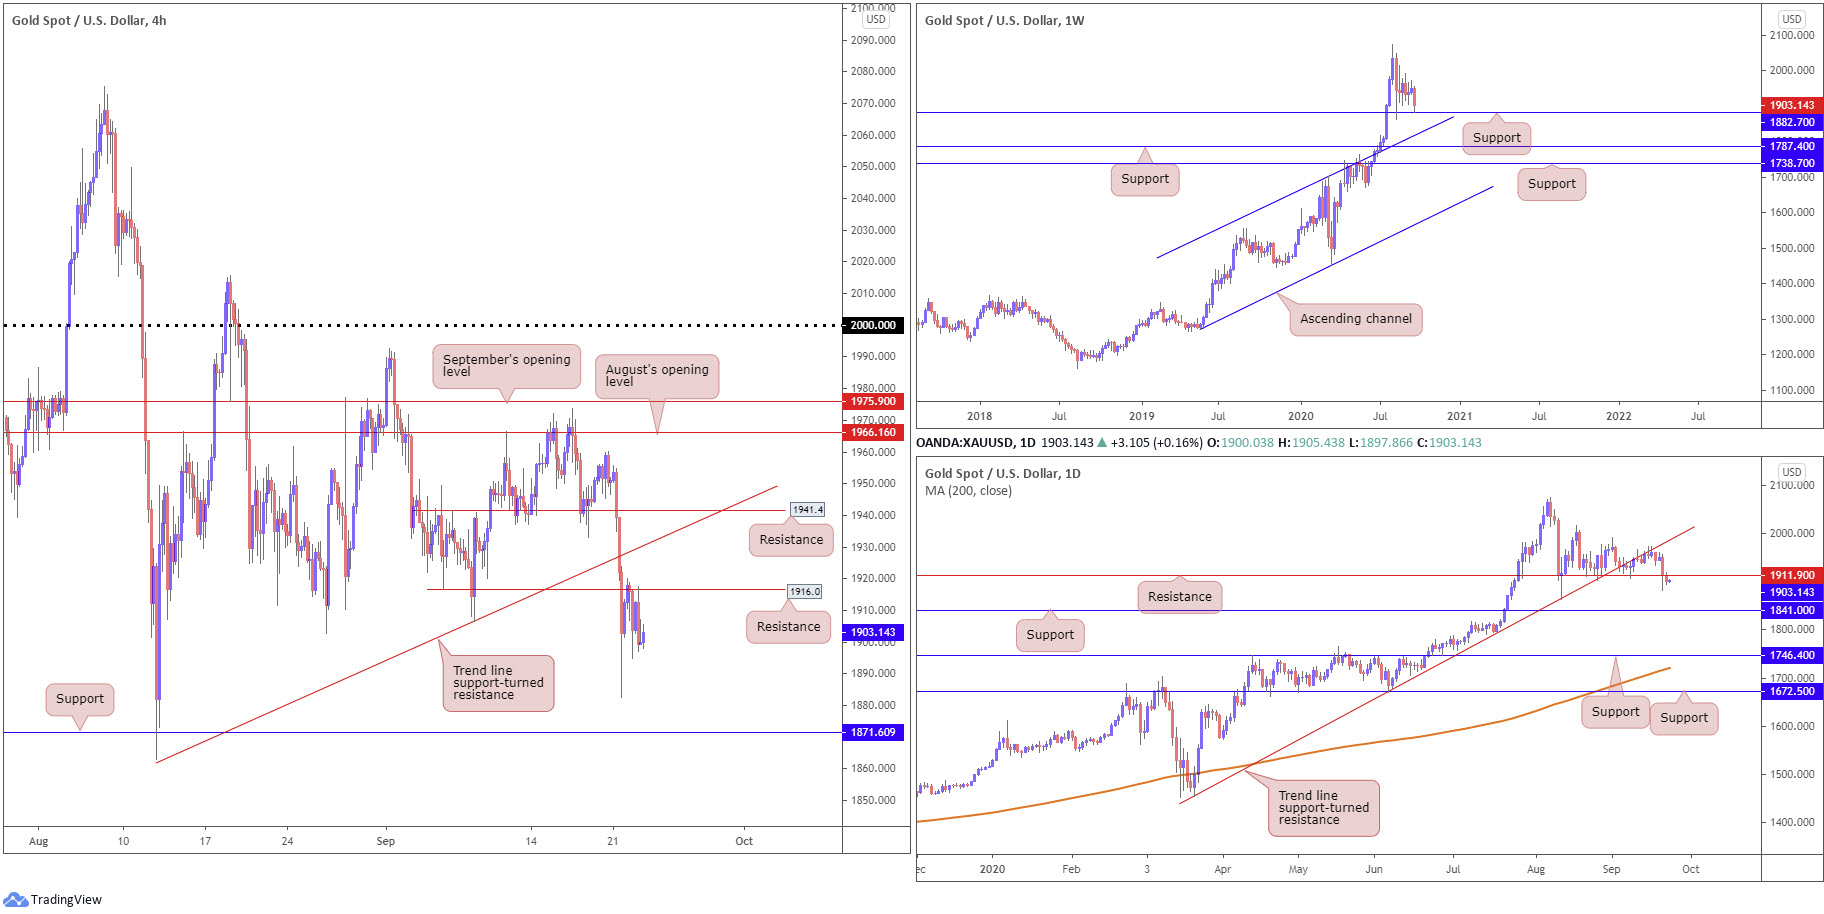
Support at $1,882 recently made its way into the spotlight on the weekly timeframe. With the current trend trekking north since 2016, $1,882 may be enough to encourage additional buying, with most targeting all-time peaks at $2,075 as the initial point. Failure to hold gains could see channel resistance-turned support, etched from the high $1,703, enter view.
Support from $1,911 was recently engulfed (now serving as resistance) after last week’s action gripped trend line support-turned resistance, taken from the low $1,455, consequently shining focus to support coming in at $1,841.
On the H4 timeframe, support can be seen around $1,871, while resistance at $1,916 is in motion (a previous Quasimodo support), with price action recently establishing a bearish engulfing candle. Breaking above here throws trend line support-turned resistance in the fight, extended from the low $1862, closely followed by resistance at $1,941.
Areas of consideration:
Although we are seen testing weekly support at $1,882, daily price tunnelled through support at $1,911, suggesting some conflict.
As a result of the above, H4 resistance at $1,916 (and nearby daily resistance at $1,911) may continue to serve this market, with sellers targeting H4 support at $1,871, followed by daily support at $1,841.
The accuracy, completeness and timeliness of the information contained on this site cannot be guaranteed. IC Markets does not warranty, guarantee or make any representations, or assume any liability regarding financial results based on the use of the information in the site.
News, views, opinions, recommendations and other information obtained from sources outside of www.icmarkets.com.au, used in this site are believed to be reliable, but we cannot guarantee their accuracy or completeness. All such information is subject to change at any time without notice. IC Markets assumes no responsibility for the content of any linked site.
The fact that such links may exist does not indicate approval or endorsement of any material contained on any linked site. IC Markets is not liable for any harm caused by the transmission, through accessing the services or information on this site, of a computer virus, or other computer code or programming device that might be used to access, delete, damage, disable, disrupt or otherwise impede in any manner, the operation of the site or of any user’s software, hardware, data or property.


