
EUR/USD:
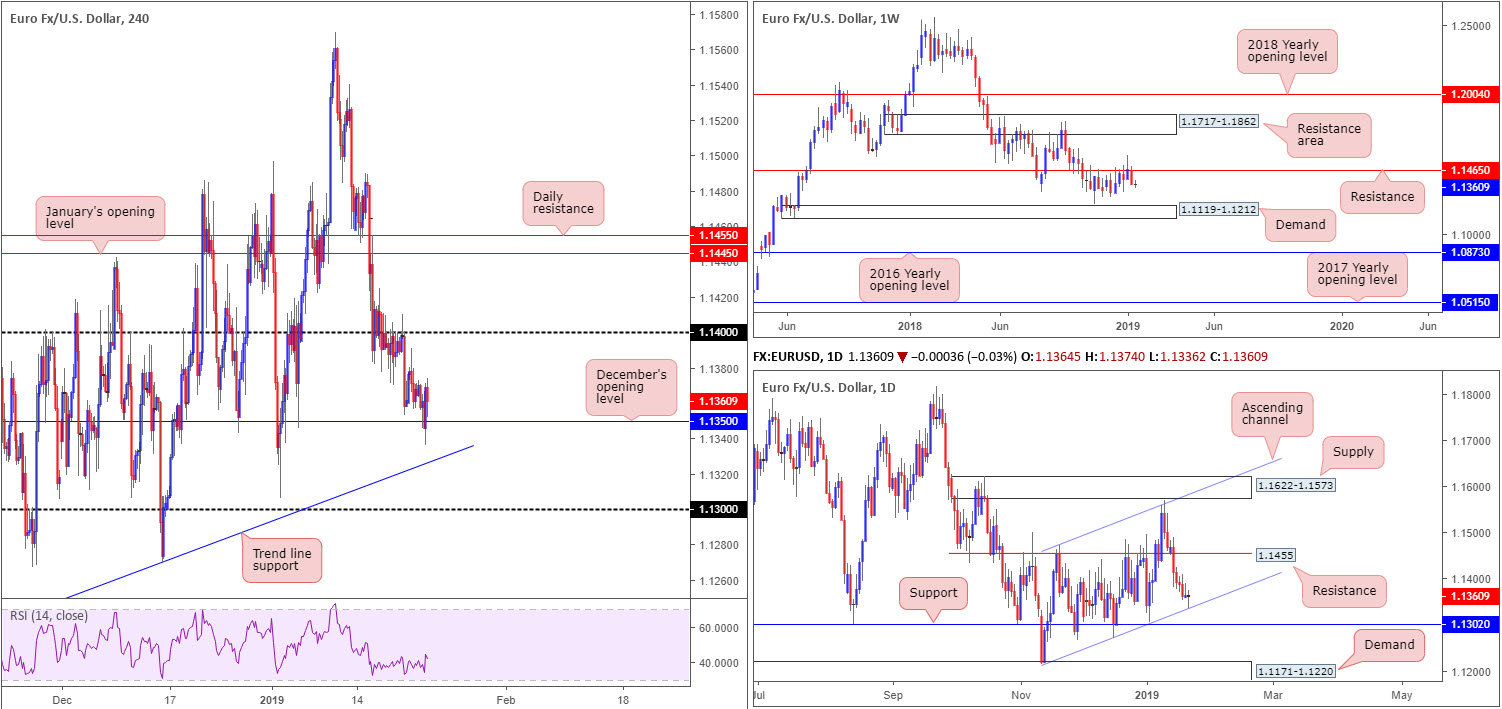
By all counts, the single currency finished Tuesday relatively unchanged, ranging no more than 40 pips between 1.1374/1.1336.
On the data front, the ZEW Indicator of Economic Sentiment for Germany recorded an increase of 2.5 points in January 2019, and now stands at minus 15.0 points. Despite this increase, the indicator is still below the long-term average of 22.4 points. The release generated a round of buying on the EUR/USD, though was short lived as price failed to push much beyond 1.1367.
In terms of the technical picture, the H4 candles, as anticipated (and highlighted in Tuesday’s briefing), whipsawed through orders at December’s opening level drawn from 1.1350 and shook hands (to the pip) with a daily ascending channel support (etched from the low 1.1216) before recovering ground to the upside. The day’s candle, as you can see, wrapped up in the shape of an indecision candle, albeit with a minor bullish twist to it (a longer buying tail).
On a wider perspective, though, weekly resistance at 1.1465 remains defensive. This possibly sets the stage for further selling towards weekly demand at 1.1119-1.1212 over the coming weeks.
Areas of consideration:
Although the weekly timeframe’s position suggests further downside could be on the cards this week, advancing and testing 1.14 on the H4 timeframe is not out of the question according to our technical studies.
With daily buyers involved off channel support (see above), December’s opening level at 1.1350 on the H4 timeframe has a healthy chance of remaining in the fold today as support. Overhead we see little in terms of resistance until we reach 1.14, meaning a long from 1.1350ish could be an option today should it be tested.
Given the threat of weekly selling, waiting for additional candlestick confirmation to form before pulling the trigger off 1.1350 is recommended. Not only will this identify bullish intent, it’ll also help pin down entry/stop levels which is handy around support levels.
Today’s data points: Limited.
GBP/USD:
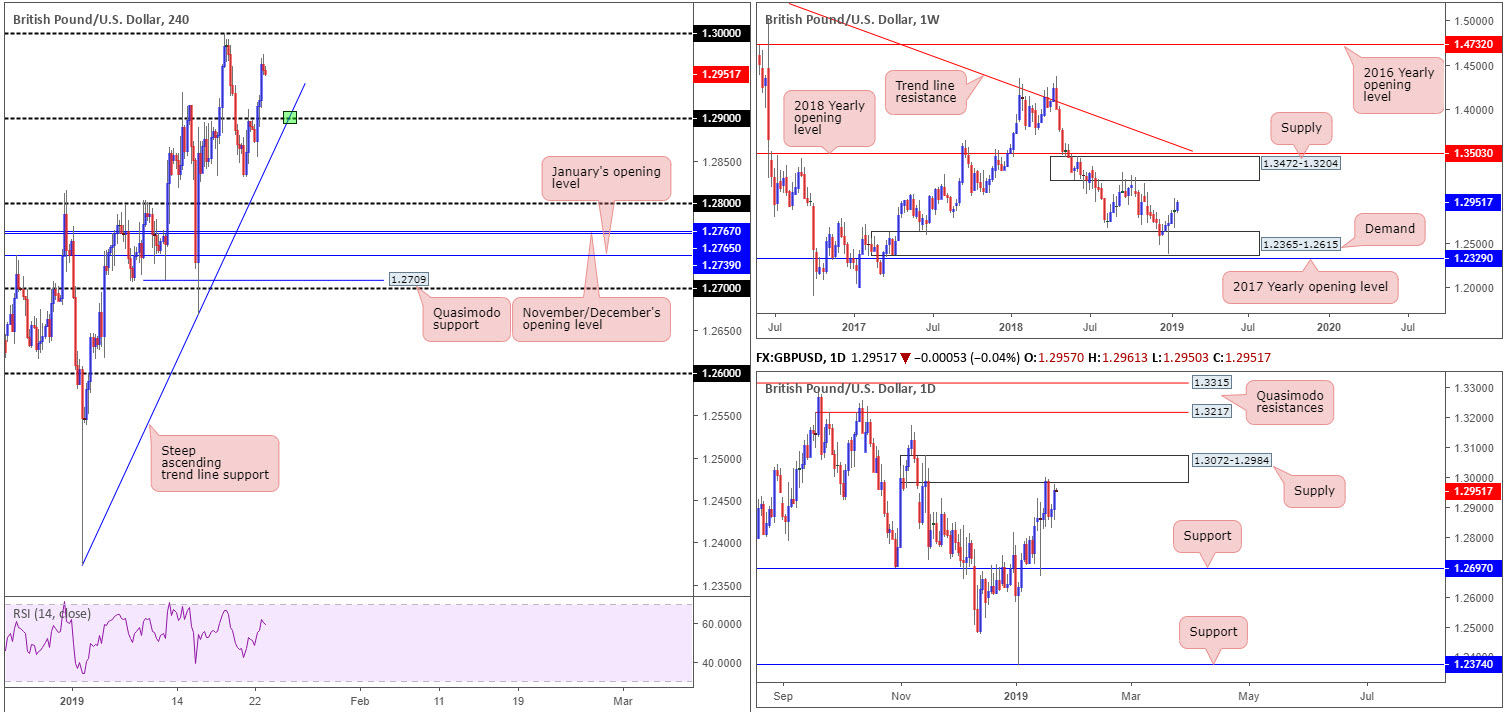
Optimistic UK employment figures delivered fresh impetus Tuesday, hauling cable above the 1.29 handle. Despite a brief retracement phase, retesting the top edge of 1.29 as support, sterling continued to reign supreme against its US counterpart, testing highs of 1.2975 on the day.
The next port of call on the H4 timeframe stands close by at 1.30. This key figure is a watched number in this market and almost certainly has a large number of orders waiting to be filled. Should the candles fail to reach this number today, though, a retest of 1.29 could be observed. Note there is also a steep ascending trend line support (extended from the low 1.2373) positioned nearby (green).
Drilling up a level to the daily timeframe, we can see the 1.30 figure is housed within the parapets of a supply zone at 1.3072-1.2984. Though the daily zone adds weight to 1.30 as a sell zone, weekly price is poised to continue pressing for higher ground until connecting with supply located at 1.3472-1.3204 – 200 pips beyond 1.30.
Areas of consideration:
Should the market pullback towards 1.29, particularly at the point the H4 trend line support merges with the number (highlighted above), a bounce from this angle is likely. The research team, however, urges traders to consider this number valid based on additional confirmation only, as round numbers are prone to stop runs.
Continued buying from current price, on the other hand, has 1.30 in its clutch. A firm rejection off this number by way of a H4 bearish candlestick formation (entry/stop parameters can be defined according to this pattern) would, given the number is positioned within daily supply, be enough evidence to consider shorting this market, targeting either 1.29 or the noted H4 trend line support, whichever comes first.
A decisive H4 close above 1.30, however, signals bullish intent, placing a question mark on the current daily supply and, at the same time, validating bullish control on the weekly timeframe. In this case, traders have the option of either entering long on the close of the breakout candle (and placing stops beneath its tail) or waiting to see if the unit retests 1.30 as support in the form of a H4 bullish candle pattern (entry and stop levels can be defined according to this structure), targeting H4 Quasimodo resistance at 1.3047 as the initial take-profit zone (not seen on the screen). The latter is considered the more conservative approach.
Today’s data points: MPC Member Broadbent Speaks.
AUD/USD:
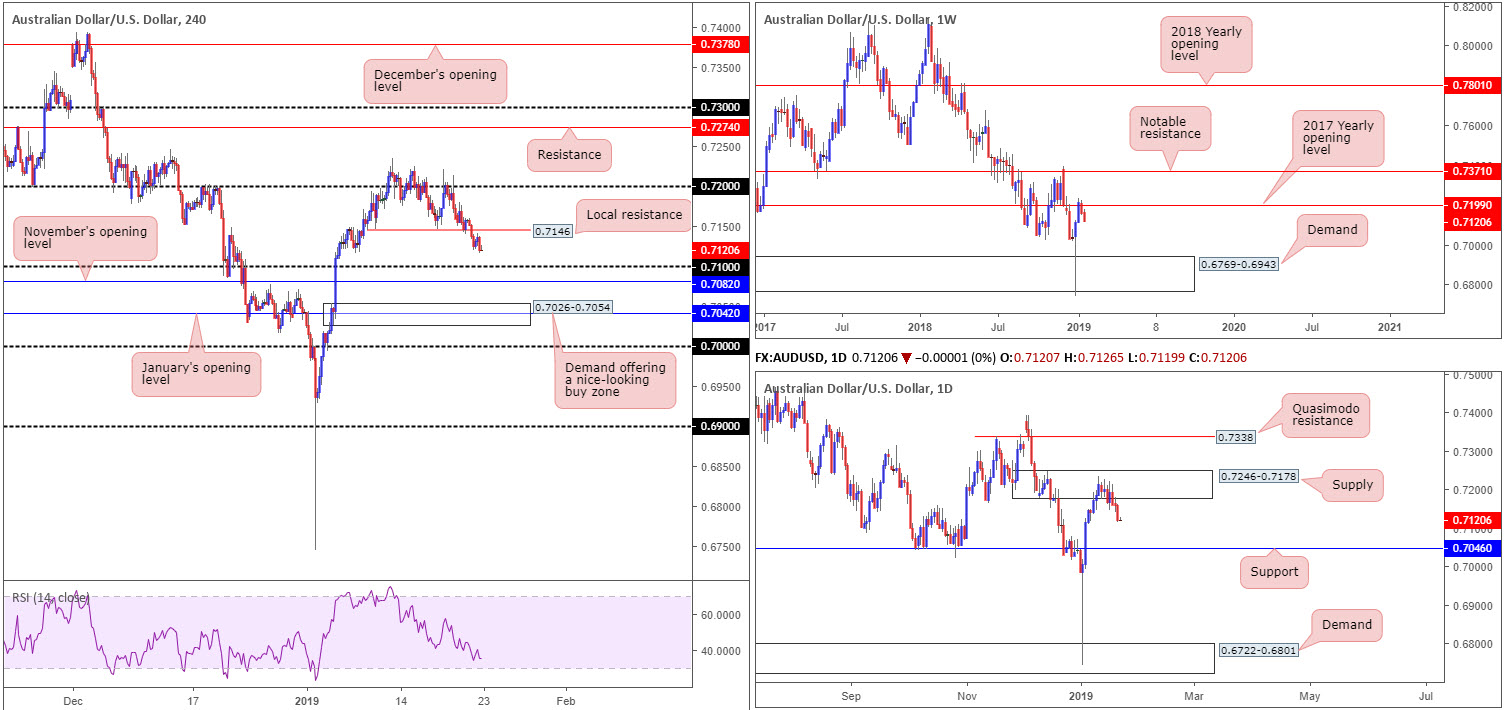
The Australian dollar remained on the backfoot Tuesday, down 0.52% vs. its US counterpart, as the US dollar index hugged daily gains above 96.30.
Local H4 support at 0.7146, as you can see, was violated in the early hours of trade. With this level now likely offering intraday traders a ceiling, this exposes the 0.71 handle as viable support, shadowed closely by November’s opening level at 0.7082 and then eventually January’s opening level at 0.7042.
From the top of the pile, however, we can see weekly flow pressing for lower ground from its 2017 yearly opening level at 0.7199. Further selling from here has demand plotted at 0.6769-0.6943 to target. Alongside weekly structure, daily flow is seen shielding supply posted at 0.7246-0.7178, with the next port of call from this area visible at support drawn from 0.7046.
Areas of consideration:
With 0.71 located a little more than 20 pips away at current price, selling this market, despite the bigger picture suggesting further downside could be in store, is precarious.
As highlighted in Tuesday’s briefing, the research team notes possible buying opportunities around January’s opening level mentioned above at 0.7042. This number, as you can probably see, merges nicely with support at 0.7046 on the daily timeframe, therefore providing a relatively stable platform to consider longs from should we reach this low. What’s also nice about this region is the merging H4 demand area seen at 0.7026-0.7054, offering traders limits to base an entry and stop.
Despite the confluence surrounding 0.7046ish, traders are urged to still keep weekly positioning in mind: selling off from resistance with plenty of room to explore lower grounds.
Today’s data points: Limited.
USD/JPY:
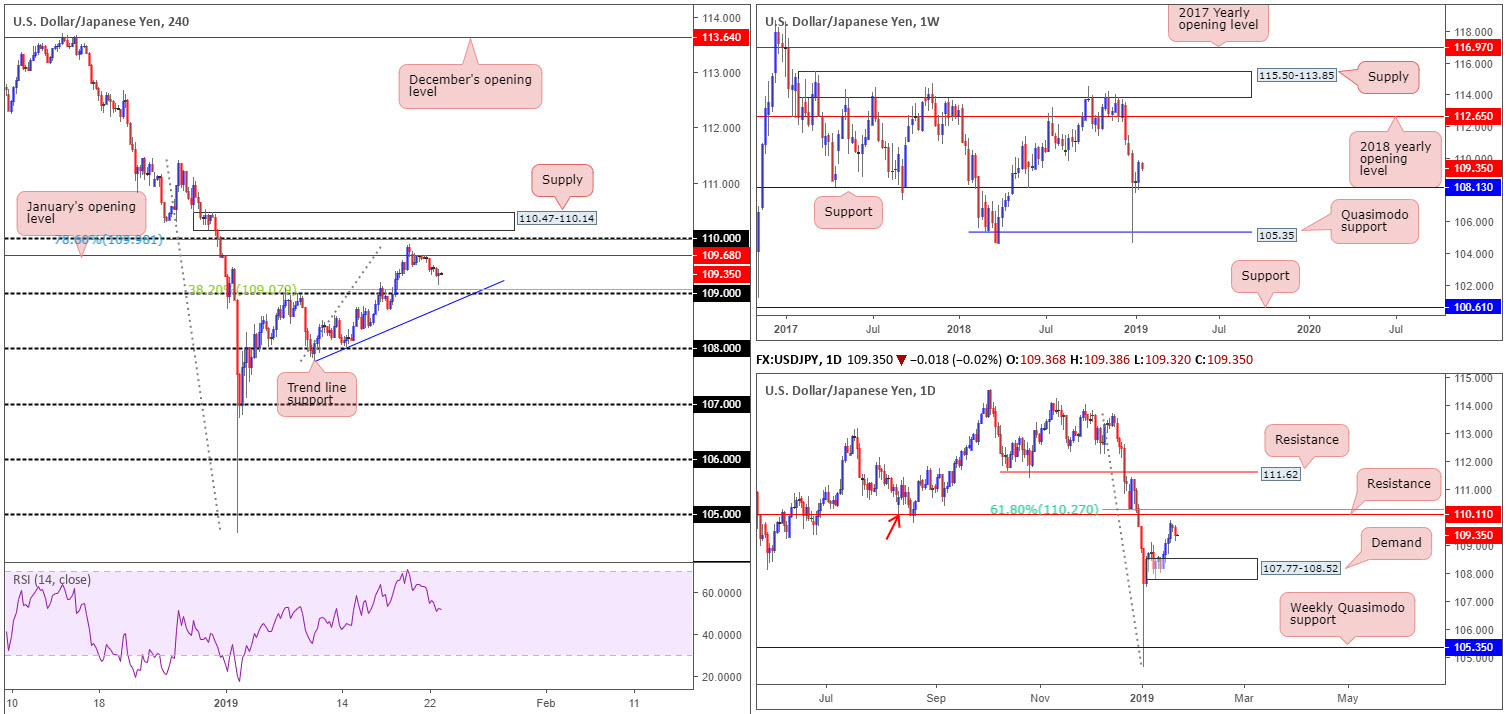
Following Monday’s somewhat drifting movement, the pair met with fresh supply Tuesday, pulling H4 price action lower from January’s opening level primed at 109.68 to session lows of 109.14.
The 109 handle located on the H4 timeframe is now likely on the hit list for many traders, having seen how muscularly the base held as resistance on Jan 8/9. The research team also notes a local trend line support (extended from the low 107.77) and a 38.2% Fibonacci support value at 109.07 reinforcing the psychological level.
The technical picture on the weekly timeframe visibly emphasises a bullish tone. Buyers recently found a floor off support priced in at 108.13, with potential, according to overhead structure, of further buying being seen as far north as the 2018 yearly opening level at 112.65. Contrary to weekly levels, daily price action is seen paring gains ahead of resistance coming in at 110.10 that’s trailed closely by a 61.8% Fibonacci resistance value at 110.27. 110.10 is essentially a Quasimodo support-turned resistance (red arrow).
Areas of consideration:
The 109 handle, in light of its local confluence on the H4 timeframe, is worthy of attention for a bounce today, though the research team urges traders to consider waiting for additional candle confirmation to form before pulling the trigger due to the threat of a fakeout (common viewing at round numbers).
Apart from the 109 handle, eyes also remain on the H4 supply positioned at 110.47-110.14. A push above 110 will not only trip stop-loss orders from traders attempting to fade 110, which, when filled, will become buy orders to sell in to, breakout buyers will also likely attempt to join the movement. This offer of liquidity to sell to, coupled with daily resistance seen plotted at 110.10, is likely enough to draw in attention and bring price action lower.
Traders who feel the need to trade the noted H4 supply based on candle confirmation, waiting for a bearish formation to materialize will certainly add weight to a possible rotation lower. Traders who believe the H4 supply and daily resistance is enough evidence to draw sellers’ attention will likely enter short at 110.14 with stop-loss orders planted just north of 110.47.
Once, or indeed if, the H4 candles reclaim 109.68 to the downside out of 110.47-110.14, traders can then think about reducing risk to breakeven and taking partial profits off the table.
Today’s data points: BoJ Outlook Report, Monetary Policy Statement, Policy Rate and Press Conference.
USD/CAD:
The Canadian dollar is Tuesday’s G10 underperformer, amid a decline in oil, the US dollar index preserving strength above the 96.30 mark and lower-than-expected Canadian wholesale sales and manufacturing sales numbers.
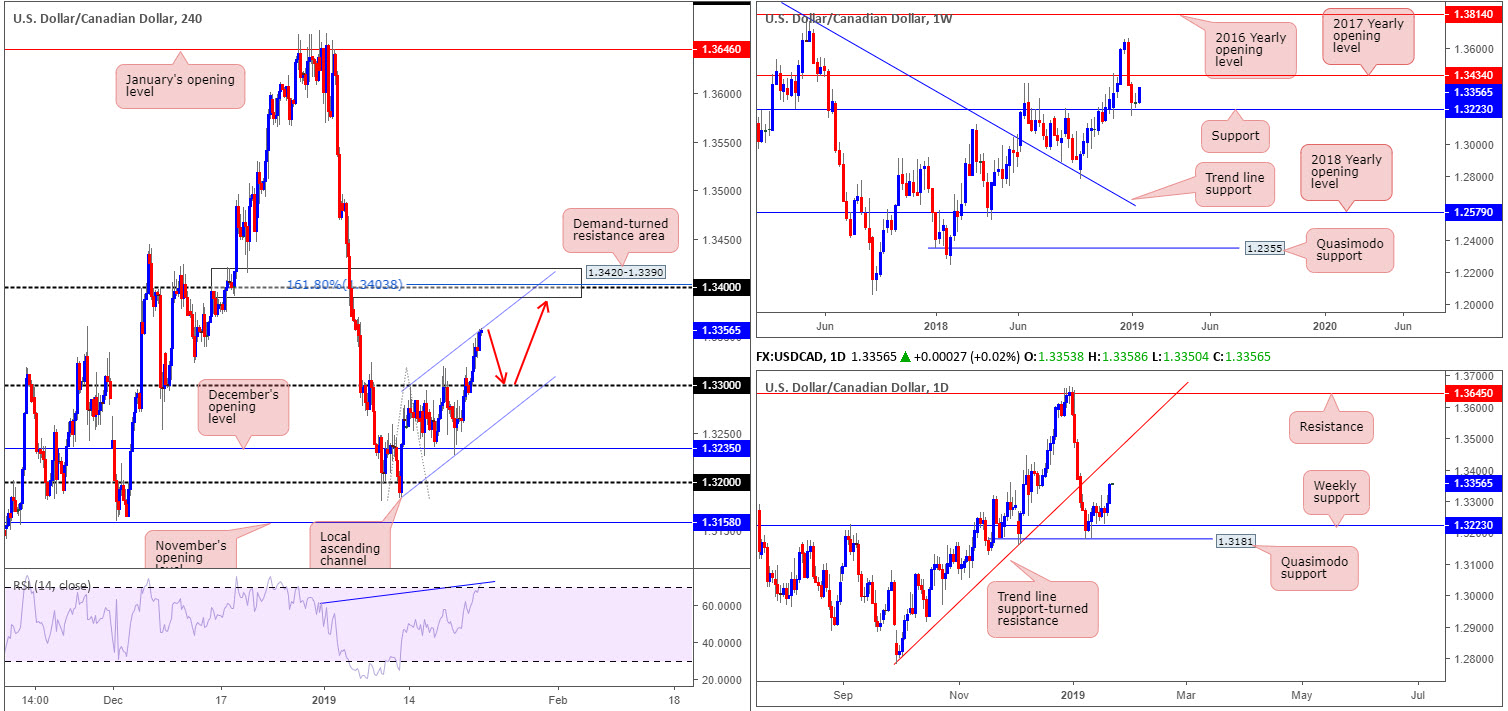
Since Jan 11, as highlighted in Tuesday’s briefing, the H4 candles have been compressing within an ascending channel formation (1.3183/1.3318). With the recent bout of buying observed, which happened to clean orders from 1.33, the unit is seen testing the H4 channel resistance, as we write. Beyond this structure, a demand-turned resistance area is present at 1.3420-1.3390, which happens to hold within it the round number 1.34 and a 161.8% Fibonacci extension point at 1.3403. In addition to this, the H4 RSI indicator recently entered overbought territory alongside a divergence reading (blue line).
Against the backdrop of H4 flow, the bigger picture reveals weekly support holding firm at 1.3223, with the current candle poised to cross swords with the 2017 yearly opening level at 1.3434. Closer analysis on the daily timeframe reveals the unit shook hands with a daily Quasimodo support at 1.3181 in recent trade. This level, as you can see, is situated just south of the current weekly support level. As long as the buyers continue to defend the said supports, the next port of call to the upside from here falls in around trend line support-turned resistance (extended from the low 1.2782), though it appears weekly resistance may enter the fray beforehand.
Areas of consideration:
As both weekly and daily structure suggest buyers govern movement at the moment, a retest off 1.33 is likely of interest to many traders today (red arrows), targeting the H4 supply zone mentioned above at 1.3420-1.3390 as an initial take-profit zone.
As mentioned in previous reports, stop runs through round numbers are common viewing, therefore, waiting for additional bullish candlestick confirmation to form (entry/stop parameters can be defined according to this pattern) off 1.33 before pressing the buy button is recommended.
Today’s data points: Canadian Core Retail Sales m/m and Retail Sales m/m.
USD/CHF:
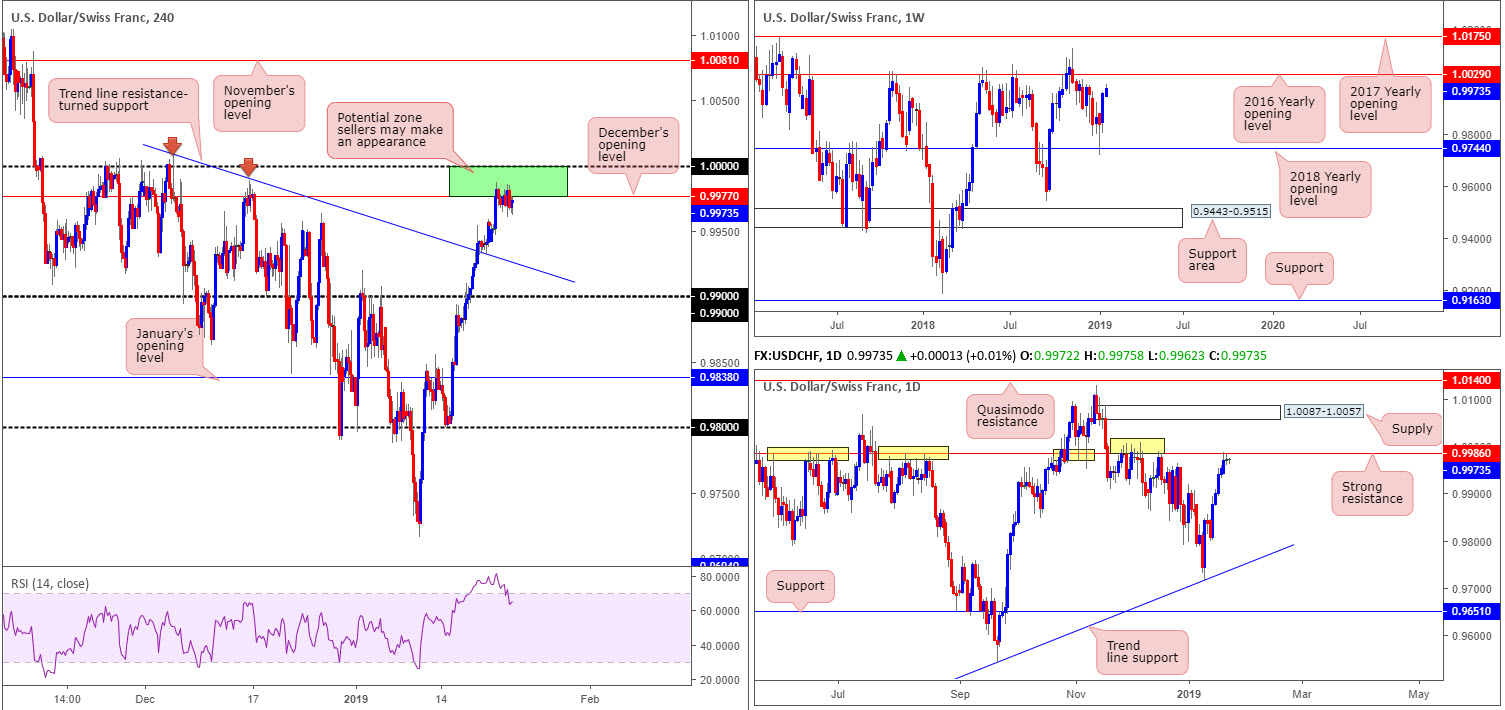
Although the USD/CHF concluded Tuesday’s segment mildly in the green, consequently registering its sixth consecutive daily gain, movement was lackluster ranging no more than 25 pips on the day.
For folks who read Tuesday’s briefing you may recall the piece highlighted the 1.0000 (parity) level and December’s opening level on the H4 timeframe at 0.9977 (green) as an area potential sellers may reside. What is notable from a technical perspective here is the daily resistance at 0.9986 which was recently pulled into the mix. Note 0.9986 boasts strong historical significance (yellow). The only grumble, of course, is the fact weekly price shows room to press as far north as its 2016 yearly opening level at 1.0029, therefore threatening the sell zone.
Despite weekly price eyeing higher levels, we can see sellers are putting up a fight out of 1.0000/0.9977. In the event a selloff is observed, the H4 trend line resistance-turned support (taken from the high 1.0008) is likely the next downside hurdle in the firing range.
Areas of consideration:
To prove serious sellers reside within 1.0000/0.9977, traders have the option of waiting for a bearish candlestick signal. Not only will this help motion bearish intent, it also provides entry/stop levels to work with.
Should we push through 1.0000, however, keep eyes on 1.0029 on the weekly timeframe for a potential sell – just look at the number of times the level held price lower in the past.
Today’s data points: Limited.
Dow Jones Industrial Average:
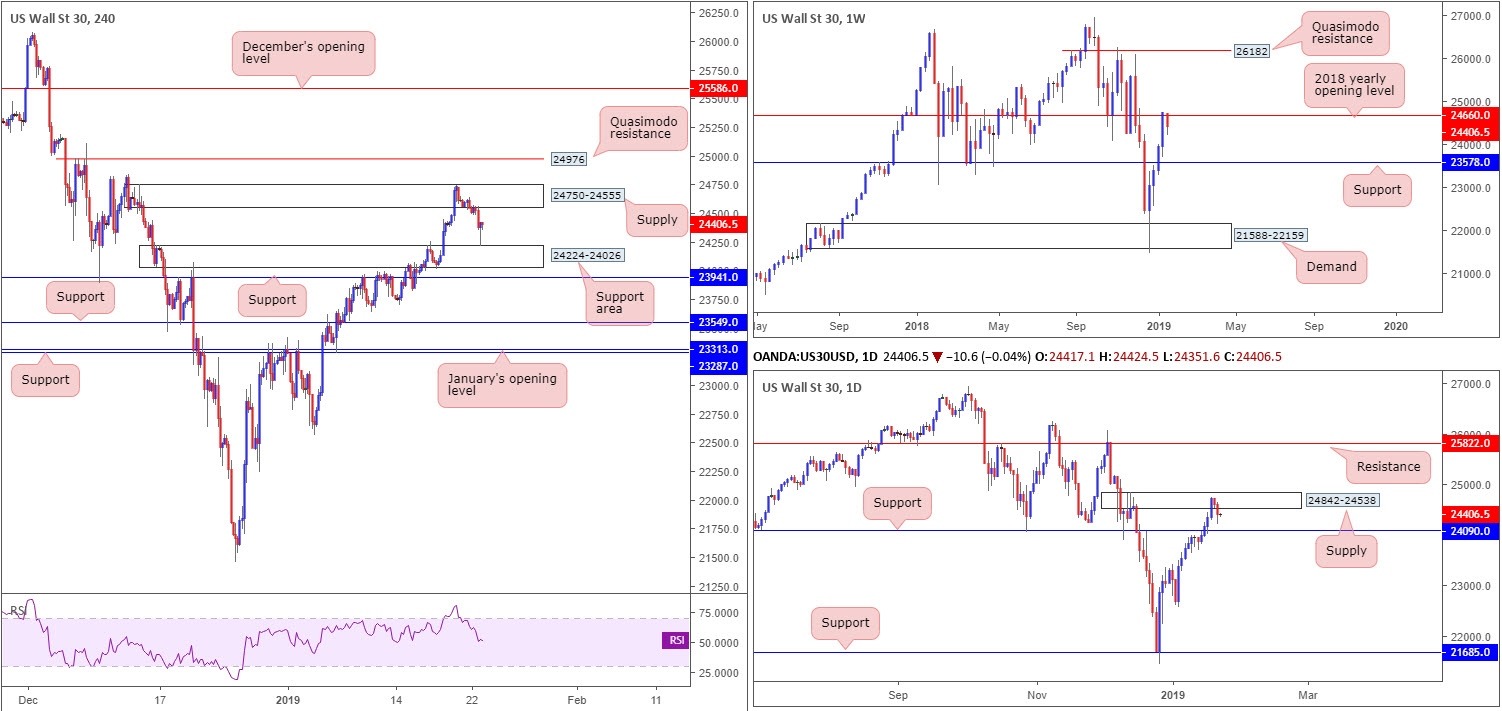
As US equity markets looked to shake off the long weekend, the Dow Jones Industrial Average’s opening session concluded in negative terrain, down 0.79%. Headlines surrounding the US/China trade conflict weighed on market sentiment, dragging H4 candles from supply at 24750-24555 to the top edge of a support area priced in at 24224-24026. It might be worth noting the test off the said support area was by way of a H4 bullish pin-bar formation.
Although yesterday’s session concluded in the shape of a bullish candlestick pattern off a H4 support area, buying this market is tricky. Not only because overhead supply mentioned above at 24750-24555 is seen nearby, but also because we see weekly price tangling with resistance at 24660: the 2018 yearly opening level (sited within the walls of the current H4 supply). This is further validated on the daily timeframe in the shape of a supply zone seen at 24842-24538. The nearest support level on the higher timeframes is daily support coming in at 24090.
Areas of consideration:
For those who read Tuesday’s briefing you may recall the research team underlined the current H4 supply as a sell zone. In fact, a highlighted option was to enter short at current price (around the lower edge of the H4 supply at that time) and place stop-loss orders either above the supply at around 24752ish or above the daily supply edge at 24842 (dependent on your risk tolerance). The first downside target fell in at 24224: the top edge of the H4 support area, which was recently met.
With risk reduced to breakeven, and partial profits recently locked in, traders are effectively in a risk-free trade now. The next downside target beyond the current H4 support area is 24090: the daily support level.
Today’s data points: Limited.
XAU/USD (Gold):
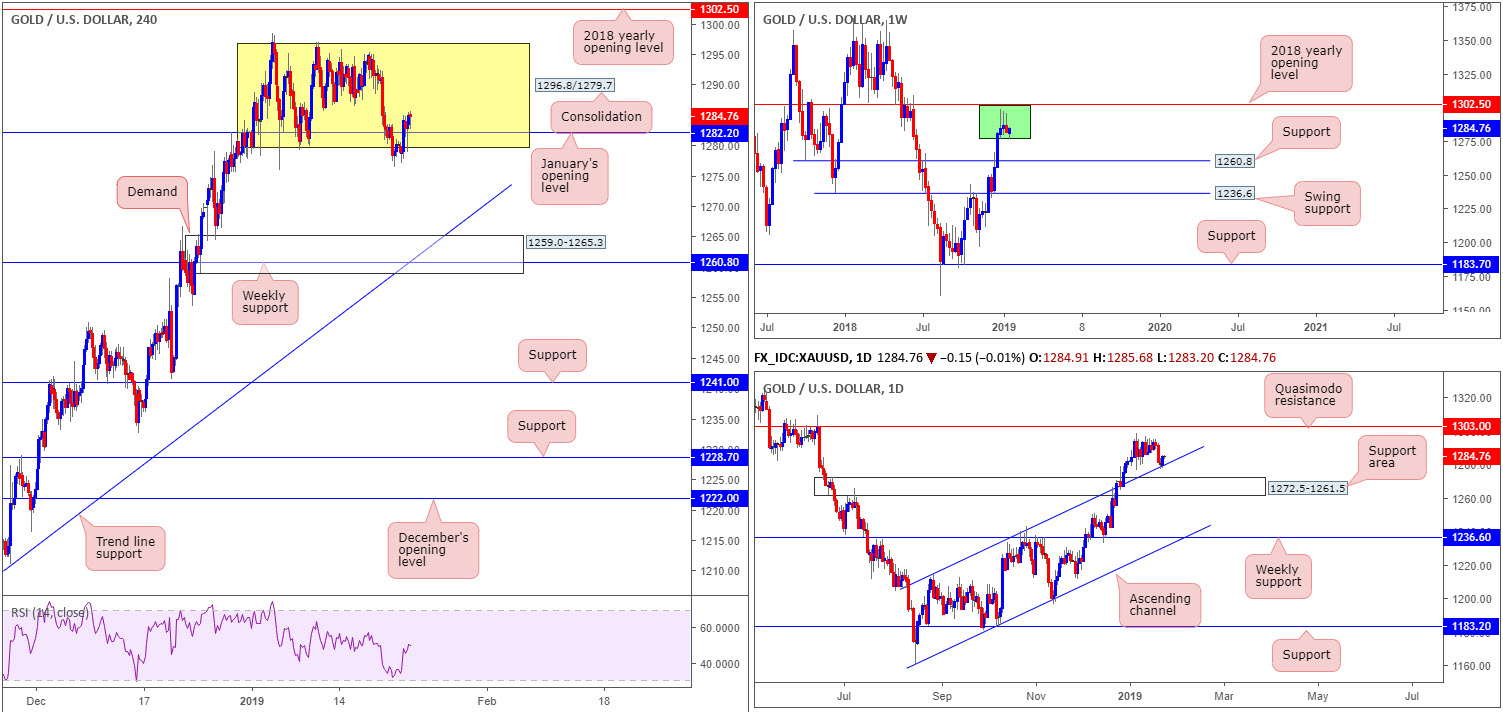
Kicking this market off with a look at the weekly timeframe, the research team notes three consecutive bearish pin-bar formations (green) formed just south of the 2018 yearly opening level at 1302.5. Further selling, according to this timeframe, is possible as far south as support coming in at 1260.8. Lower down on the curve, however, we can see daily price crossing swords with channel resistance-turned support (taken from the high 1214.3), which is seen nearby a support area at 1272.5-1261.5. So far, as you can see, this barrier is holding firm.
The rebound off the daily channel support has forced H4 candles back above January’s opening level at 1282.2 and back within its range (yellow) between 1296.8/1279.7. This could, as long as the buyers remain defensive above 1282.2, pressure this market higher to test the upper edge of the noted range.
Areas of consideration:
Assuming H4 price remains defensive above January’s opening level at 1282.2, the unit may eventually fill its range. Do bear in mind that by entering long here you’re trading alongside daily buyers, though potentially against weekly flow. Therefore, it may be an idea to consider entering only on the back of additional candle confirmation.
An area we also continue to show love for (though may not enter the fight this week) is the H4 demand zone at 1259.0-1265.3 in view of its connecting confluence: fuses nicely with weekly support at 1260.8 and a H4 trend line support (extended from the low 1196.0). Note this H4 demand is also sited within the lower limits of the daily support area mentioned above at 1272.5-1261.5.
Traders either have the option of entering long on a limit order around 1265.3ish and positioning stop-loss orders below the demand, or wait for additional candlestick confirmation to form and enter long based on this structure. The latter is considered the more conservative route.
The use of the site is agreement that the site is for informational and educational purposes only and does not constitute advice in any form in the furtherance of any trade or trading decisions.
The accuracy, completeness and timeliness of the information contained on this site cannot be guaranteed. IC Markets does not warranty, guarantee or make any representations, or assume any liability with regard to financial results based on the use of the information in the site.
News, views, opinions, recommendations and other information obtained from sources outside of www.icmarkets.com.au, used in this site are believed to be reliable, but we cannot guarantee their accuracy or completeness. All such information is subject to change at any time without notice. IC Markets assumes no responsibility for the content of any linked site. The fact that such links may exist does not indicate approval or endorsement of any material contained on any linked site.
IC Markets is not liable for any harm caused by the transmission, through accessing the services or information on this site, of a computer virus, or other computer code or programming device that might be used to access, delete, damage, disable, disrupt or otherwise impede in any manner, the operation of the site or of any user’s software, hardware, data or property.


