
Waiting for lower timeframe confirmation is our main tool to confirm strength within higher timeframe zones, and has really been the key to our trading success. It takes a little time to understand the subtle nuances, however, as each trade is never the same, but once you master the rhythm so to speak, you will be saved from countless unnecessary losing trades. The following is a list of what we look for:
- A break/retest of supply or demand dependent on which way you’re trading.
- A trendline break/retest.
- Buying/selling tails/wicks – essentially we look for a cluster of very obvious spikes off of lower timeframe support and resistance levels within the higher timeframe zone.
We typically search for lower-timeframe confirmation between the M15 and H1 timeframes, since most of our higher-timeframe areas begin with the H4. Stops are usually placed 1-3 pips beyond confirming structures.
EUR/USD:
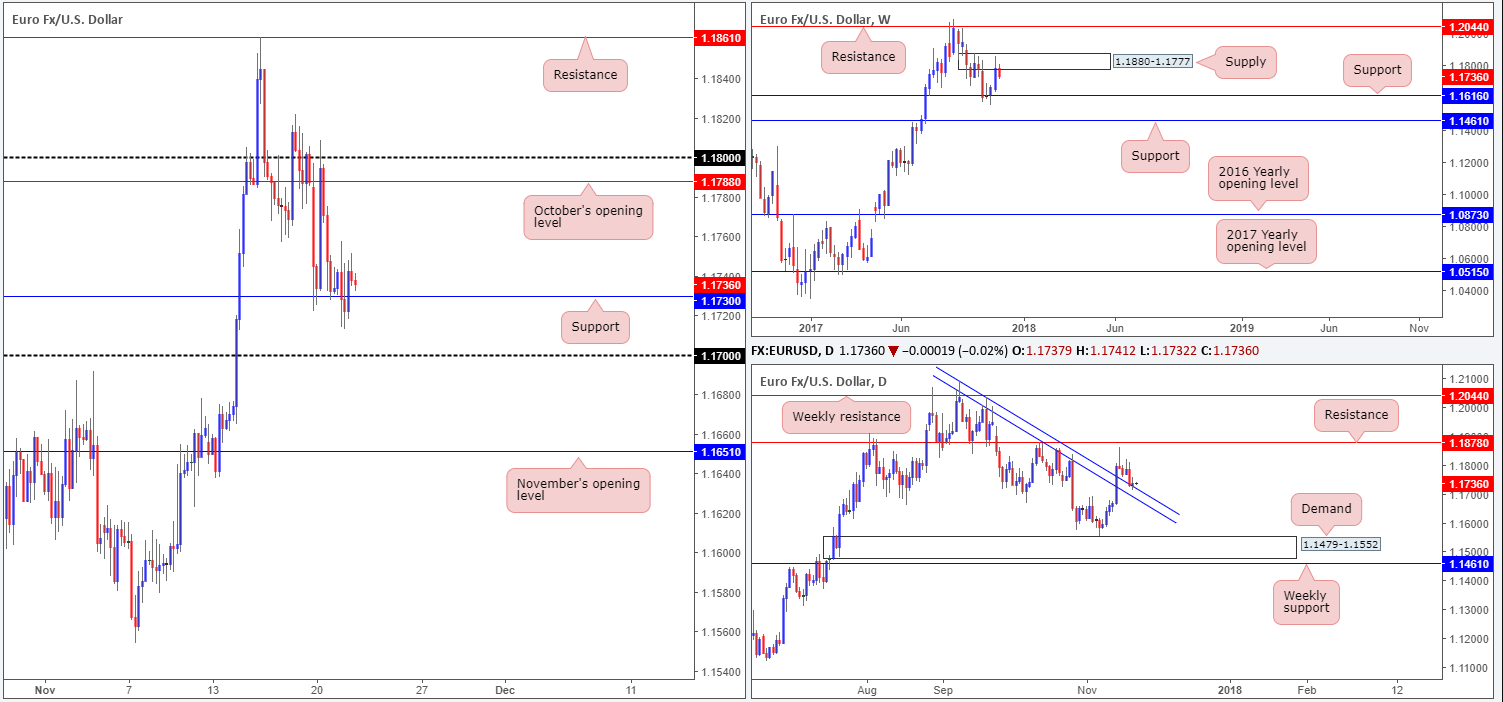
Despite whipsawing beneath H4 support at 1.1730 in early London hours on Tuesday, the pair was confined to a narrow range. Provided that the bulls remain defensive above current support, we could see the single currency approach October’s opening level at 1.1788/ the 1.18 handle. A break to the downside, nevertheless, would, almost immediately, bring the 1.17 handle into the limelight.
On the bigger picture, the pair remains offered from the underside of a weekly supply base coming in at 1.1880-1.1777. The next downside target, assuming the bears remain in the driving seat, is weekly support pegged at 1.1616. On the other side of the coin, however, daily price is seen bolstered by a trendline support etched from the high 1.2092. Due to the lackluster performance seen yesterday, a daily indecision candle was formed.
Suggestions: Although weekly structure indicates further downside may be upon us, selling into both H4 support and a daily trendline support is not a trade we would want to be involved in. Similarly, a long in this market looks great from a H4 and daily perspective, but somewhat risky on the weekly timeframe.
The pair, at least in our opinion, remains relatively restricted. For that reason, opting to stand on the sidelines may very well be the better path to take.
Data points to consider: US core durable goods m/m and US unemployment claims at 1.30pm; US revised UoM consumer sentiment at 3pm; FOMC meeting minutes at 7pm GMT.
Levels to watch/live orders:
- Buys: Flat (stop loss: N/A).
- Sells: Flat (stop loss: N/A).
GBP/USD:
Much like the EUR/USD, the GBP/USD also traded in a relatively narrow range during the course of Tuesday’s sessions. Given this lackluster performance, much of the following analysis will echo thoughts put forward in yesterday’s report.
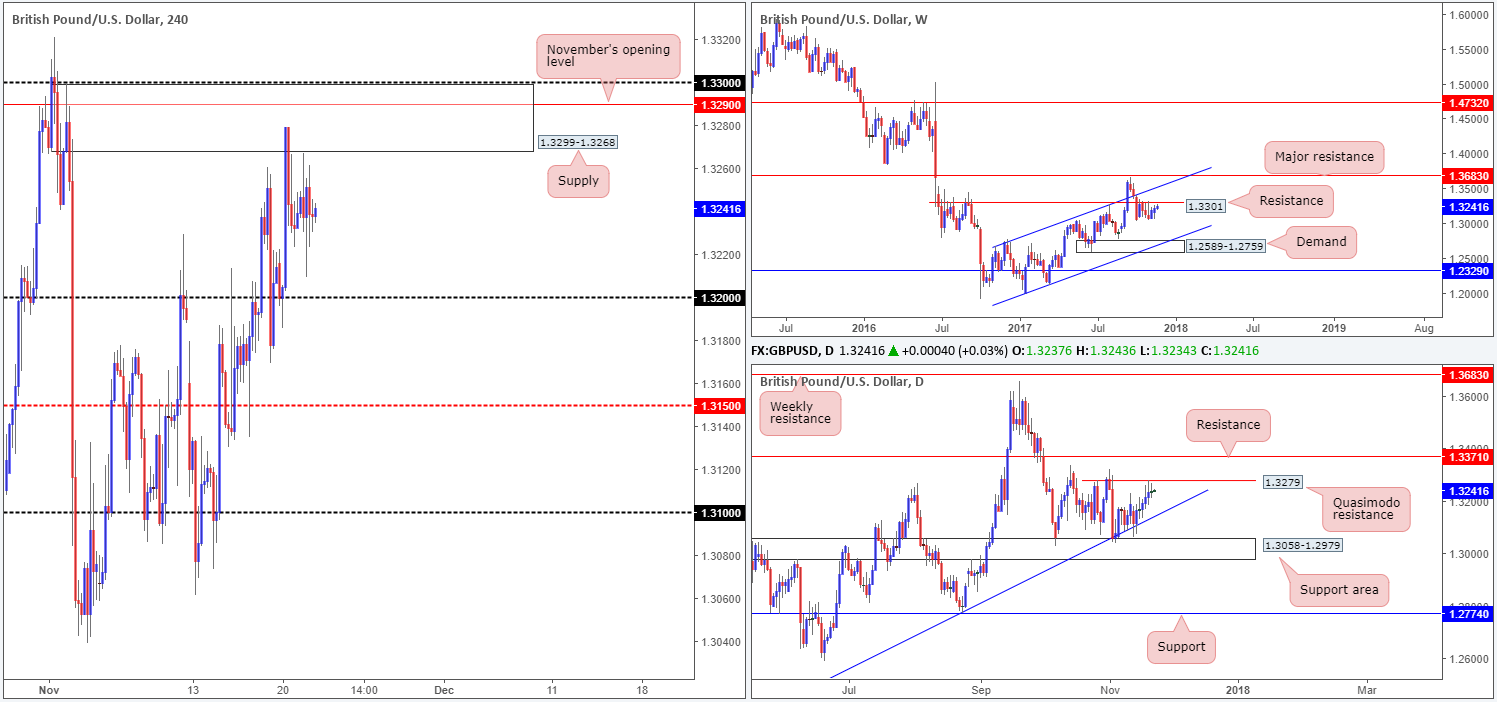
A look at the weekly timeframe shows that the pair is nearing resistance at 1.3301. Since early October, price has been consolidating beneath this barrier. Should a breakout to the upside occur, it seems the unit would be all set to extend up to a channel resistance taken from the high 1.2673. A move south from here on the other hand would likely bring the candles down to a demand seen at 1.2589-1.2759 that fuses with a channel support etched from the low 1.1986. Turning our attention over to the daily candles, price continues to hover beneath the Quasimodo resistance level at 1.3279.
For those who have read our previous reports you may recall that the team highlighted the H4 supply at 1.3299-1.3268 as a potential sell zone. Besides housing November’s opening level at 1.3290 and placed nearby the 1.33 band (which essentially represents the aforementioned weekly resistance level), it also encapsulates the noted daily Quasimodo resistance. However, we are still looking at November’s opening level as an entry point with stops planted above the daily Quasimodo resistance apex (1.3321) at 1.3324.
.Suggestions: Although daily sellers have shown interest around 1.3279, the team will hold fire and patiently wait for 1.3290 to come into the picture before selling.
Data points to consider: UK Autumn forecast statement; US core durable goods m/m and US unemployment claims at 1.30pm; US revised UoM consumer sentiment at 3pm; FOMC meeting minutes at 7pm GMT.
Levels to watch/live orders:
- Buys: Flat (stop loss: N/A).
- Sells: 1.3290 (stop loss: 1.3324).
AUD/USD:
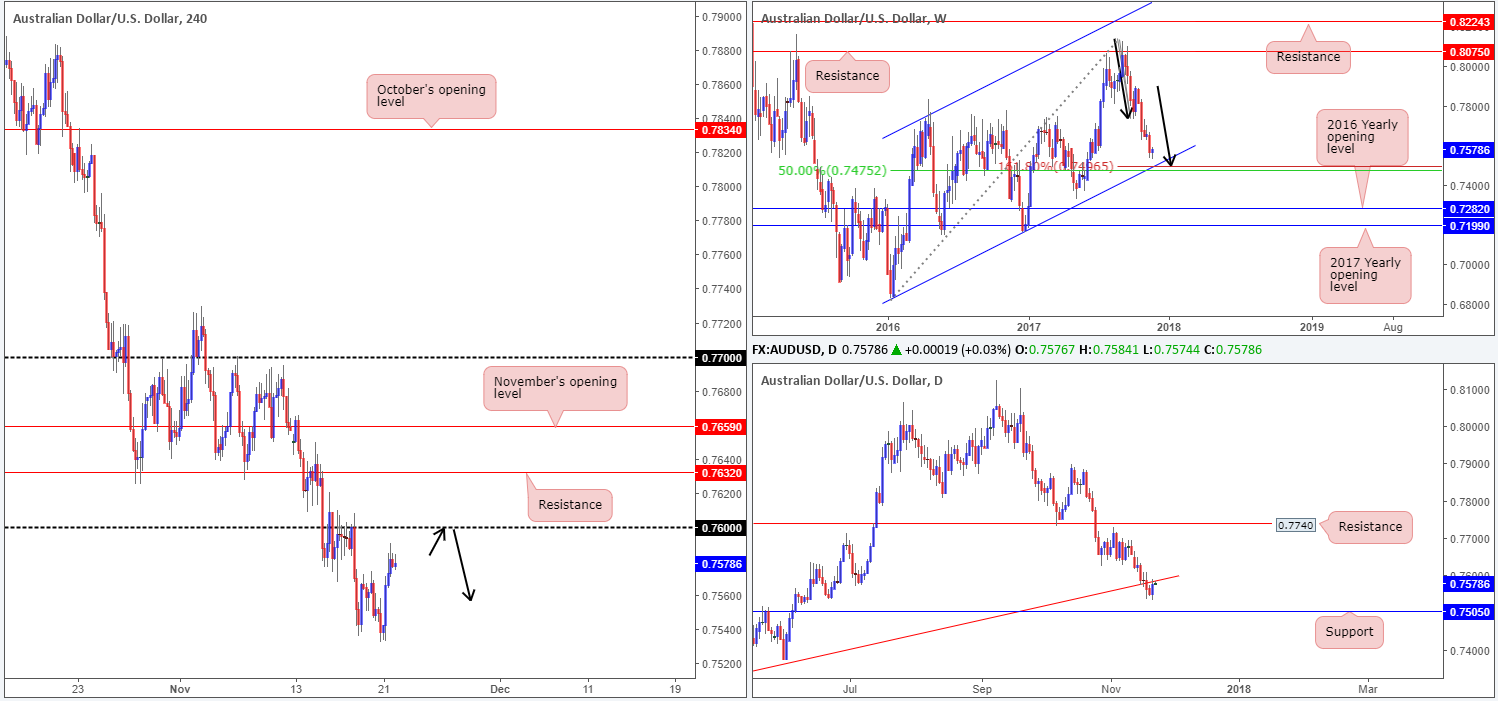
After digesting RBA Gov. Lowe’s comments, the commodity currency staged a modest recovery from lows of 0.7534. The advance hit a stumbling block, however, as price entered into the US segment, spending the remainder of the day consolidating 20 or so pips ahead of the 0.76 handle. Also worthy of mention is that the daily trendline resistance extended from the low 0.7159 is now firmly in the picture.
So, where does this leave us?
- Weekly structure still shows that further downside may be upon us, at least until we reach the 0.75 neighborhood. Merging with a weekly channel support extended from the low 0.6827, there’s a nice-looking weekly AB=CD (see black arrows) 161.8% Fib ext. point at 0.7496 that also aligns with a 50.0% value at 0.7475 taken from the high 0.8125.
- Daily price trading from a trendline resistance and shows room to press as far south as daily support at 0.7505.
- H4 price lurking nearby 0.76.
Suggestions: As of current prices, the 0.76 handle looks prime for a sell, in our opinion. Not only do both higher timeframes show a clear path south, there is, as mentioned above, also a daily trendline resistance bolstering 0.76. A short from 0.76, nonetheless, would only be possible if a H4 full or near-full-bodied candle formed. This is simply because psychological numbers are prone to fakeouts. Ultimately, we would be targeting 0.75 as this is a level we are looking to buy from, given weekly and daily confluence (see above).
Data points to consider: US core durable goods m/m and US unemployment claims at 1.30pm; US revised UoM consumer sentiment at 3pm; FOMC meeting minutes at 7pm GMT.
Levels to watch/live orders:
- Buys: 0.75 (stop loss: 0.7455).
- Sells: 0.76 region ([waiting for a reasonably sized H4 bearish candle to form – preferably a full or near-full-bodied candle – is advised] stop loss: ideally beyond the candle’s wick).
USD/JPY:
Failing to sustain gains beyond October’s opening level seen on the H4 timeframe at 112.64, the USD/JPY spent Tuesday pressing lower, consequently concluding trade at a low of 112.17. In the event that the bears continue to push lower today/this week, the next area of concern on the H4 timeframe can be seen at last Friday’s low 111.88, followed closely by H4 support at 111.77.
As is evident from the daily timeframe, support at 111.91 held beautifully on Monday but, thanks to October’s opening level, has failed to generate much follow-through action. Also of particular interest is where price came from: a monstrous weekly supply coming in at 115.50-113.85.
Suggestions: Neither a long nor short seems attractive right now. A sell at current price would be a chancy move seeing as there is no discernible H4 resistance in play. Furthermore, you would be selling directly into a daily support, which has already proved its worth three times since late September. So, what about a long from the daily support? Again, this would be tricky since you’d be buying into potential weekly momentum from the noted weekly supply.
Data points to consider: US core durable goods m/m and US unemployment claims at 1.30pm; US revised UoM consumer sentiment at 3pm; FOMC meeting minutes at 7pm GMT.

Levels to watch/live orders:
- Buys: Flat (stop loss: N/A).
- Sells: Flat (stop loss: N/A).
USD/CAD:
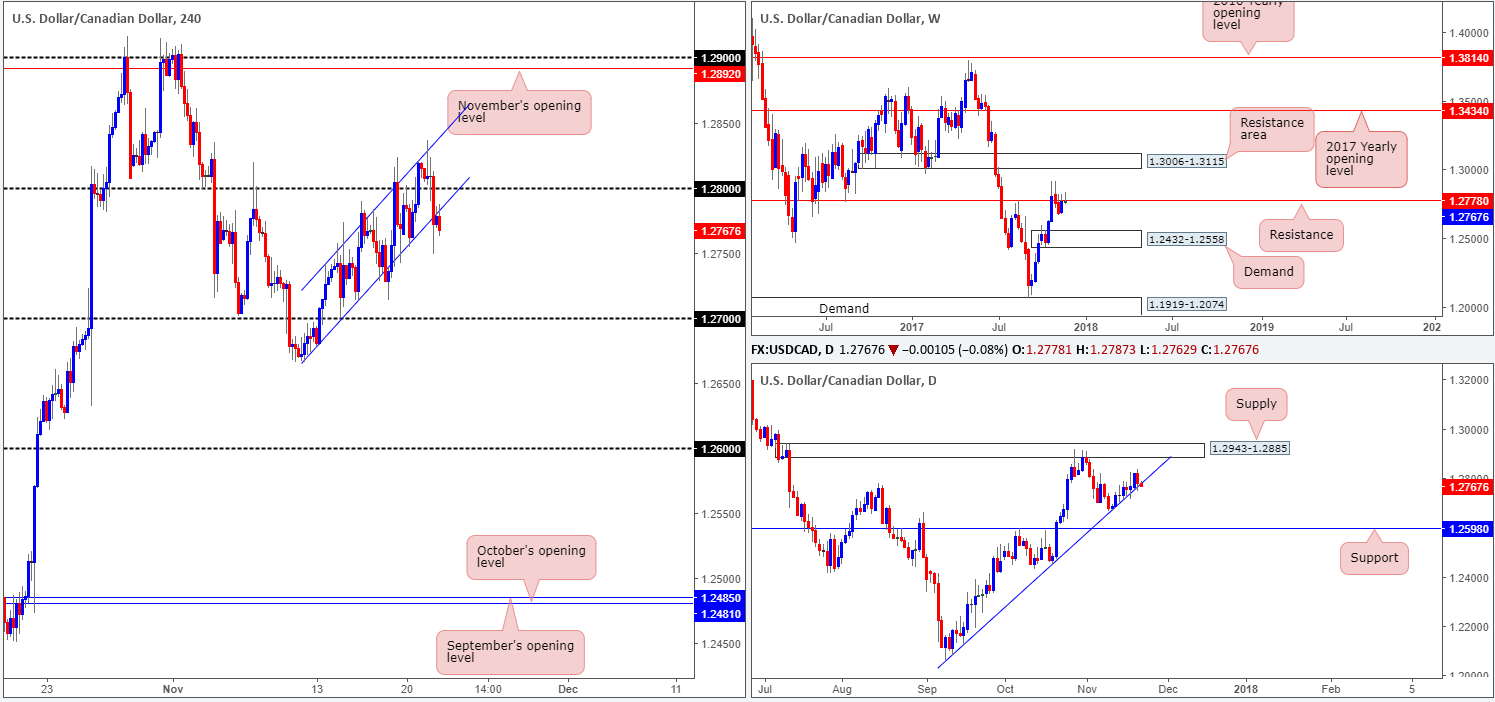
After shaking hands with a H4 channel resistance band taken from the high 1.2741, along with Canadian data coming in below market expectations, the pair cracked below 1.28 and eventually closed beyond H4 channel support extended from the low 1.2666. What’s also interesting here is that H4 price recently retested the underside of this recently broken channel line and is, as we write, on course to form a near-full-bodied bearish candle. This, coupled with weekly price seen trading marginally below weekly resistance at 1.2778, is a strong indication that the pair may be heading down to at least the 1.27 boundary today.
Suggestions: The only grumble we have about shorting here is the daily trendline support drawn from the low 1.2061. However, should H4 price manage to chalk up a reasonably strong-looking bear candle, we feel a short is worth the risk.
Data points to consider: US core durable goods m/m and US unemployment claims at 1.30pm; US revised UoM consumer sentiment at 3pm; US Crude oil inventories at 3.30pm; FOMC meeting minutes at 7pm GMT.
Levels to watch/live orders:
- Buys: Flat (stop loss: N/A).
- Sells: Currently watching for a near-full-bodied bearish candle to take shape (stop loss: beyond the candle’s wick).
USD/CHF:
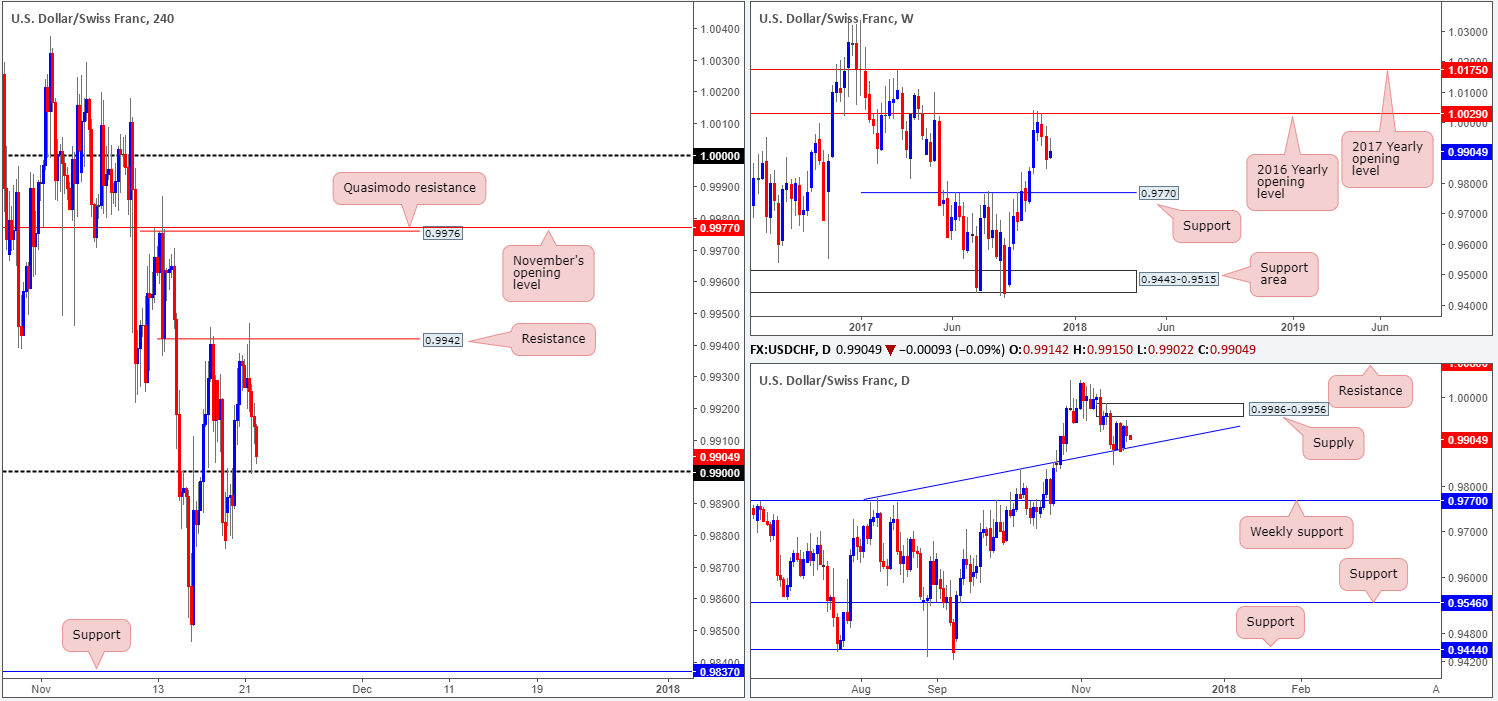
The USD/CHF, once again, failed in its attempt to breach H4 resistance at 0.9942. This resulted in the pair tumbling south yesterday and crossing swords with the 0.99 handle. Initially, there was a solid response from this number, but, as you can see, the bulls have so far failed to follow through. 0.99 remains intact, but for how long?
Across the river on the daily timeframe, the candles are tightly consolidating between an ascending trendline support etched from the high 0.9773 and a nearby supply base coming in at 0.9986-0.9956. Up on the weekly timeframe, downside has been the favored direction since the Swissie connected with the 2016 yearly opening level at 1.0029. The next downside target on this scale can be seen at 0.9770: a support level.
Suggestions: 0.99 is likely to breach today. Not only because of potential pressure coming in from weekly sellers, but also due to the aforementioned daily trendline support being located beneath the number. As such, we’ll avoid longs off 0.99 today. A H4 close below 0.99 is also likely to prove fruitless for breakout sellers, given that there are likely willing buyers around the nearby daily trendline support.
Basically, it is a restricted market and not one we would feel comfortable trading today.
Data points to consider: US core durable goods m/m and US unemployment claims at 1.30pm; US revised UoM consumer sentiment at 3pm; FOMC meeting minutes at 7pm GMT.
Levels to watch/live orders:
- Buys: Flat (stop loss: N/A).
- Sells: Flat (stop loss: N/A).
DOW 30:
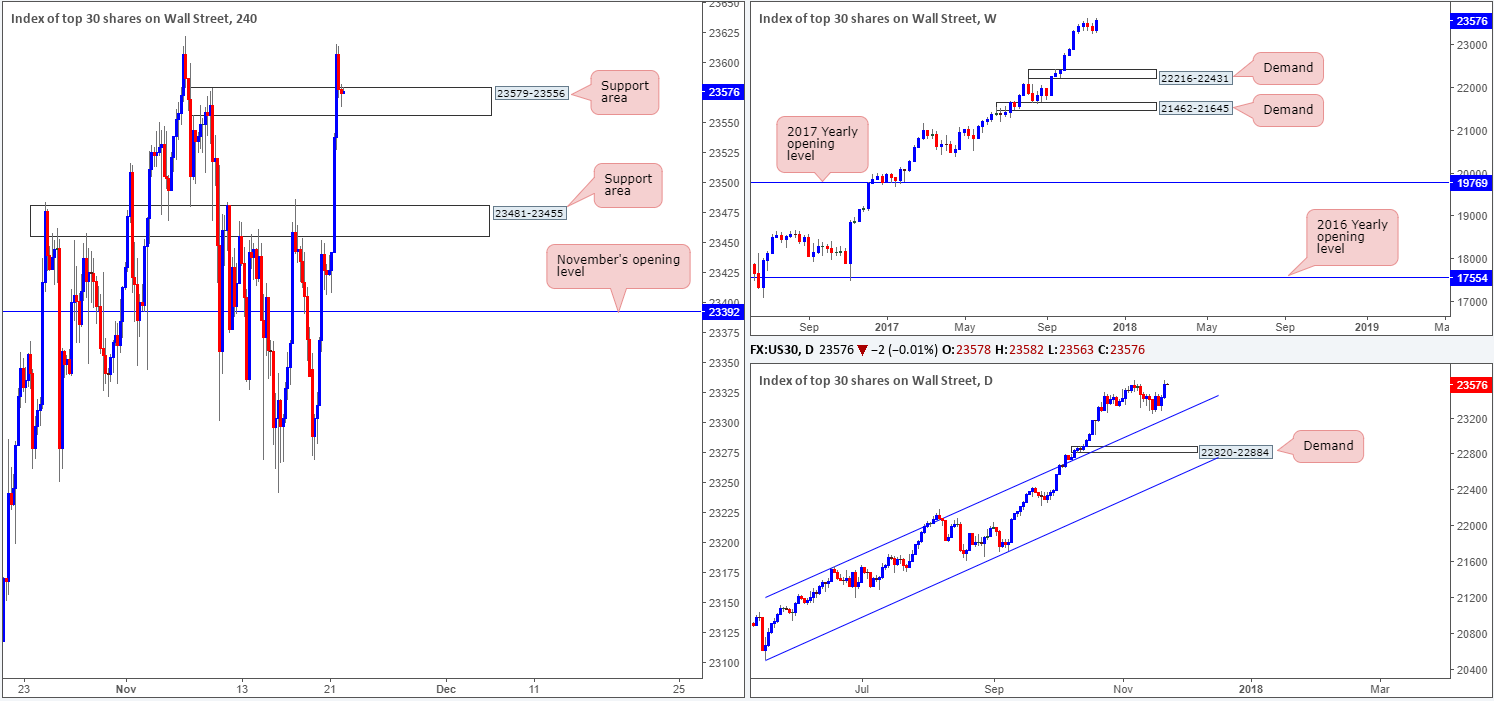
Following a positive start to the day, US equities continued to propel higher on Tuesday. Led by Health care and information technology gains, the DJIA was able to crunch through a H4 resistance area at 23481-23455 (now acting support area) and also a H4 supply base at 23579-23556 (also now an acting support area).
With H4 price currently seen retesting 23579-23556 as support, this could be an ideal location to hunt for buying opportunities. Besides this market being entrenched within an incredibly strong uptrend, all three timeframes we watch show little resistance on the horizon. Therefore, record highs may be on the cards!
Suggestions: In view of noted structure, the team will be keeping a close eye on the current H4 support area for a buy opportunity today. For us to feel comfortable trading from this zone, we would insist on seeing a full or near-full-bodied H4 bull candle take shape. This will show buyer interest and increase the odds of price continuing north.
Data points to consider: US core durable goods m/m and US unemployment claims at 1.30pm; US revised UoM consumer sentiment at 3pm; FOMC meeting minutes at 7pm GMT.
Levels to watch/live orders:
- Buys: 23579-23556 ([waiting for a reasonably sized H4 bullish candle to form – preferably a full or near-full-bodied candle – is advised] stop loss: ideally beyond the candle’s tail).
- Sells: Flat (stop loss: N/A).
GOLD:
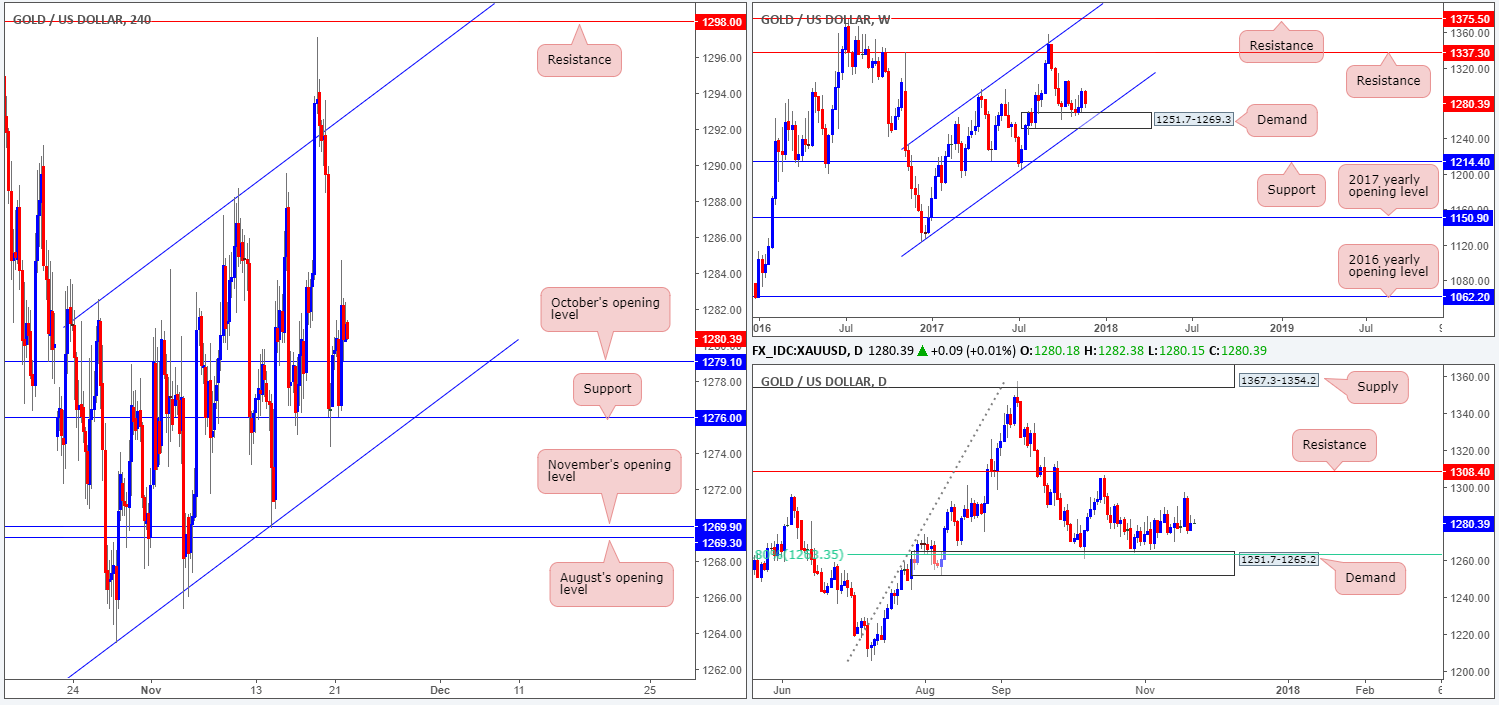
It was a relatively quiet day in the gold market on Tuesday. Despite price dipping below October’s opening level seen on the H4 timeframe at 1279.1, the sellers were unable to dictate direction. Weekly action, however, shows that the buyers and sellers remain battling for position just ahead of a demand area coming in at 1251.7-1269.3, which happens to merge nicely with a channel support taken from the low 1122.1. Also noteworthy is the daily demand pegged at 1251.7-1265.2 (positioned within the lower limits of the said weekly zone) that houses a 61.8% Fib support at 1263.3.
Suggestions: We remain reluctant to consider buying this market around October’s open level. Whether this is enough to hold the fort and push bids higher is difficult to judge. The reason we say this is simply because higher-timeframe traders may want to bring the unit down as far as weekly demand mentioned above at 1251.7-1269.3.
While a long from 1279.1 or even the H4 support seen just below it at 1276.0, may very well work out, we are wary given the lack of higher-timeframe support and H4 confluence. The team, therefore, will remain on the bench today and reassess going into tomorrow’s open.
Levels to watch/live orders:
- Buys: Flat (stop loss: N/A).
- Sells: Flat (stop loss: N/A).


