
DXY:
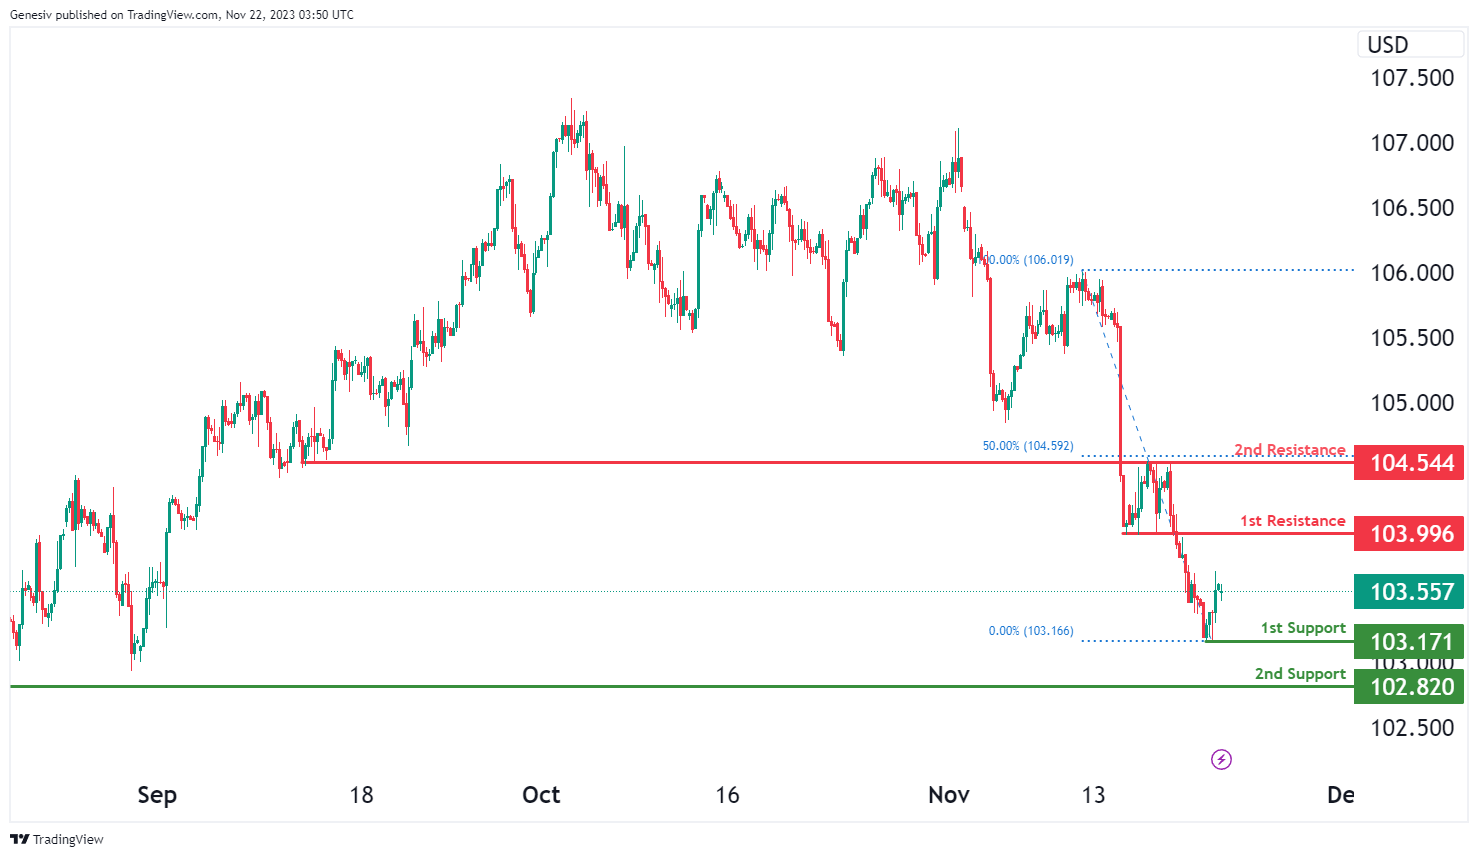
The DXY (US Dollar Index) chart currently indicates a bullish momentum, suggesting a potential bullish continuation towards the first resistance at 103.99.
The first support at 103.17 is identified as a swing low support, indicating a level where the price might find buying interest. Additionally, the second support at 102.82 is recognized as an overlap support, reinforcing the potential strength of the support zone.
On the resistance side, the first resistance at 103.99 is significant due to its pullback resistance, marking a crucial level where the price might face selling pressure or potential reversals within its upward movement. Furthermore, the second resistance at 104.54 is identified as another overlap resistance, emphasizing its importance as a potential hurdle for the price and a point where it might encounter obstacles in its bullish continuation.
EUR/USD:
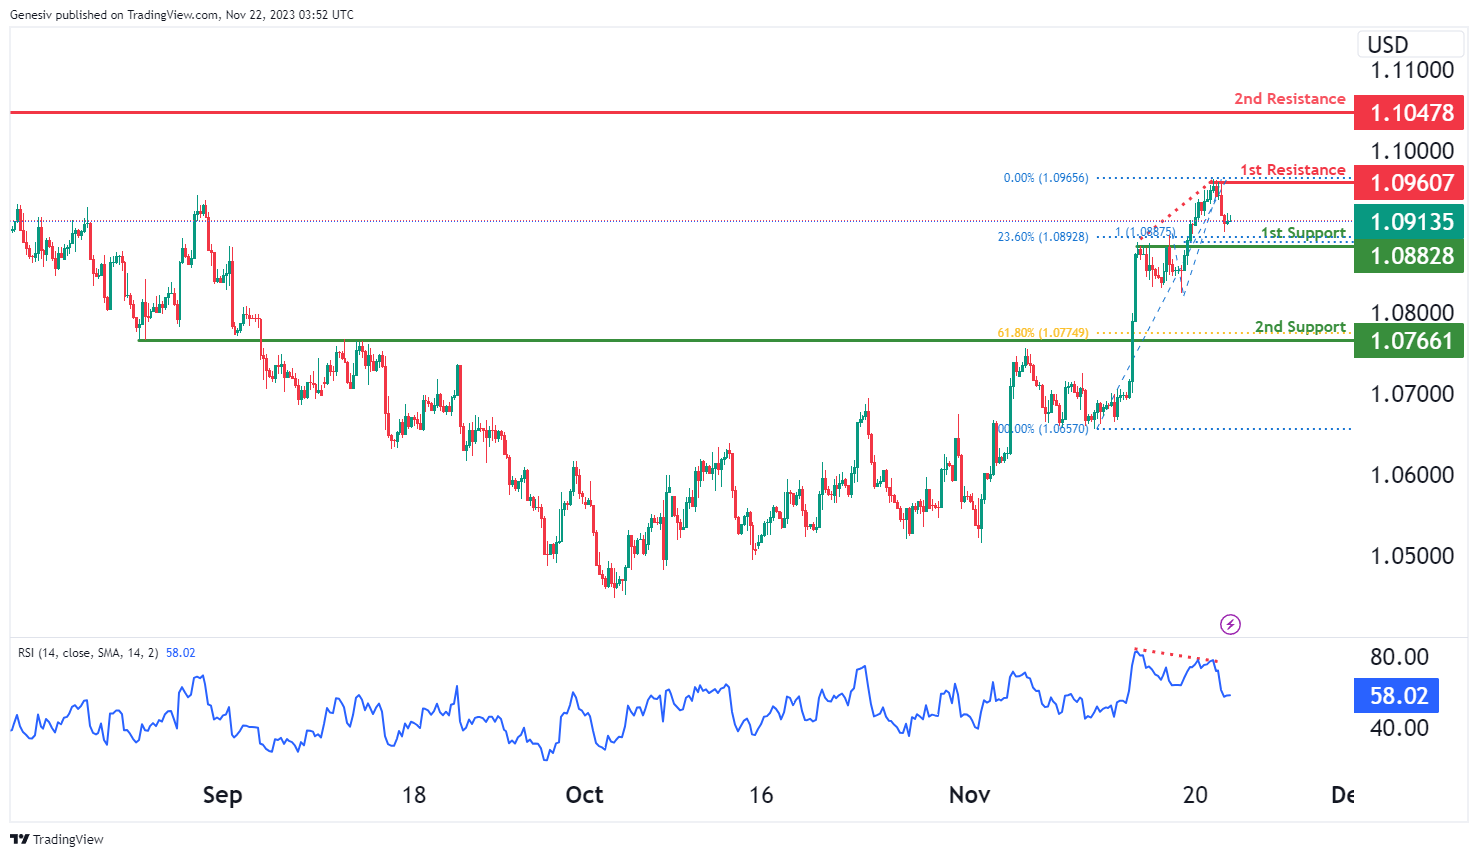
The EUR/USD chart currently indicates a bearish momentum, suggesting a potential bearish continuation towards the first support at 1.0882.
The first support at 1.0882 is identified as a pullback support, coinciding with the 23.60% Fibonacci Retracement and the 100% Fibonacci Projection, indicating a level where the price might find buying interest. Additionally, the second support at 1.0766 is recognized as another pullback support, coinciding with the 61.80% Fibonacci Retracement, reinforcing the potential strength of the support zone.
On the resistance side, the first resistance at 1.0960 is significant due to its swing high resistance, marking a crucial level where the price might face selling pressure or potential reversals within its downward movement. Furthermore, the second resistance at 1.1047 is identified as a multi-swing high resistance, emphasizing its importance as a potential hurdle for the price and a point where it might encounter obstacles in its bearish continuation.
It’s noteworthy that the RSI (Relative Strength Index) is displaying bearish divergence versus price, suggesting that a reversal might occur soon.
EUR/JPY:
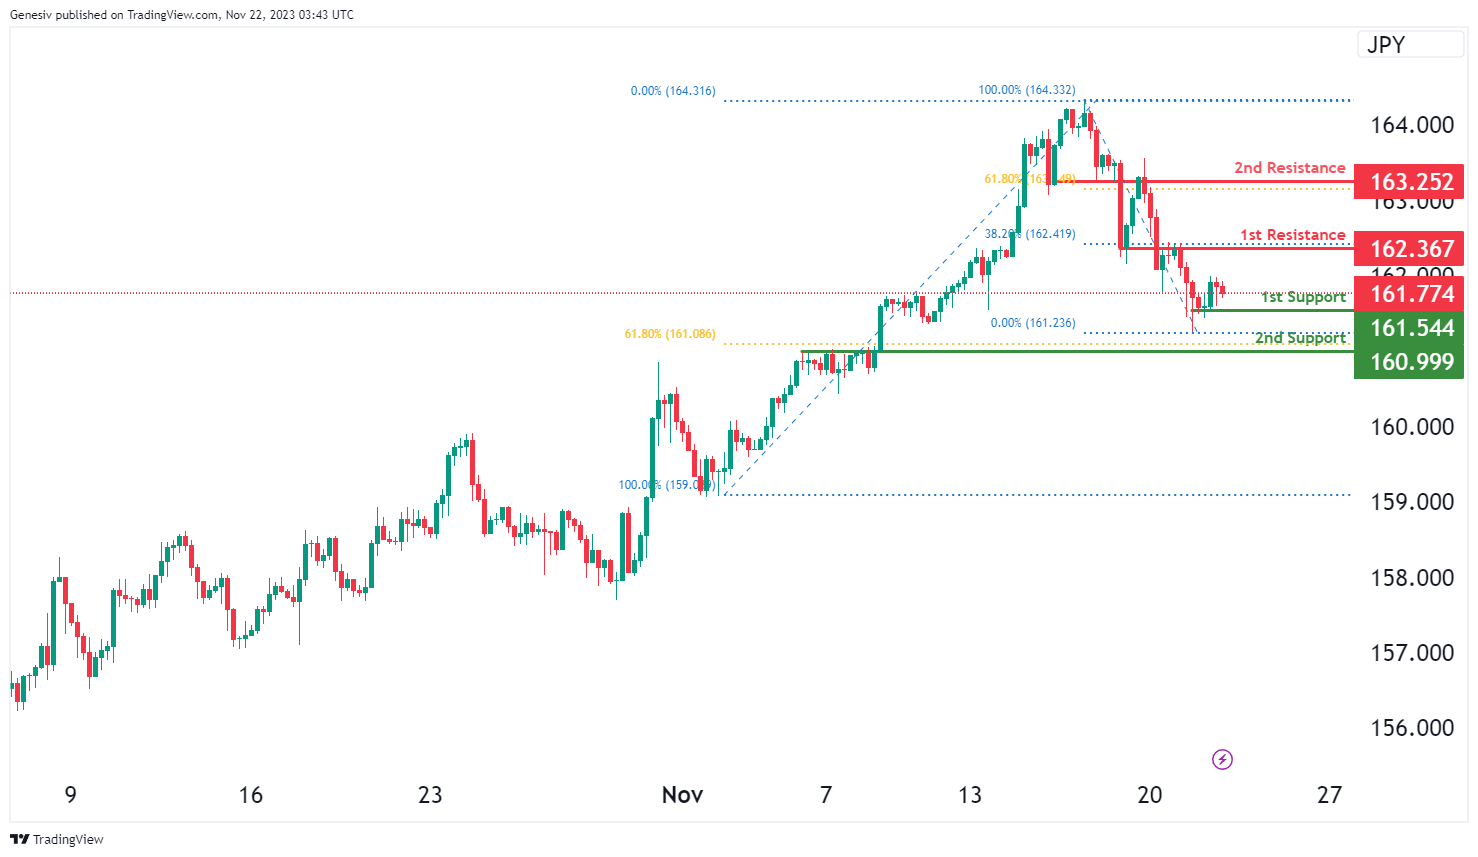
The EUR/JPY chart currently indicates a bullish momentum, suggesting a potential drop to the first support at 161.54 in the short term before bouncing and rising towards the first resistance at 162.36.
The first support at 161.54 is identified as a swing low support, indicating a level where the price might find buying interest. Additionally, the second support at 160.99 is recognized as a pullback support, coinciding with the 61.80% Fibonacci Retracement, reinforcing the potential strength of the support zone.
On the resistance side, the first resistance at 162.36 is significant due to its overlap resistance, marking a crucial level where the price might face selling pressure or potential reversals within its upward movement. Furthermore, the second resistance at 163.25 is identified as another overlap resistance, emphasizing its importance as a potential hurdle for the price and a point where it might encounter obstacles in its bullish continuation.
EUR/GBP:
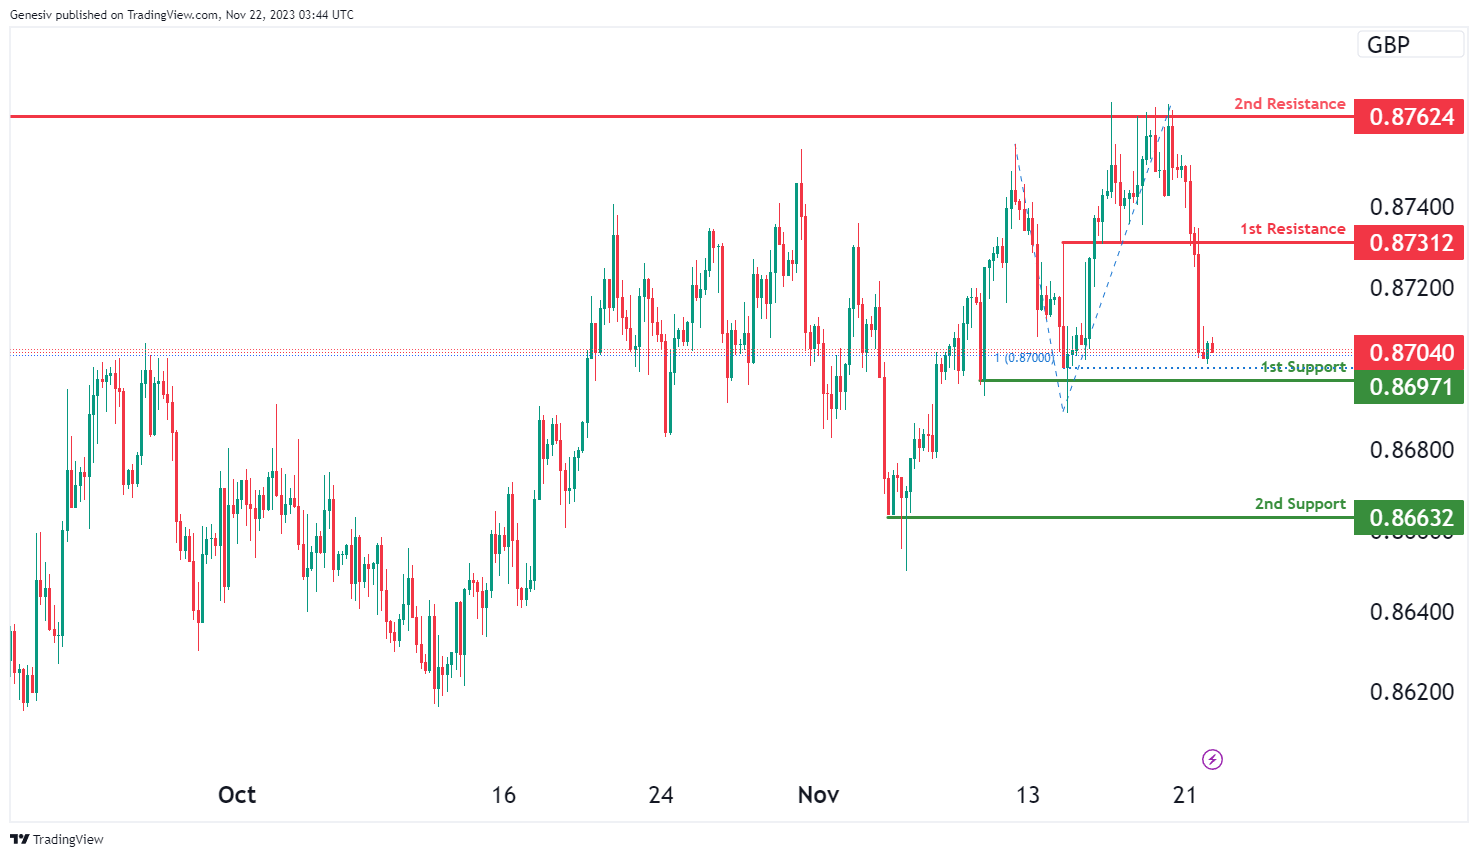
The EUR/GBP chart currently indicates a bullish momentum, suggesting a potential bullish bounce off the first support at 0.8697 towards the first resistance at 0.8731.
The first support at 0.8697 is identified as a swing low support, coinciding with the 100% Fibonacci Projection, indicating a level where the price might find buying interest. Additionally, the second support at 0.8663 is recognized as another swing low support, reinforcing the potential strength of the support zone.
On the resistance side, the first resistance at 0.8731 is significant due to its pullback resistance, marking a crucial level where the price might face selling pressure or potential reversals within its upward movement. Furthermore, the second resistance at 0.8762 is identified as an overlap resistance, emphasizing its importance as a potential hurdle for the price and a point where it might encounter obstacles in its bullish continuation.
GBP/USD:
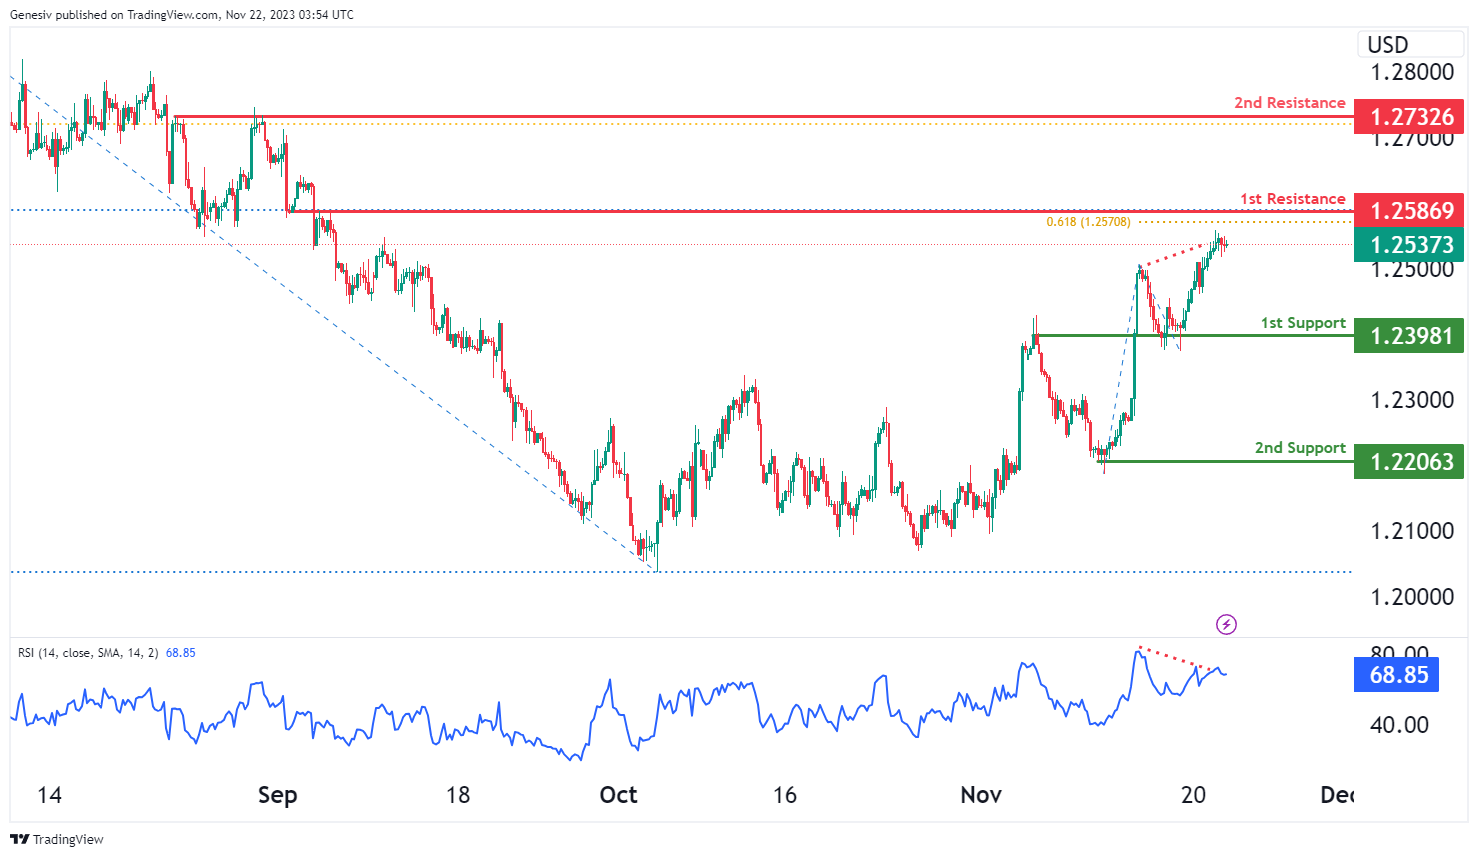
The GBP/USD chart currently shows a bearish overall momentum, and there is a potential scenario for the price to rise towards the first resistance at 1.2586 in the short term before reversing off it and dropping towards the first support at 1.2398.
The first support at 1.2398 is considered significant as an overlap support, indicating a level where the price might find buying interest. Additionally, the second support at 1.2206 is recognized as a swing low support, reinforcing the potential strength of the support zone.
On the resistance side, the first resistance at 1.2586 is crucial due to its nature as an overlap resistance, coinciding with the 50% Fibonacci Retracement and the 61.80% Fibonacci Projection, indicating a level where the price might face selling pressure or potential reversals within its upward movement. Furthermore, the second resistance at 1.2732 is identified as another overlap resistance, coinciding with the 61.80% Fibonacci Retracement, emphasizing its importance as a potential hurdle for the price.
It’s noteworthy that the RSI (Relative Strength Index) is displaying bearish divergence versus price, suggesting that a reversal might occur soon.
GBP/JPY:
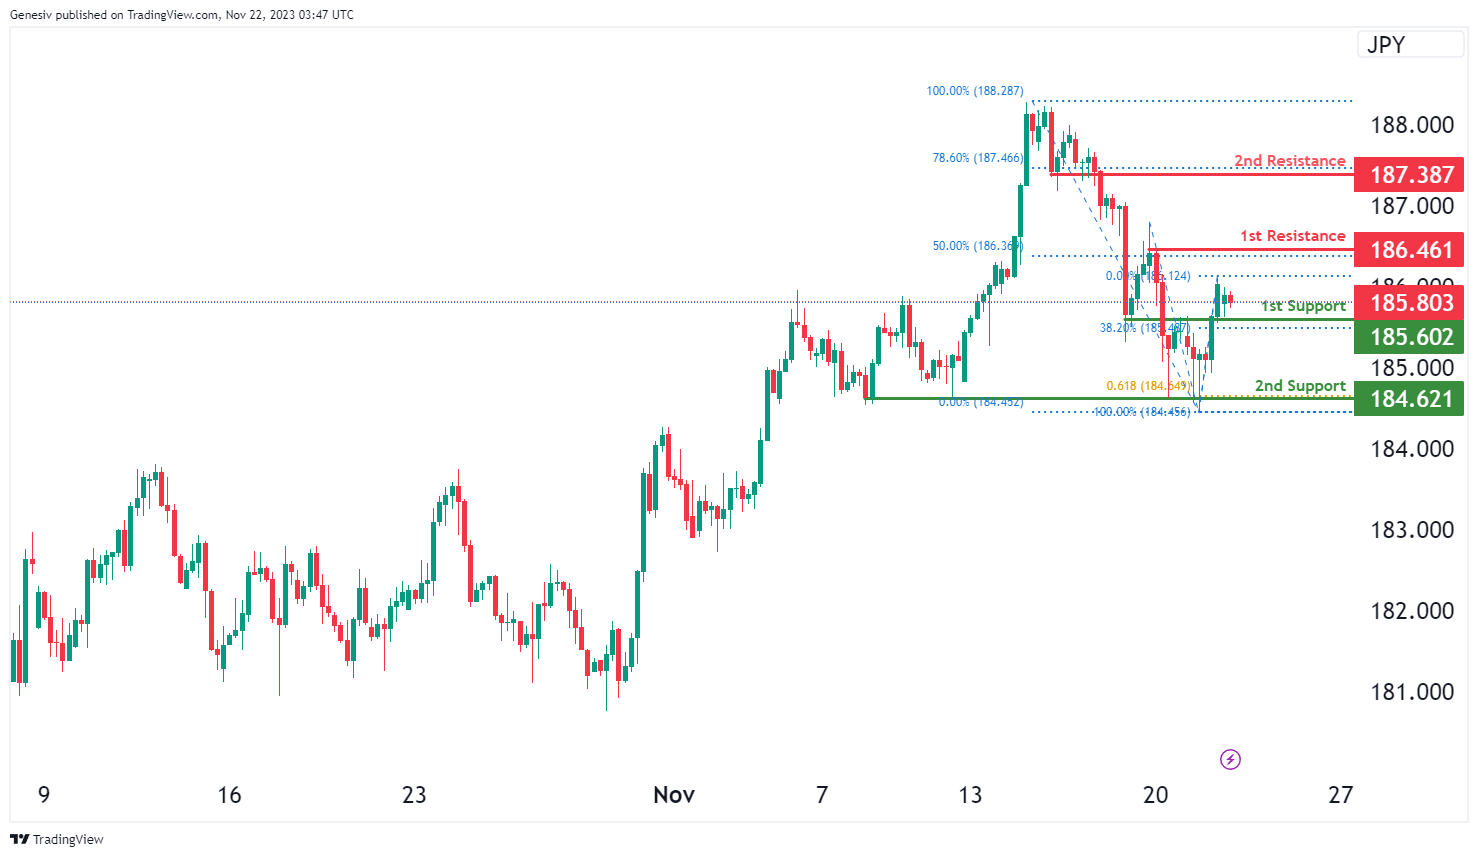
The GBP/JPY chart currently indicates a bullish momentum, suggesting a potential bullish bounce off the first support at 185.60 towards the first resistance at 186.46.
The first support at 185.60 is identified as a pullback support, coinciding with the 38.20% Fibonacci Retracement, indicating a level where the price might find buying interest. Additionally, the second support at 184.62 is recognized as a multi-swing low support, coinciding with the 61.80% Fibonacci Projection, reinforcing the potential strength of the support zone.
On the resistance side, the first resistance at 186.46 is significant due to its swing high resistance, marking a crucial level where the price might face selling pressure or potential reversals within its upward movement. Furthermore, the second resistance at 187.38 is identified as a pullback resistance, coinciding with the 78.60% Fibonacci Retracement, emphasizing its importance as a potential hurdle for the price and a point where it might encounter obstacles in its bullish continuation.
USD/CHF:
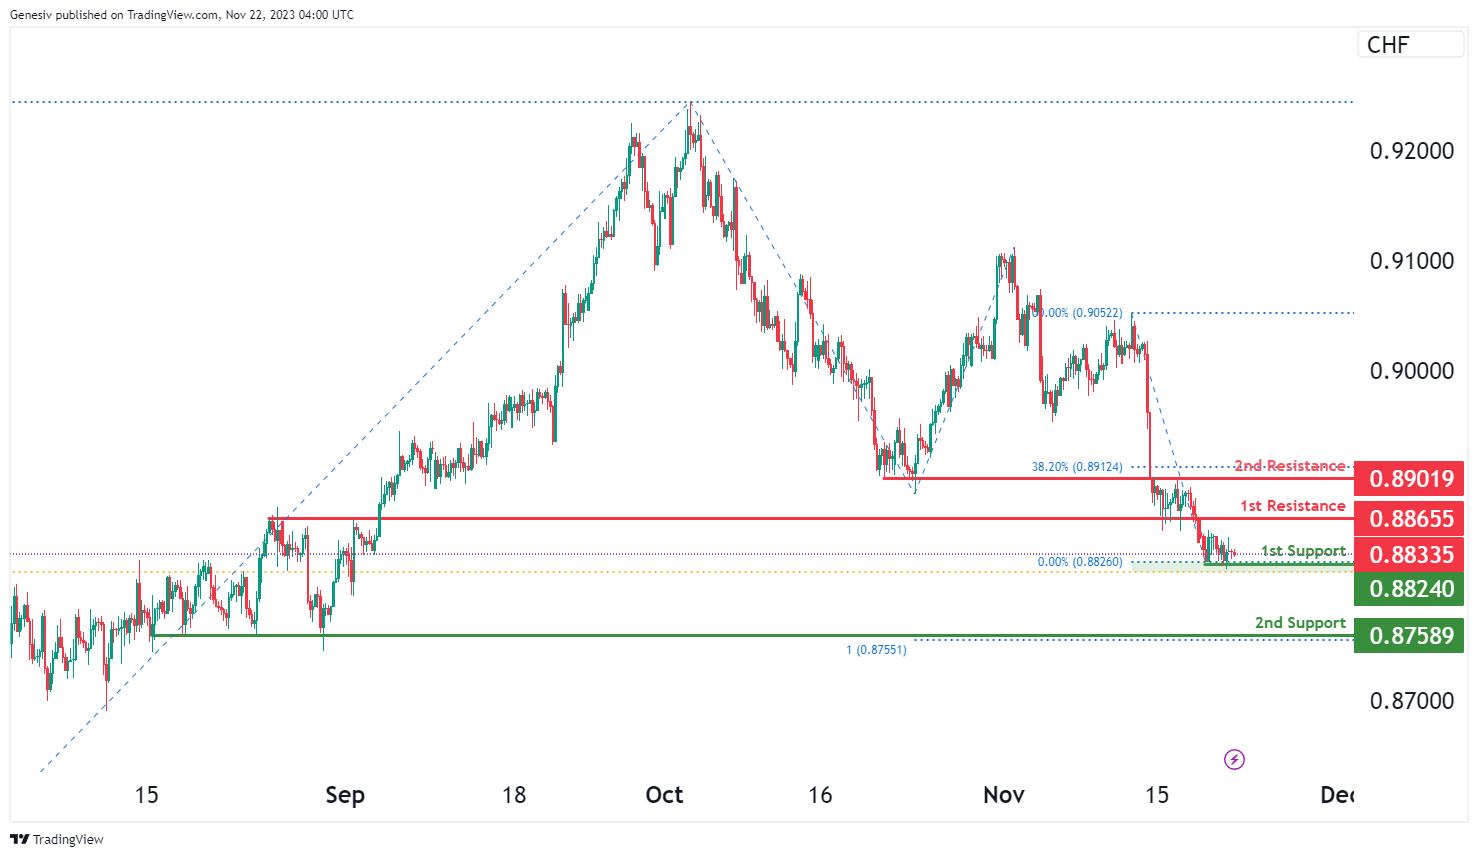
The USD/CHF chart currently reflects a neutral overall momentum, indicating a lack of a clear directional bias. There is a potential scenario for the price to fluctuate between the 1st resistance at 0.8865 and the 1st support level at 0.8824.
The 1st support at 0.8824 is considered significant as a multi-swing low support, indicating a level where the price has previously found support across multiple swings. Additionally, it coincides with the 61.80% Fibonacci Retracement, reinforcing its potential as a strong support level.
The 2nd support at 0.8758 is also recognized as a multi-swing low support, further emphasizing the importance of this support zone. Additionally, it aligns with the 100% Fibonacci Projection, indicating potential buying interest at this level.
On the resistance side, the 1st resistance at 0.8865 is crucial due to its nature as a pullback resistance, suggesting a level where the price might face selling pressure or potential reversals within its upward movement.
The 2nd resistance at 0.8901 is identified as an overlap resistance, coinciding with the 38.20% Fibonacci Retracement, emphasizing its significance as a potential hurdle for the price.
USD/JPY:
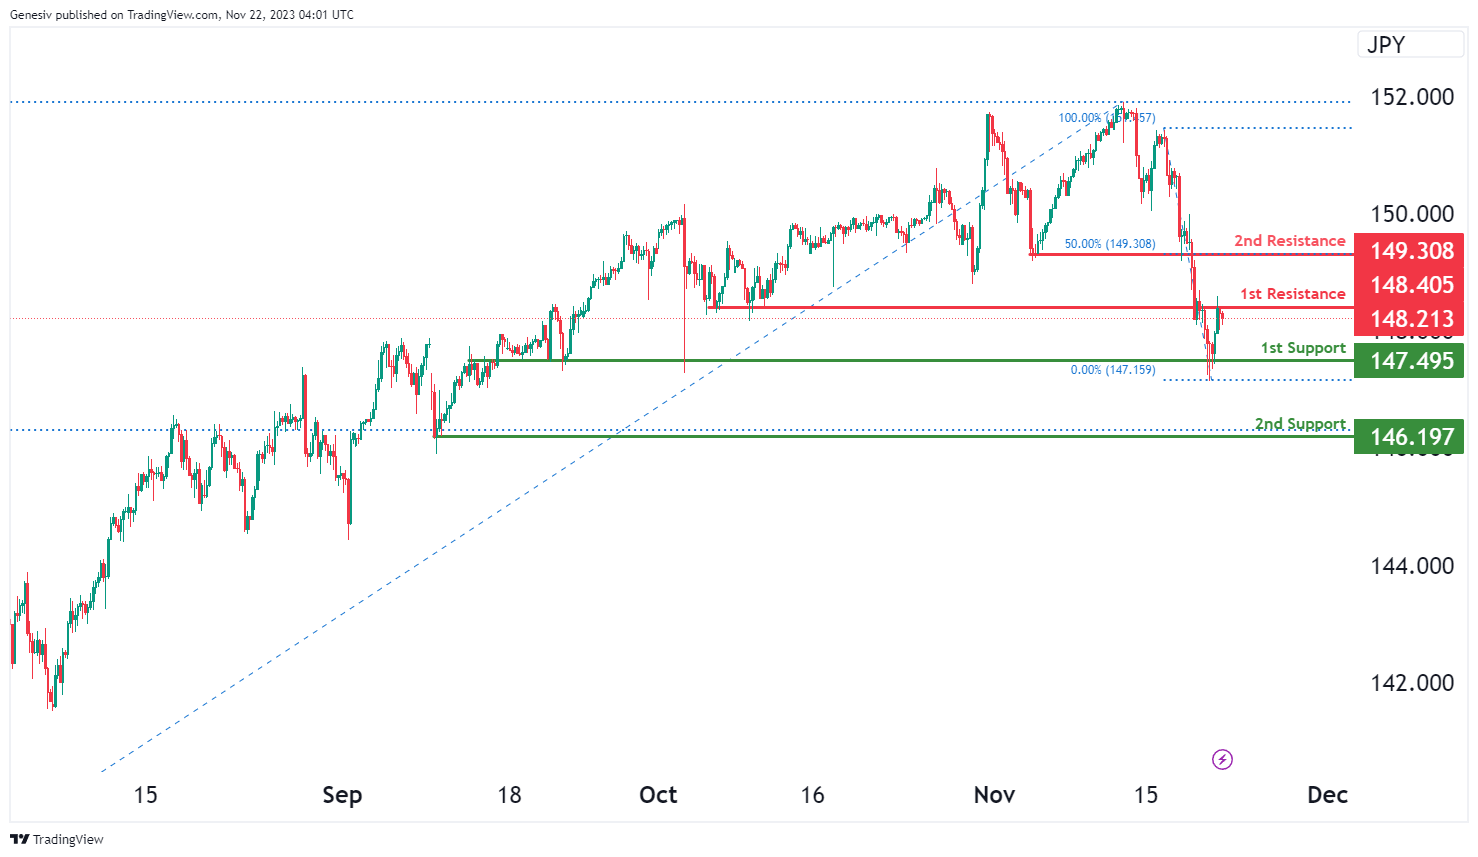
The USD/JPY chart currently has an overall bearish momentum, suggesting the potential for a bearish continuation towards the 1st support. There is a possibility that the price might exhibit a bearish reaction off the 1st resistance and subsequently drop to the 1st support.
The 1st support level is identified at 147.49, and the reason it is considered favorable is due to the presence of an overlap support.
The 2nd support level is located at 146.19, and its favorable aspect is attributed to being a swing low support as well as being at the 38.20% Fibonacci Retracement level.
On the resistance side, the 1st resistance is situated at 148.40, and it is deemed significant due to being an overlap resistance.
The 2nd resistance is positioned at 149.30, and its significance is derived from being a pullback resistance and coinciding with the 50% Fibonacci Retracement level.
USD/CAD:
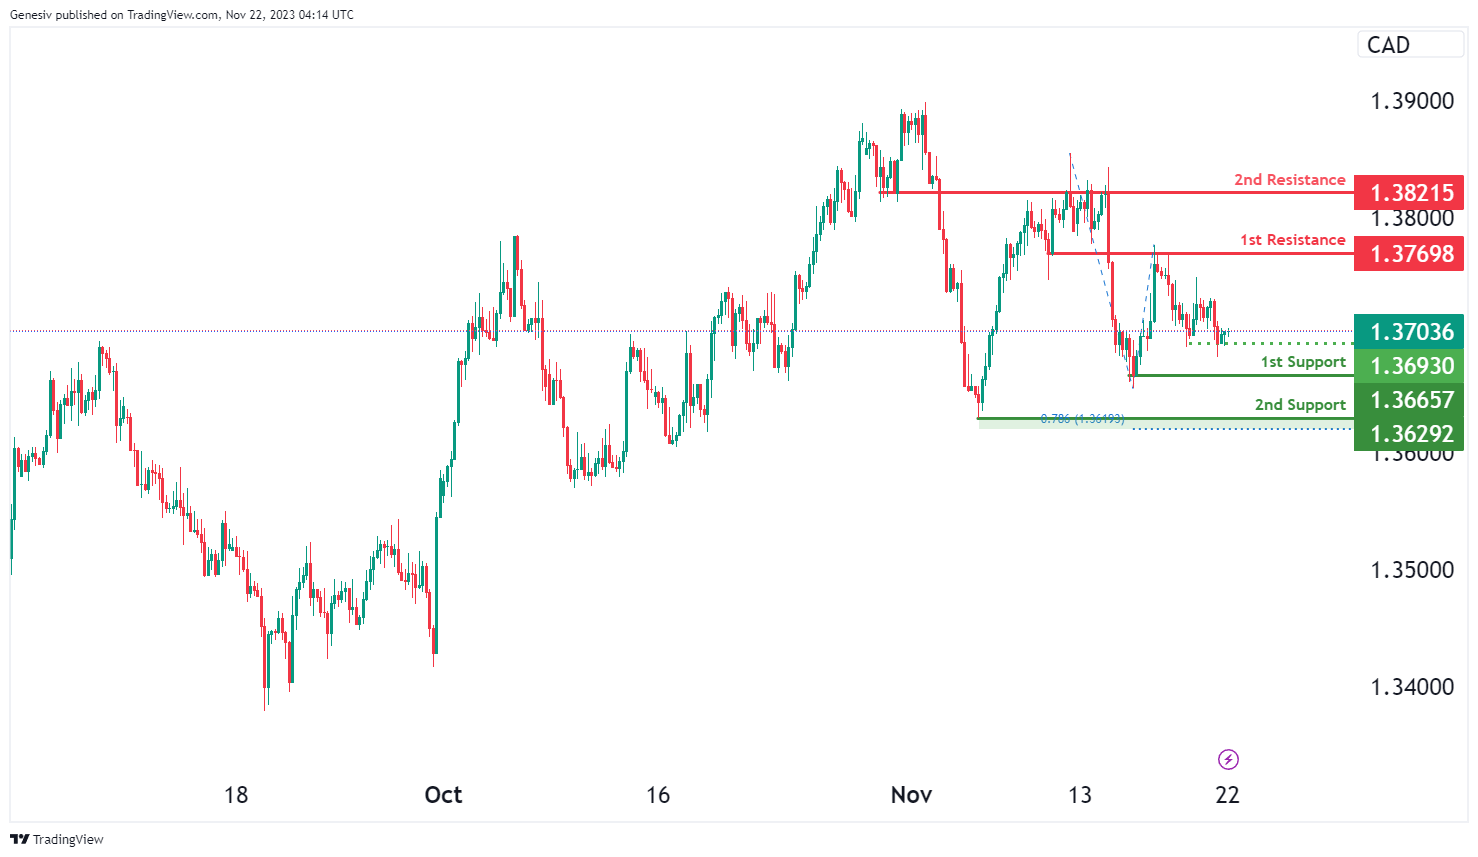
The USD/CAD chart currently exhibits an overall bearish momentum, indicating the potential for a bearish continuation towards the 1st support should price break below the intermediate support.
The intermediate support level at 1.3693 is identified as a multi-swing low support while the 1st support level at 1.3666 is also considered as a swing low support. Further below, the 2nd support level at 1.3629 is identified as a swing-low support that aligns with the 78.60% Fibonacci projection level, further reinforcing the potential for price to find support in this region.
On the resistance side, the 1st resistance level at 1.3769 is categorized as an overlap resistance. Higher up, the 2nd resistance level at 1.3822 is also noted as an overlap resistance, potentially acting as a barrier to further upward movement.
AUD/USD:
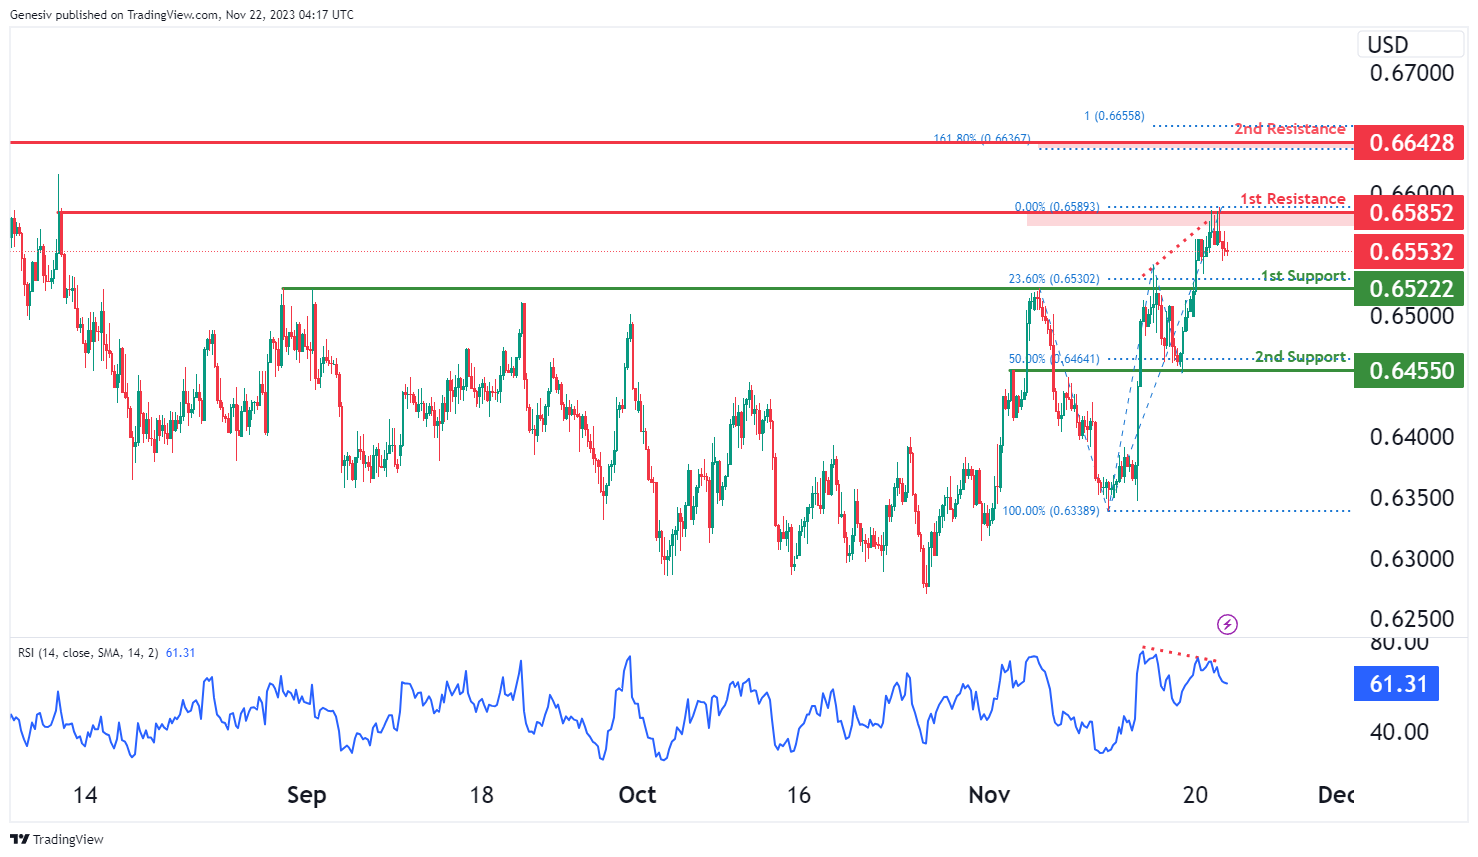
The analyzed instrument is AUD/USD, and the overall momentum of the chart is currently bearish.
There is a potential for the price to undergo a bearish continuation towards the 1st support.
The 1st support level is identified at 0.6522, and its favorable characteristic is attributed to being a pullback support, coinciding with the 23.60% Fibonacci Retracement level.
The 2nd support level is situated at 0.6455, and its favorable aspects are twofold—it is an overlap support and aligns with the 50% Fibonacci Retracement level.
On the resistance side, the 1st resistance is positioned at 0.6585, and it is considered significant due to being a multi-swing high resistance.
The 2nd resistance is located at 0.6642, and its significance is derived from being a pullback resistance, coinciding with the 161.80% Fibonacci Extension and the 100% Fibonacci Projection, indicating Fibonacci confluence.
Additionally, the Relative Strength Index (RSI) is displaying bearish divergence versus the price, suggesting that a reversal might occur soon.
NZD/USD
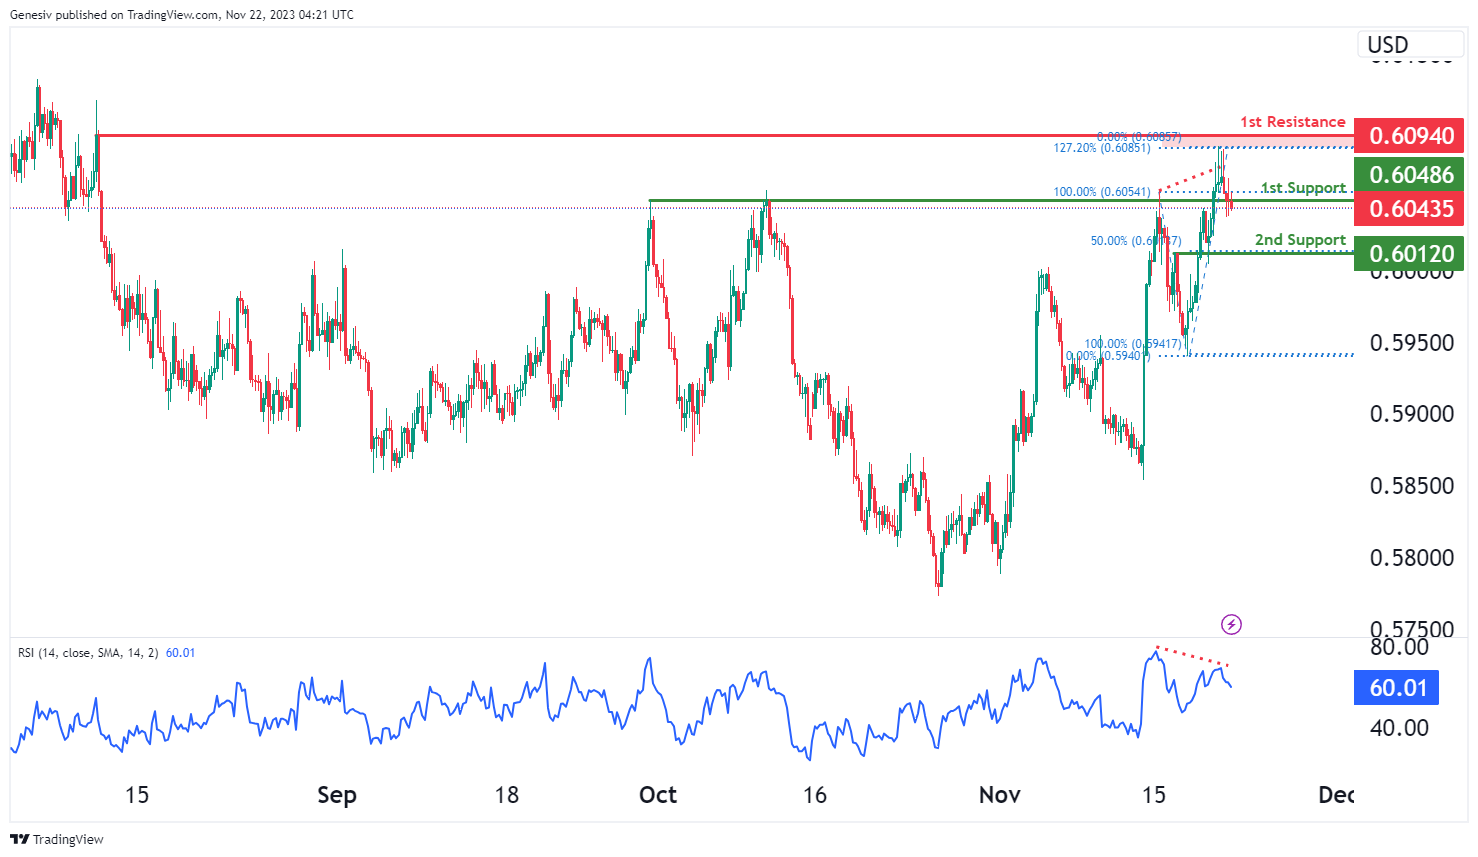
The analyzed instrument is NZD/USD, and the overall momentum of the chart is currently bearish.
There is a potential for the price to undergo a bearish break off the 1st support and subsequently drop towards the 2nd support.
The 1st support level is identified at 0.6048, and its favorable characteristic is attributed to being a pullback support.
The 2nd support level is situated at 0.6012, and its favorable aspects are twofold—it is an overlap support and aligns with the 50% Fibonacci Retracement level.
On the resistance side, the 1st resistance is positioned at 0.6094, and it is considered significant due to being a swing high resistance and coinciding with the 127.20% Fibonacci Extension.
Additionally, the Relative Strength Index (RSI) is displaying bearish divergence versus the price, suggesting that a reversal might occur soon.
DJ30:
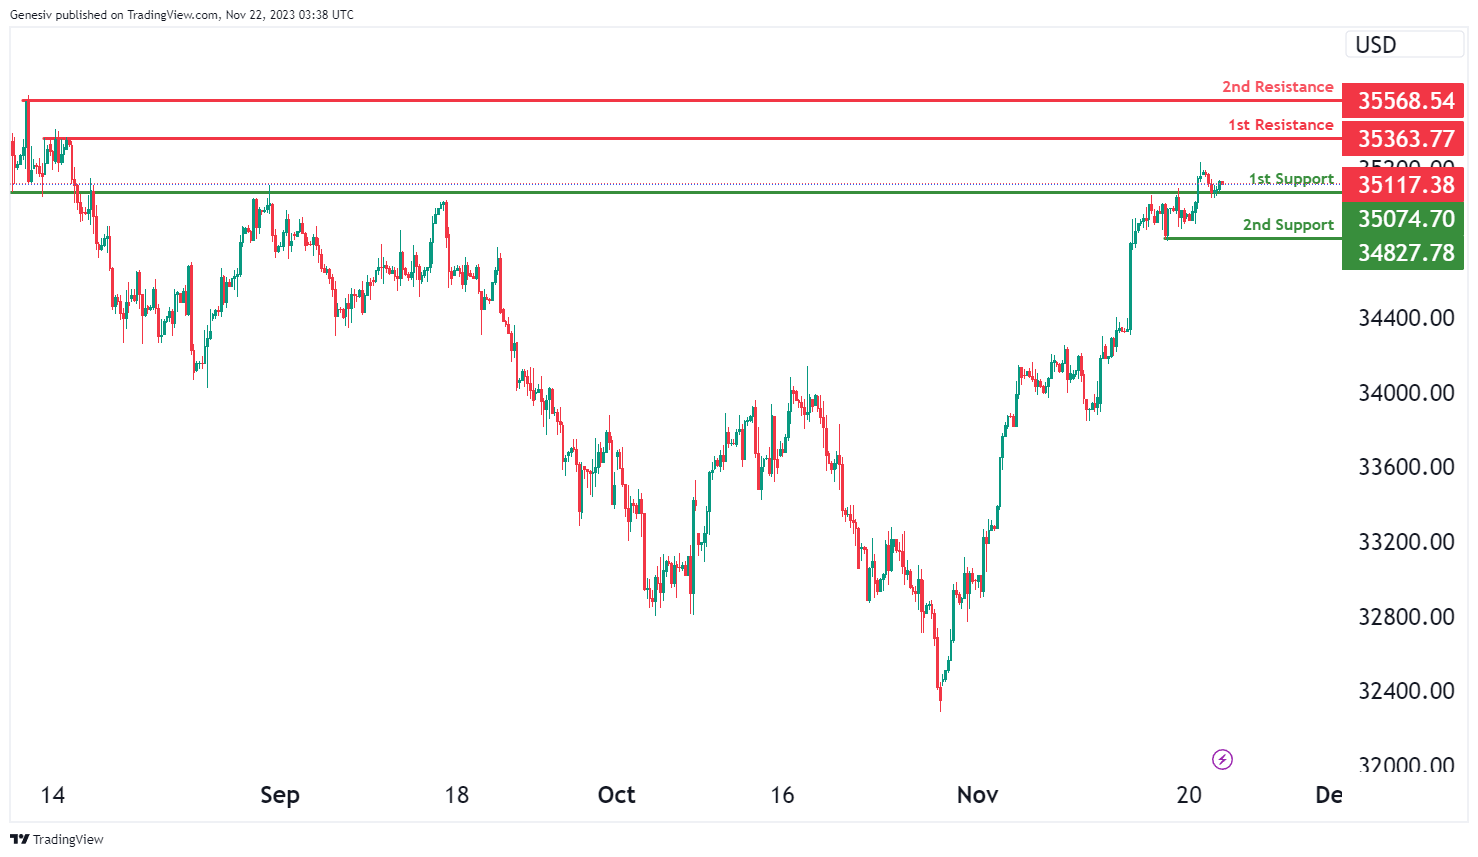
The DJ30 chart currently indicates a bullish momentum, suggesting a potential bullish bounce off the first support at 35074.70 towards the first resistance at 35363.77.
The first support at 35074.70 is identified as a pullback support, indicating a level where the price might find buying interest. Additionally, the second support at 34827.78 is recognized as a swing low support, reinforcing the potential strength of the support zone.
On the resistance side, the first resistance at 35363.77 is significant due to its multi-swing high resistance, marking a crucial level where the price might face selling pressure or potential reversals within its upward movement. Furthermore, the second resistance at 35568.54 is identified as a swing high resistance, emphasizing its importance as a potential hurdle for the price and a point where it might encounter obstacles in its bullish continuation.
GER40:
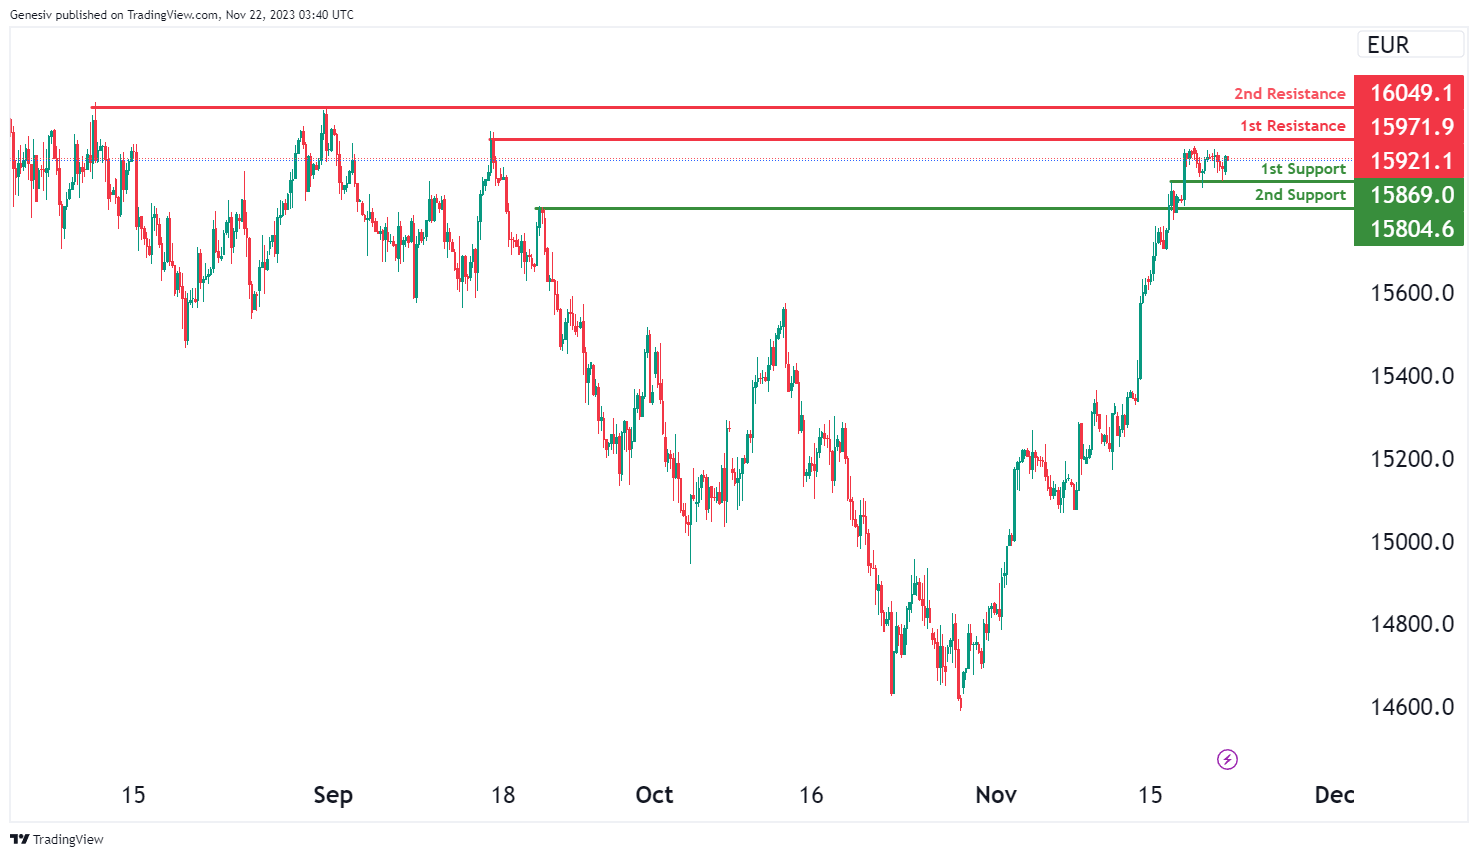
The GER40 chart currently indicates a bullish momentum, suggesting a potential bullish continuation towards the first resistance at 15971.9.
The first support at 15869.0 is identified as an overlap support, indicating a level where the price might find buying interest. Additionally, the second support at 15804.6 is recognized as another overlap support, reinforcing the potential strength of the support zone.
On the resistance side, the first resistance at 15971.9 is significant due to its swing high resistance, marking a crucial level where the price might face selling pressure or potential reversals within its upward movement. Furthermore, the second resistance at 16049.1 is identified as a multi-swing high resistance, emphasizing its importance as a potential hurdle for the price and a point where it might encounter obstacles in its bullish continuation.
.
`US500
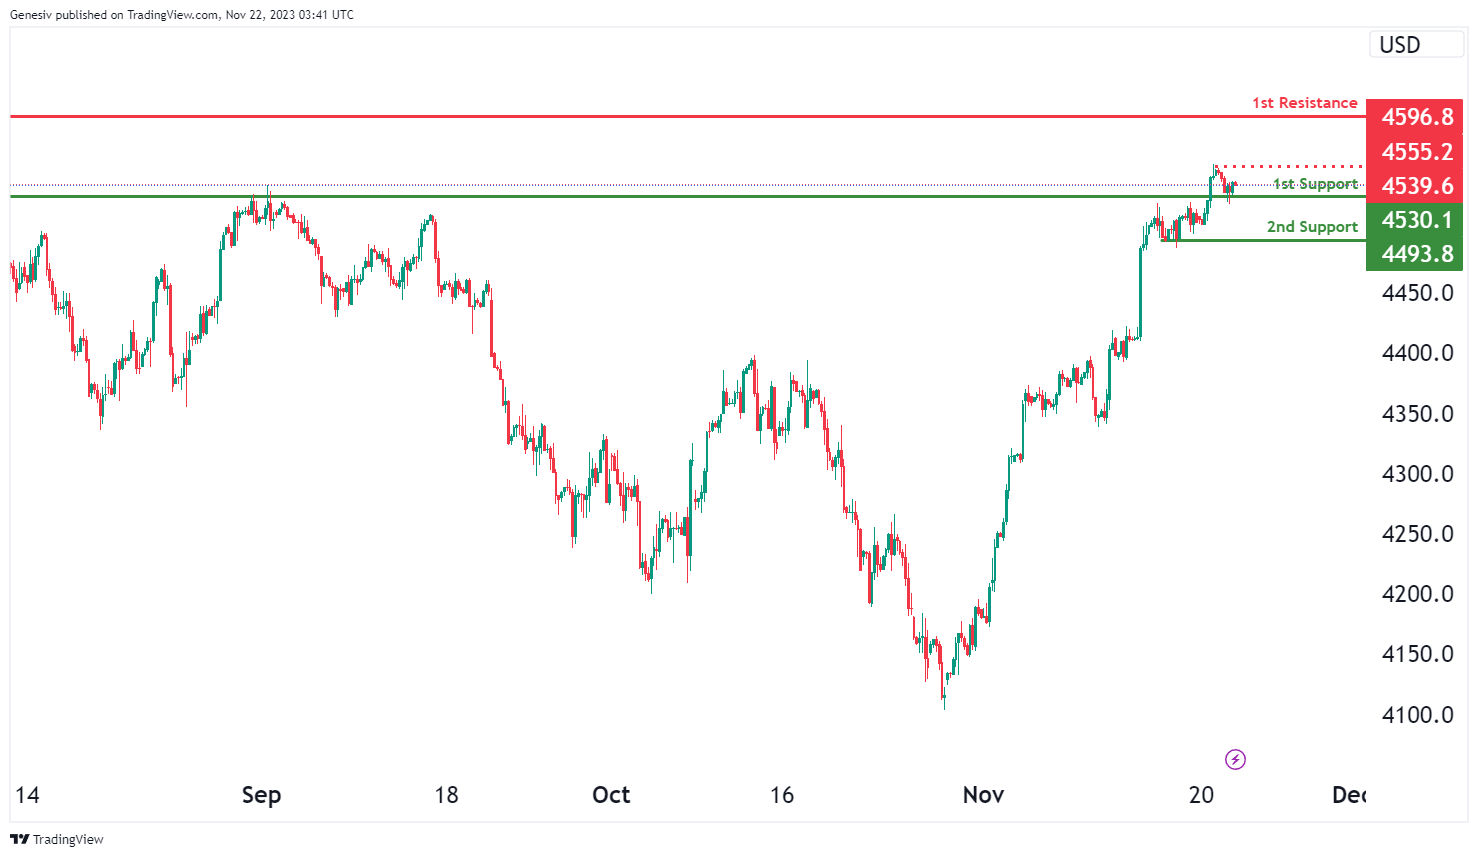
The US500 chart currently indicates a bullish momentum, suggesting a potential bullish bounce off the first support at 4530.1 towards the first resistance at 4596.8.
The first support at 4530.1 is identified as an overlap support, indicating a level where the price might find buying interest. Additionally, the second support at 4493.8 is recognized as a multi-swing low support, reinforcing the potential strength of the support zone.
On the resistance side, the first resistance at 4596.8 is significant due to its swing high resistance, marking a crucial level where the price might face selling pressure or potential reversals within its upward movement. Furthermore, the intermediate resistance at 4555.2 is identified as a swing high resistance, emphasizing its importance as a potential hurdle for the price and a point where it might encounter obstacles in its bullish continuation.
BTC/USD:
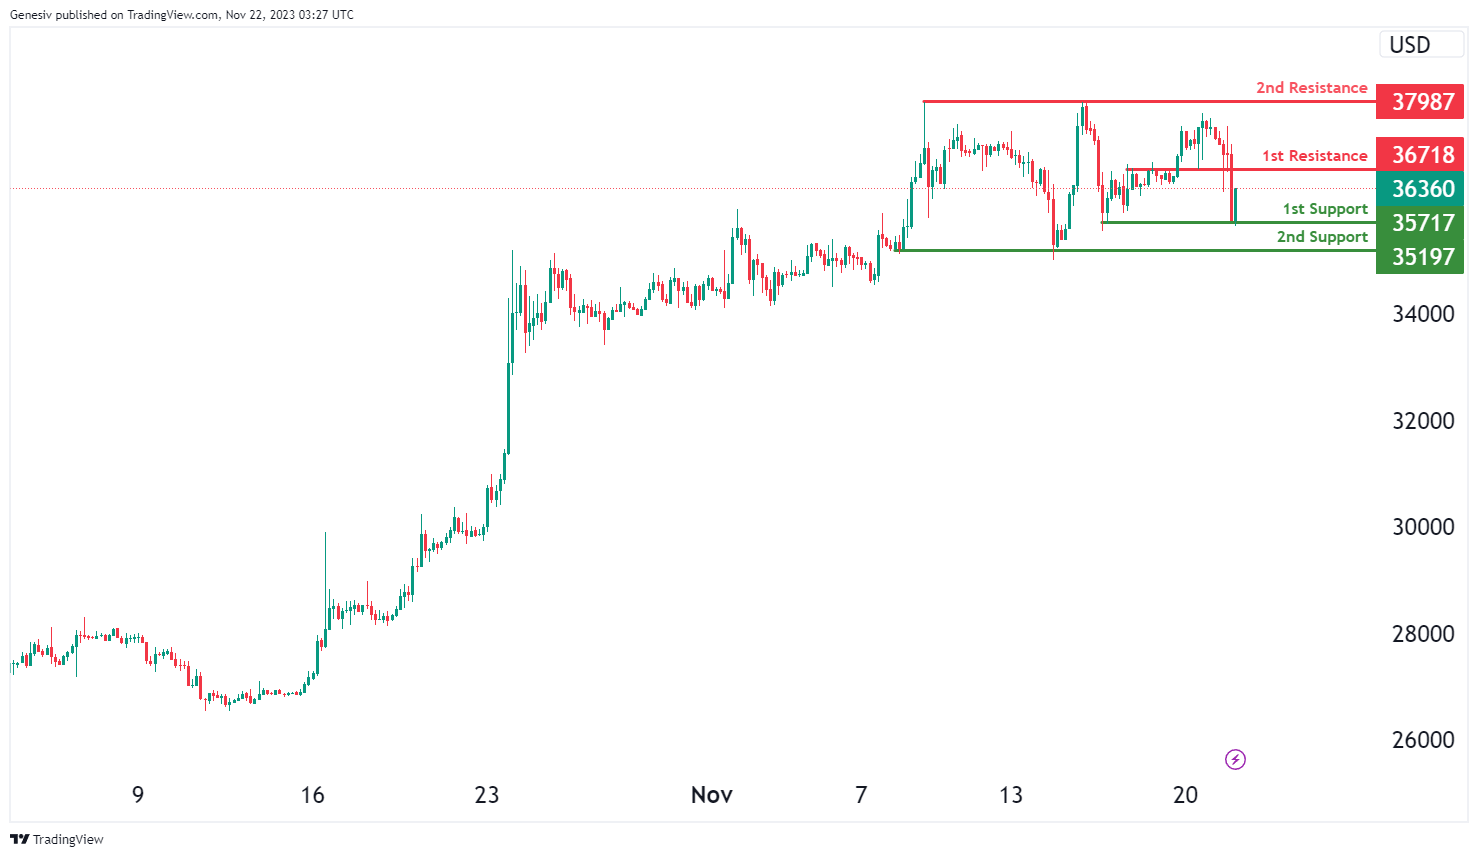
The BTC/USD chart currently indicates a bullish momentum, suggesting a potential bullish continuation towards the first resistance at 36718.
The first support at 35717 is identified as a multi-swing low support, indicating a level where the price might find buying interest. Additionally, the second support at 35197 is recognized as another multi-swing low support, reinforcing the potential strength of the support zone.
On the resistance side, the first resistance at 36718 is significant due to its pullback resistance, marking a crucial level where the price might face selling pressure or potential reversals within its upward movement. Furthermore, the second resistance at 37987 is identified as a multi-swing high resistance, emphasizing its importance as a potential hurdle for the price and a point where it might encounter obstacles in its bullish continuation.
ETH/USD:
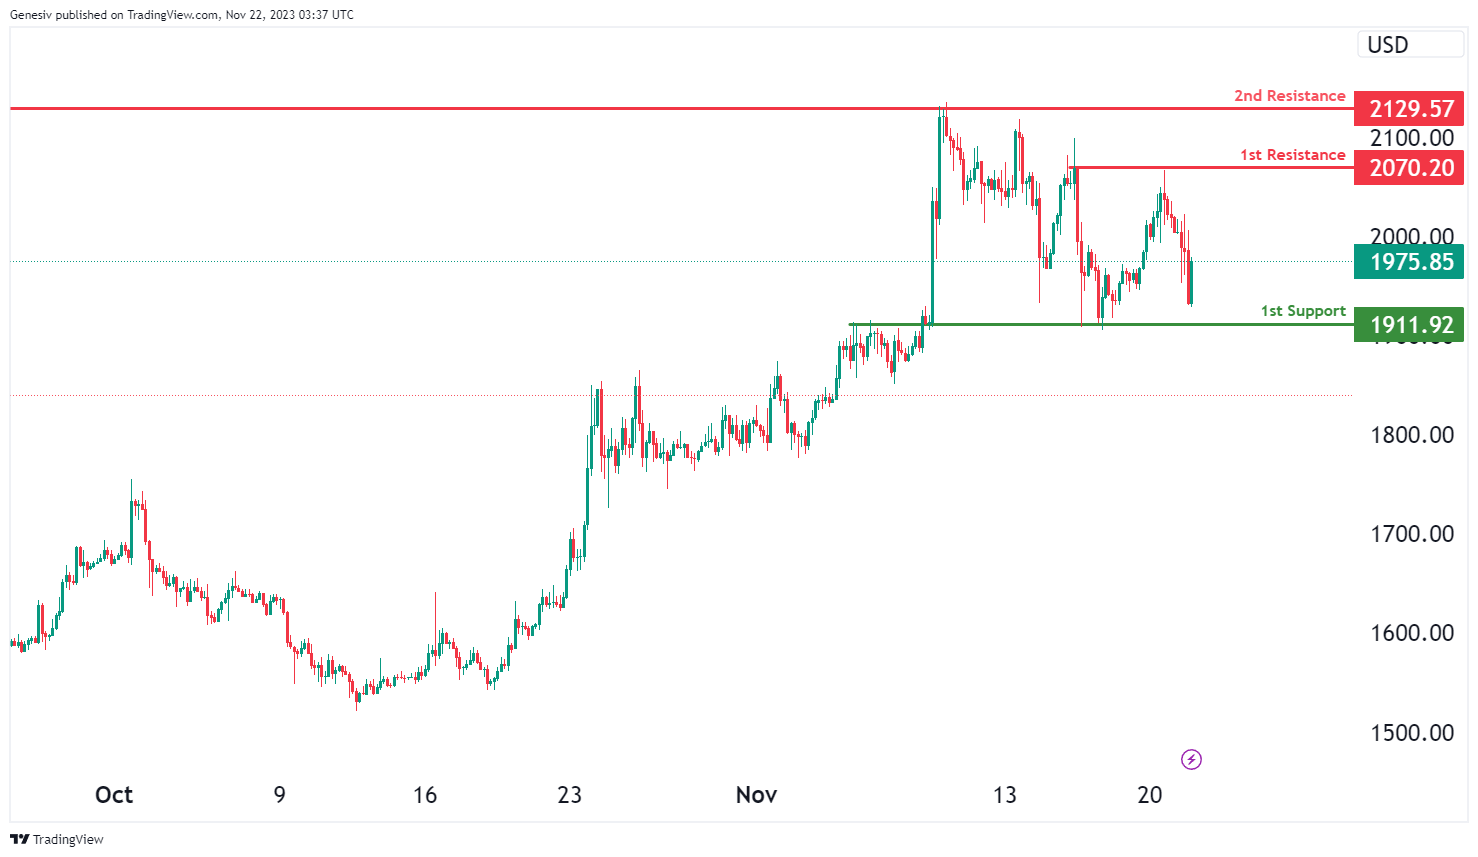
The ETH/USD chart currently indicates a bullish momentum, suggesting a potential bullish continuation towards the first resistance at 2070.20.
The first support at 1911.92 is identified as an overlap support, indicating a level where the price might find buying interest. Additionally, the second support at 1859.43 is recognized as another overlap support, reinforcing the potential strength of the support zone.
On the resistance side, the first resistance at 2070.20 is significant due to its multi-swing high resistance, marking a crucial level where the price might face selling pressure or potential reversals within its upward movement. Furthermore, the second resistance at 2129.57 is identified as another multi-swing high resistance, emphasizing its importance as a potential hurdle for the price and a point where it might encounter obstacles in its bullish continuation.
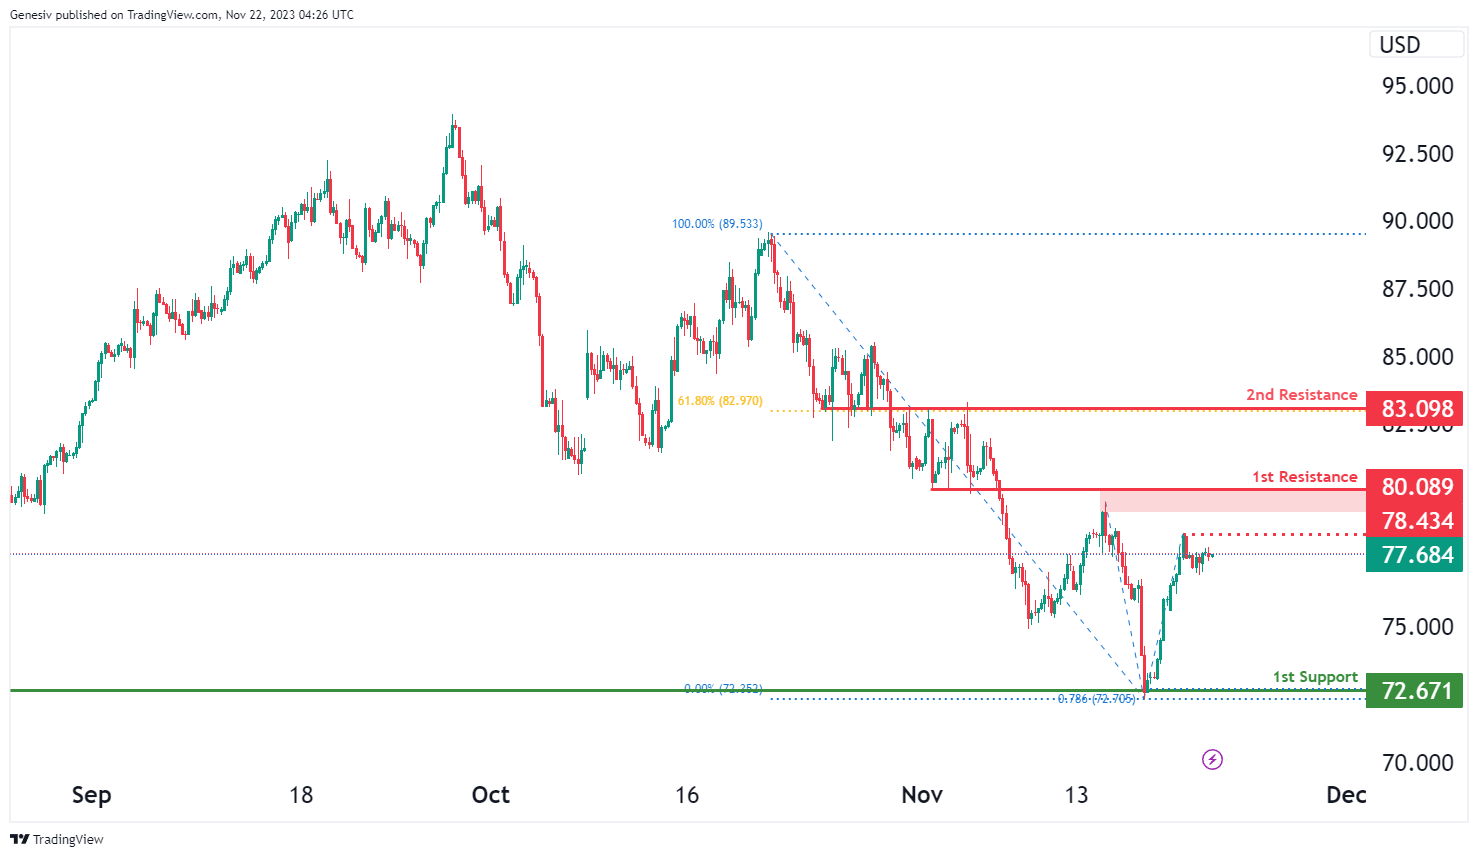
WTI/USD:
The analyzed instrument is WTI, and the overall momentum of the chart is currently bearish.
There is a potential for the price to undergo a bearish continuation towards the 1st support.
The 1st support level is identified at 72.67, and its favorable characteristics include being an overlap support and coinciding with the 78.60% Fibonacci Projection.
On the resistance side, the 1st resistance is positioned at 80.08, and it is considered significant due to being a pullback resistance.
The 2nd resistance is located at 83.09, and its significance is attributed to being an overlap resistance and aligning with the 61.80% Fibonacci Retracement.
An intermediate resistance is also noted at 78.43, and its significance is derived from being a swing high resistance.
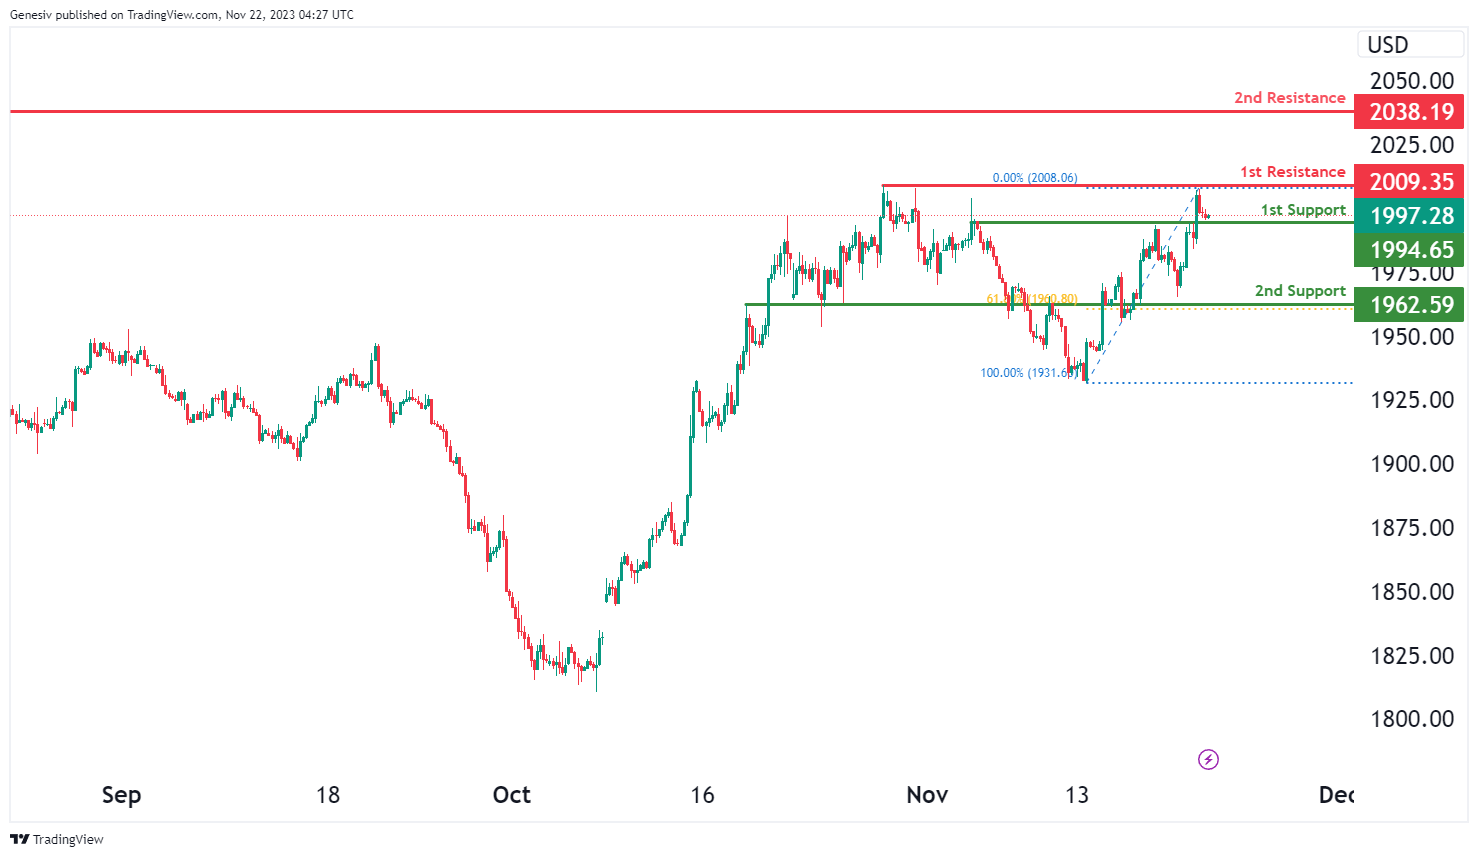
XAU/USD (GOLD):
The analyzed instrument is XAU/USD, and the overall momentum of the chart is currently bullish.
There is a potential for the price to make a bullish bounce off the 1st support and head towards the 1st resistance.
The 1st support level is identified at 1994.65, and its favorable characteristic is attributed to being a pullback support.
The 2nd support level is situated at 1962.59, and its favorable aspect is twofold—it is a pullback support and coincides with the 61.80% Fibonacci Retracement level.
On the resistance side, the 1st resistance is positioned at 2009.35, and it is considered significant due to being a multi-swing high resistance.
The 2nd resistance is located at 2038.19, and its significance is derived from being a swing high resistance.
The accuracy, completeness and timeliness of the information contained on this site cannot be guaranteed. IC Markets does not warranty, guarantee or make any representations, or assume any liability regarding financial results based on the use of the information in the site.
News, views, opinions, recommendations and other information obtained from sources outside of www.icmarkets.com, used in this site are believed to be reliable, but we cannot guarantee their accuracy or completeness. All such information is subject to change at any time without notice. IC Markets assumes no responsibility for the content of any linked site.
The fact that such links may exist does not indicate approval or endorsement of any material contained on any linked site. IC Markets is not liable for any harm caused by the transmission, through accessing the services or information on this site, of a computer virus, or other computer code or programming device that might be used to access, delete, damage, disable, disrupt or otherwise impede in any manner, the operation of the site or of any user’s software, hardware, data or property.


