
DXY:
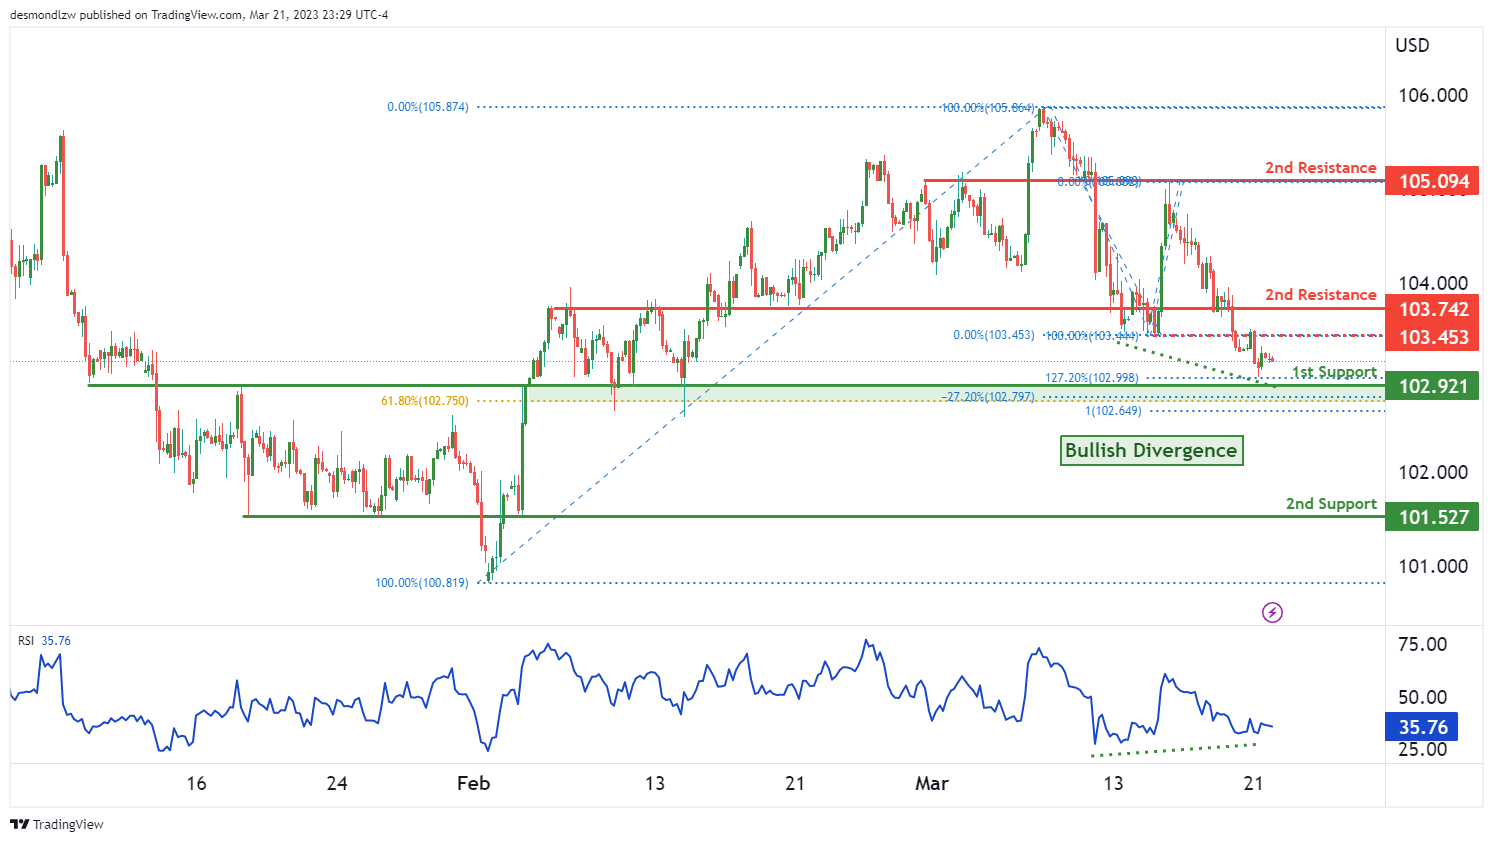
The DXY chart indicates that it currently has a bullish momentum. This is supported by an ascending support line and an Ichimoku cloud support, suggesting that prices could continue to rise further along with the momentum.
There is a major support at 102.92, which is an overlap support and has a 61.80% Fibonacci retracement lining up with it. In the event that prices bounce off this support level, they could rise to the first resistance at 103.74, which is an overlap resistance level.
Furthermore, there is an intermediate resistance level at 103.45, which is between the current price and the first resistance level. Should prices break through this intermediate resistance, it could trigger a stronger bullish acceleration towards the first resistance level.
However, if prices break the first support level, the next level it could drop to is the second support at 101.52, which is also an overlap support level.
It is also worth noting that the RSI is displaying bullish divergence versus price, which could suggest a potential bullish reversal soon.
EUR/USD:
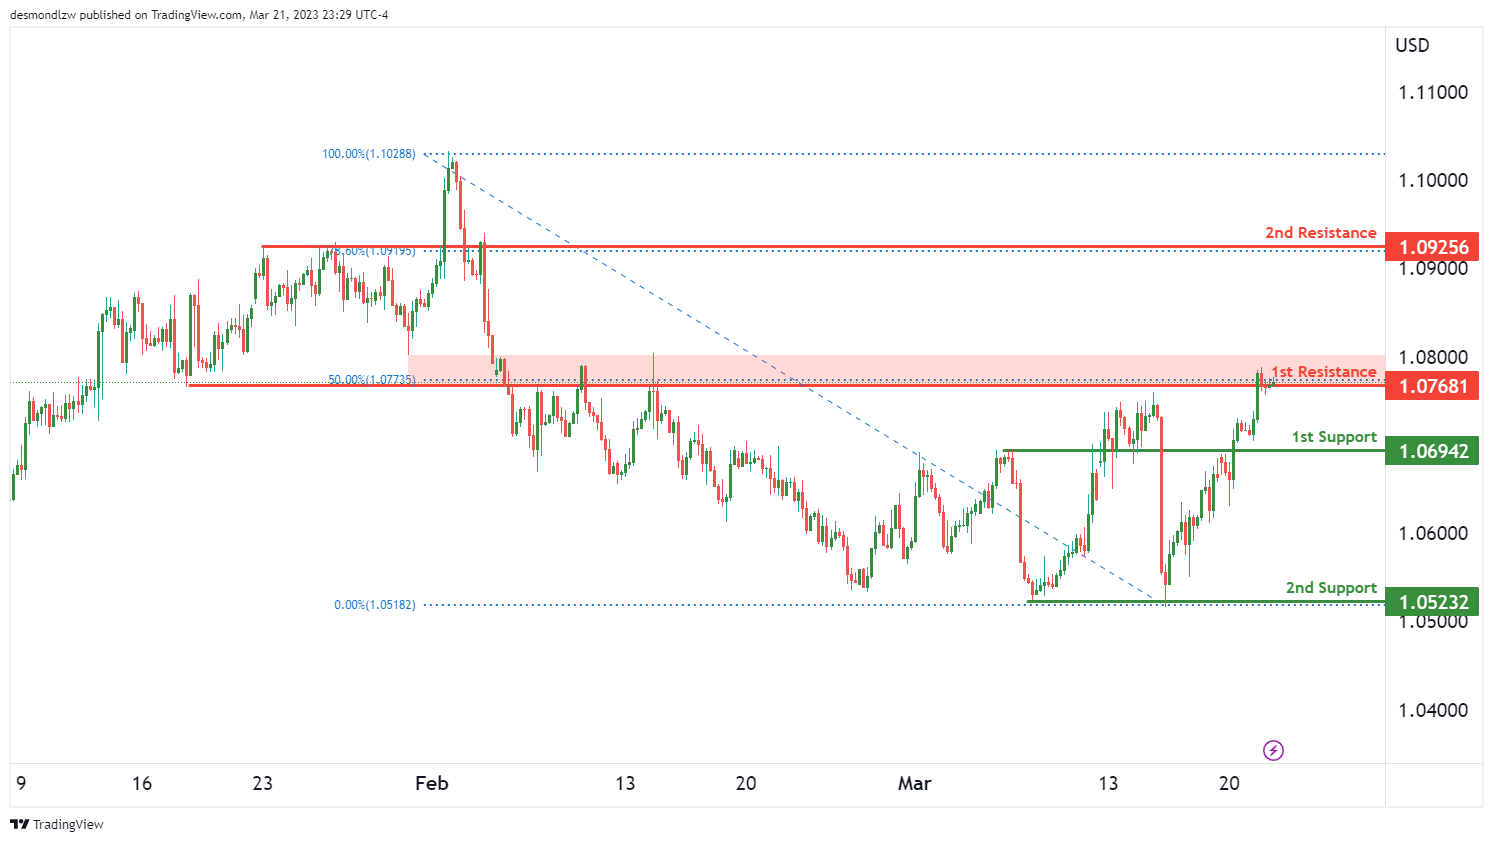
Overall momentum of the chart: Bearish
Price is currently exhibiting bearish momentum and may potentially react negatively to the first resistance level, leading to a drop towards the first support level.
The first support level is at 1.0694, which is a strong overlap support level. If price breaks below this level, it could reach the second support level at 1.0523, which is a multi-swing low support level.
On the other hand, the first resistance level at 1.0768 is a significant overlap resistance level and also aligns with the 50% Fibonacci retracement level. If price were to break above this level, it could potentially head towards the second resistance level at 1.0925, which is another important overlap resistance level.
GBP/USD:
The GBP/USD chart is currently displaying bullish momentum, with potential for a bullish bounce off the 1st support at 1.2194 and a move towards the 1st resistance at 1.2287. The overall momentum of the chart is bullish, with a clear ascending trend line indicating continued upward momentum.
The 1st support level at 1.2194 is an overlap support with a 23.6% Fibonacci retracement lining up with it, making it a strong level of support. The 2nd support level at 1.2045 is also an overlap support, this time with a 50% Fibonacci retracement.
On the resistance side, the 1st resistance level at 1.2287 is another overlap level and provides a good opportunity for prices to reverse direction. The 2nd resistance level at 1.2440 is a multi-swing high resistance level that may provide additional resistance if prices break through the 1st resistance level.
It is worth noting that the overall bullish momentum could be halted if prices break below the ascending trend line or below the 1st support level. Additionally, the absence of any clear Ichimoku cloud signals means that the momentum of the chart is not being driven by any particular directional trend.
USD/CHF:
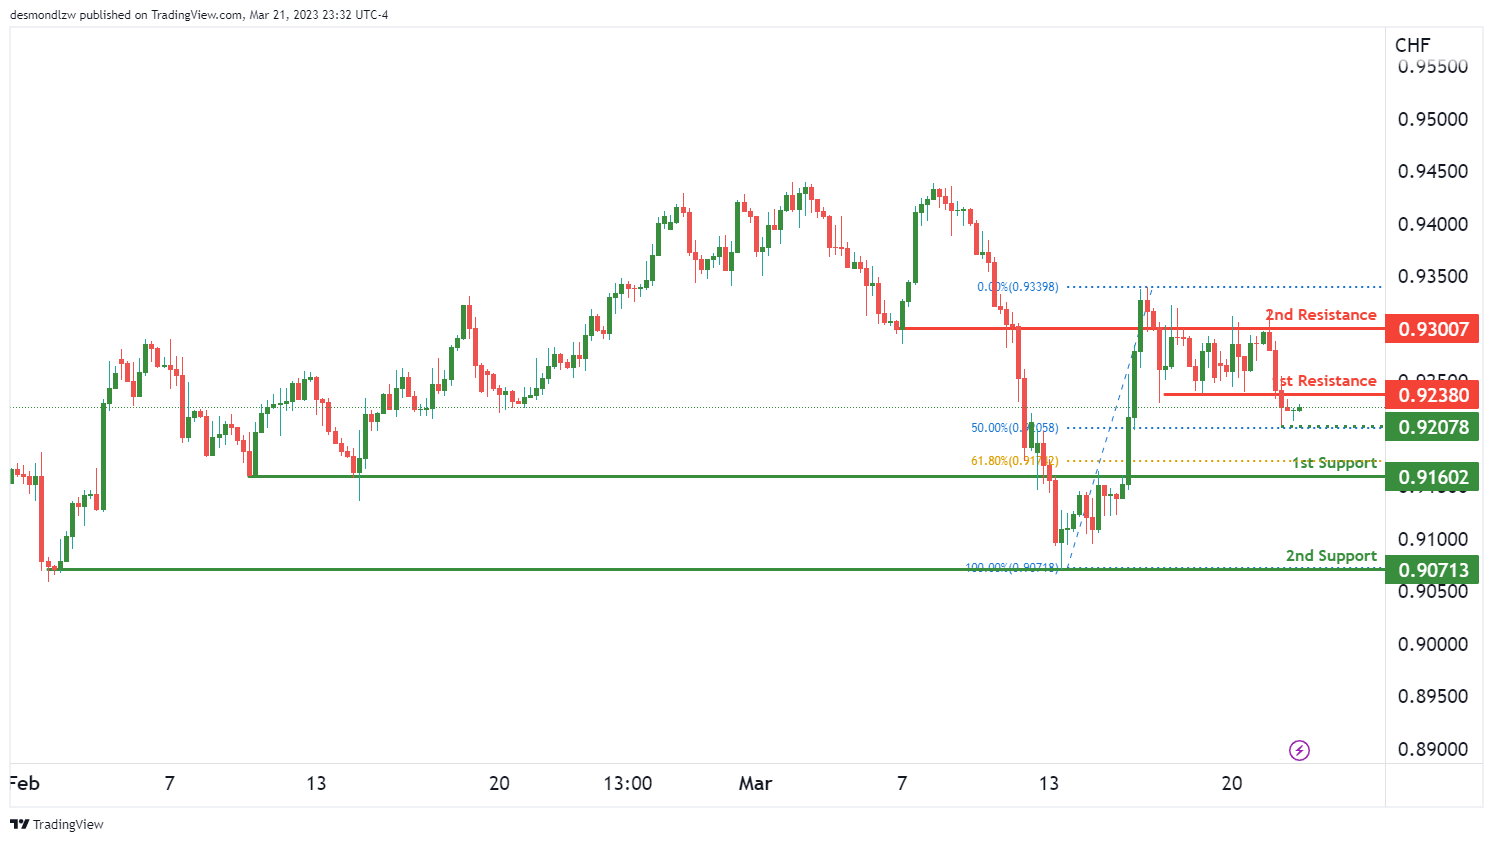
The USD/CHF chart is showing a bearish momentum, which suggests a potential drop from resistance to support levels. The overall bias is bearish, and price is below the Ichimoku cloud, which indicates a strong bearish momentum.
The first resistance level is at 0.9238, which is an overlap resistance level. This resistance level could trigger a bearish reaction and push prices down towards the first support level at 0.9160. The 0.9238 resistance level is also significant as it coincides with the descending trend line, which further strengthens the bearish momentum.
If prices drop below the 0.9160 support level, the next support level is at 0.9071. This level is a multi-swing low support level, and it has previously acted as a strong support level. A bounce from this support level could trigger a potential bullish move towards the 0.9238 resistance level.
It’s worth noting that there is an intermediate support level at 0.9307, which is a 50% Fibonacci retracement level. If prices break below this support level, it could lead to a stronger bearish acceleration towards the 0.9160 support level.

USD/JPY:
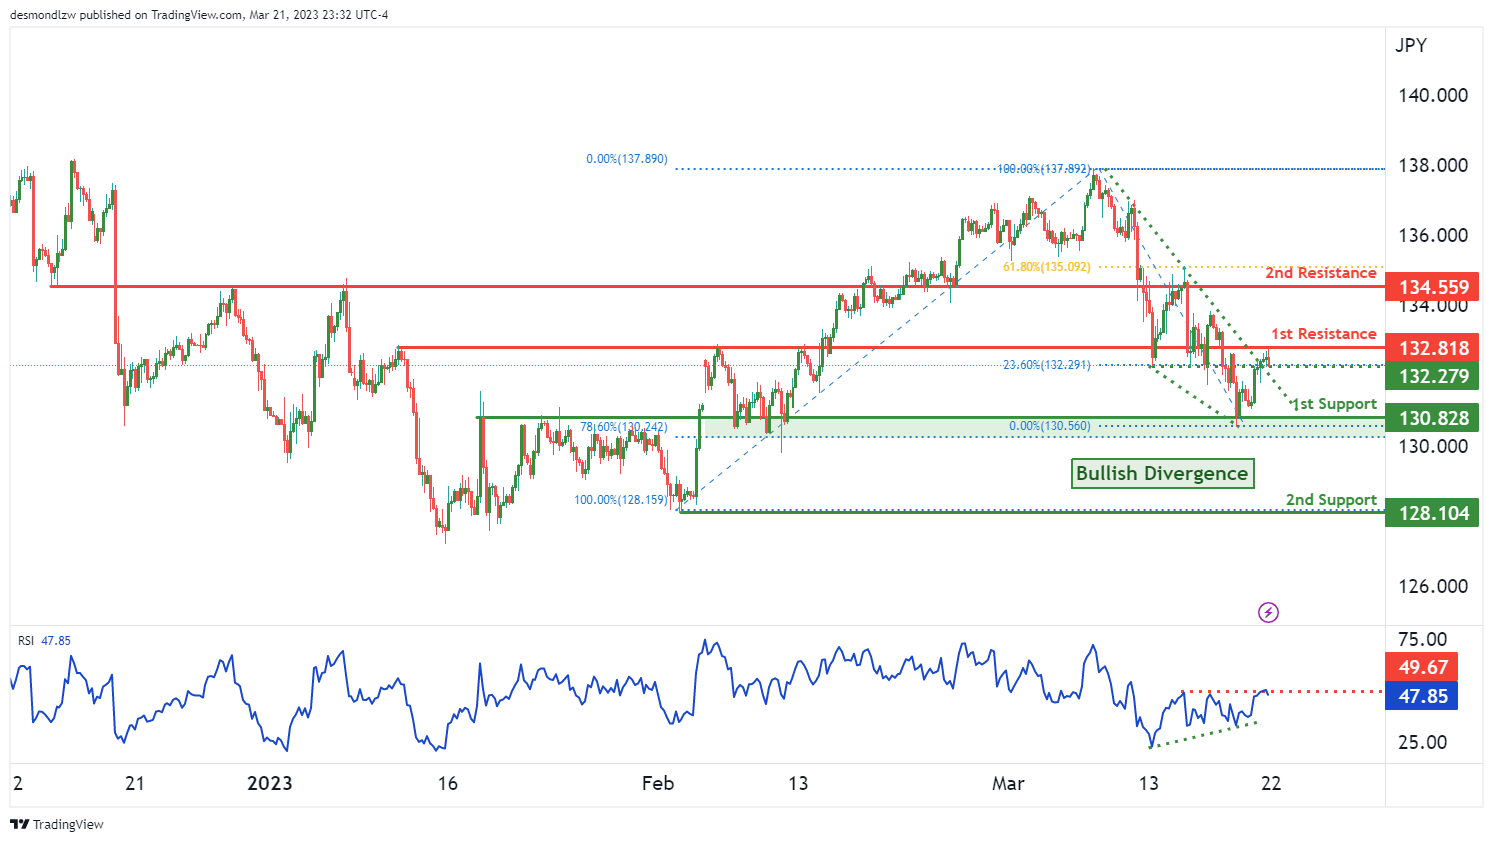
The USD/JPY chart shows a bullish momentum as it is currently above a major ascending trend line, indicating that further bullish momentum may be seen. If price breaks through the 1st resistance level, it could rise to the 2nd resistance level.
The 1st support level is at 130.82, which is a strong overlap support and has a 78.60% Fibonacci retracement lining up with it. The 2nd support level is at 128.10, which is a multi-swing low support that price has bounced off multiple times in the past.
The 1st resistance level is at 132.81, which is an overlap resistance and has a 23.60% Fibonacci retracement lining up with it. The 2nd resistance level is at 134.55, which is an overlap resistance and has a 61.80% Fibonacci retracement lining up with it.
It’s worth noting that the RSI is displaying bullish divergence versus price, suggesting that a bounce may occur soon.
AUD/USD:
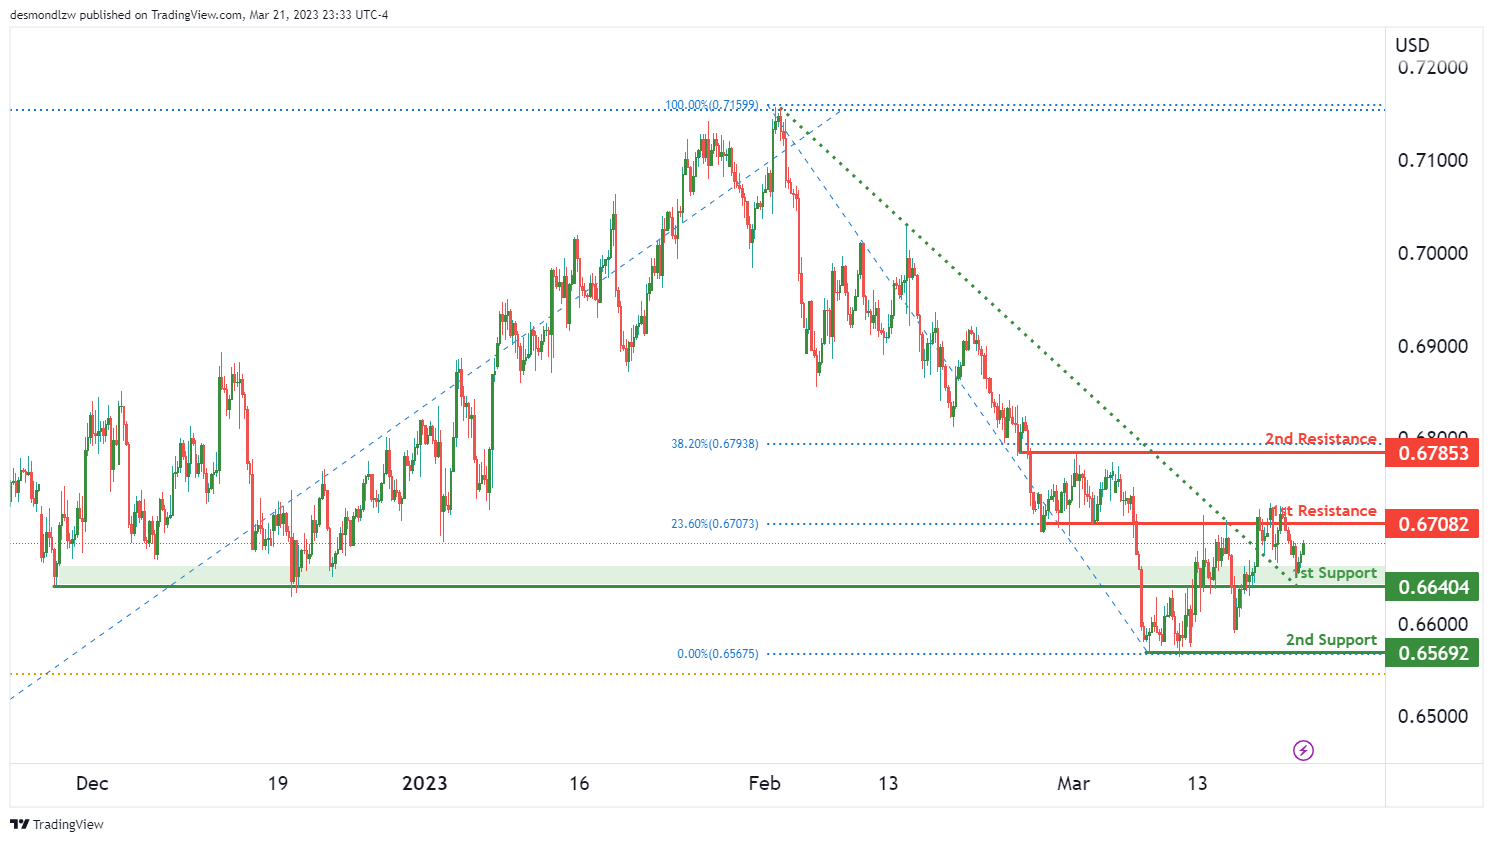
Based on the analysis, the AUD/USD chart is showing bullish momentum, which has been contributed by the price breaking above a descending resistance line, indicating the potential for a bullish move. The first support level is at 0.6640, which is a significant overlap support. The second support level is at 0.6569, which is a multi-swing low support. The first resistance level is at 0.6708, which coincides with a 23.60% Fibonacci retracement, making it a strong overlap resistance. The second resistance level is at 0.6785, which is another overlap resistance and also lines up with a 38.20% Fibonacci retracement.
The potential move for the AUD/USD is a bullish continuation towards the first resistance level at 0.6708. If the price can break through this resistance, it could potentially rise towards the second resistance level at 0.6785. However, in case the price drops, it could find support at the first support level of 0.6640, and a break below that could lead to a drop towards the second support level at 0.6569.
It is worth noting that there is a strong bullish momentum on the chart, which could potentially continue to drive the price higher
NZD/USD:
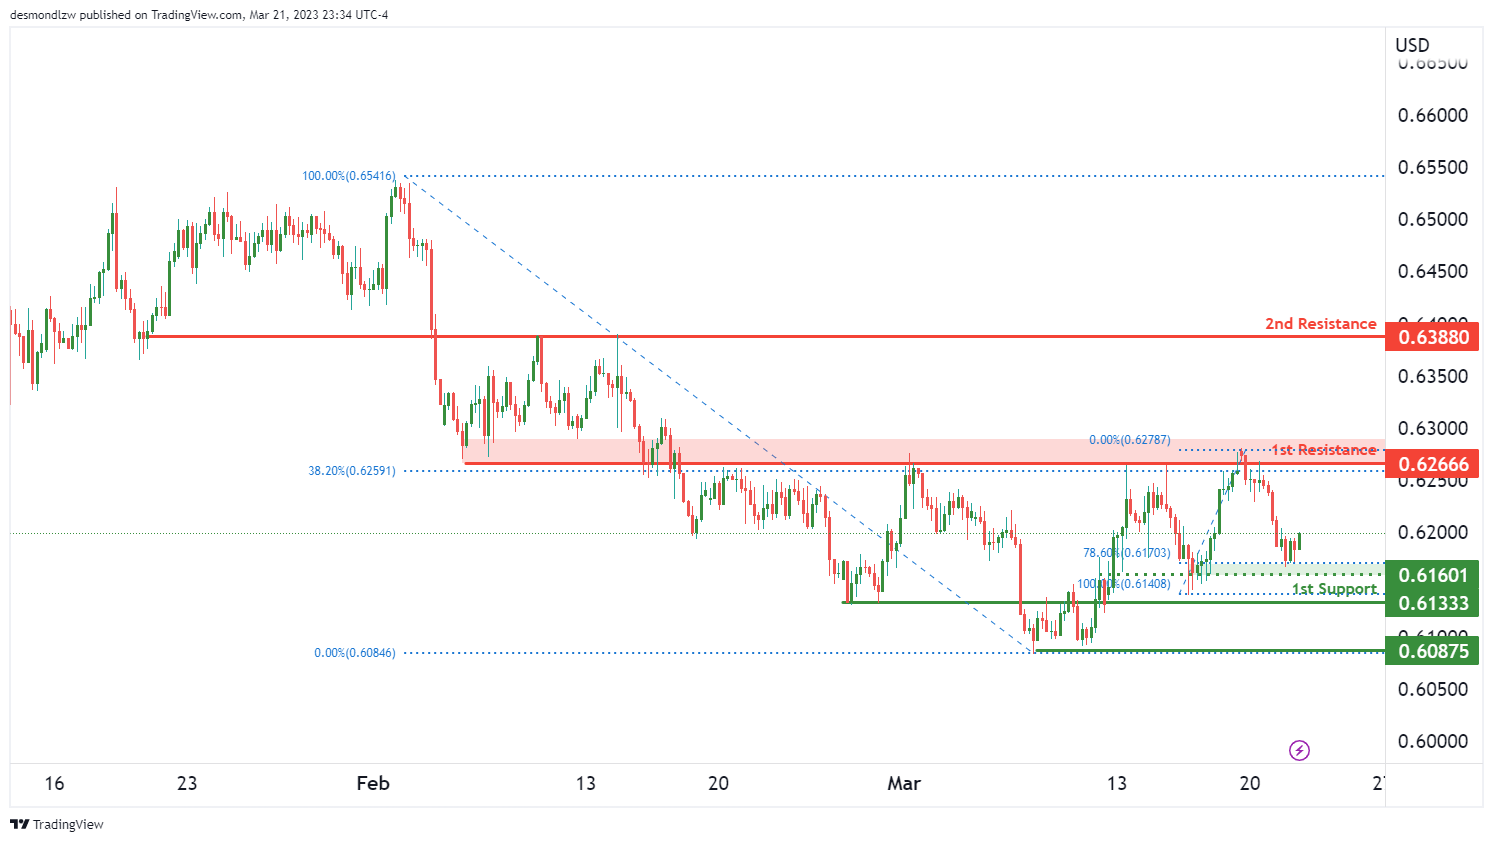
NZD/USD has a bullish overall momentum with potential for a bullish continuation towards the first resistance. The first support is at 0.6133, which is an overlap support, while the second support is at 0.6087, a multi-swing low support. The first resistance at 0.6266 is an overlap resistance and lines up with the 38.20% Fibonacci retracement. There is also a second resistance at 0.6388 which is also an overlap resistance. An intermediate support level is at 0.6160, which lines up with the 78.60% Fibonacci retracement. Traders should keep an eye on these levels for potential price reactions.
It’s worth noting that NZD/USD has a bullish overall momentum, and the price has the potential to continue its upward trend. However, traders should also be cautious and watch for any potential pullbacks or reversals. A break below the support levels could indicate a change in the momentum, while a break above the resistance levels could lead to further bullish momentum.
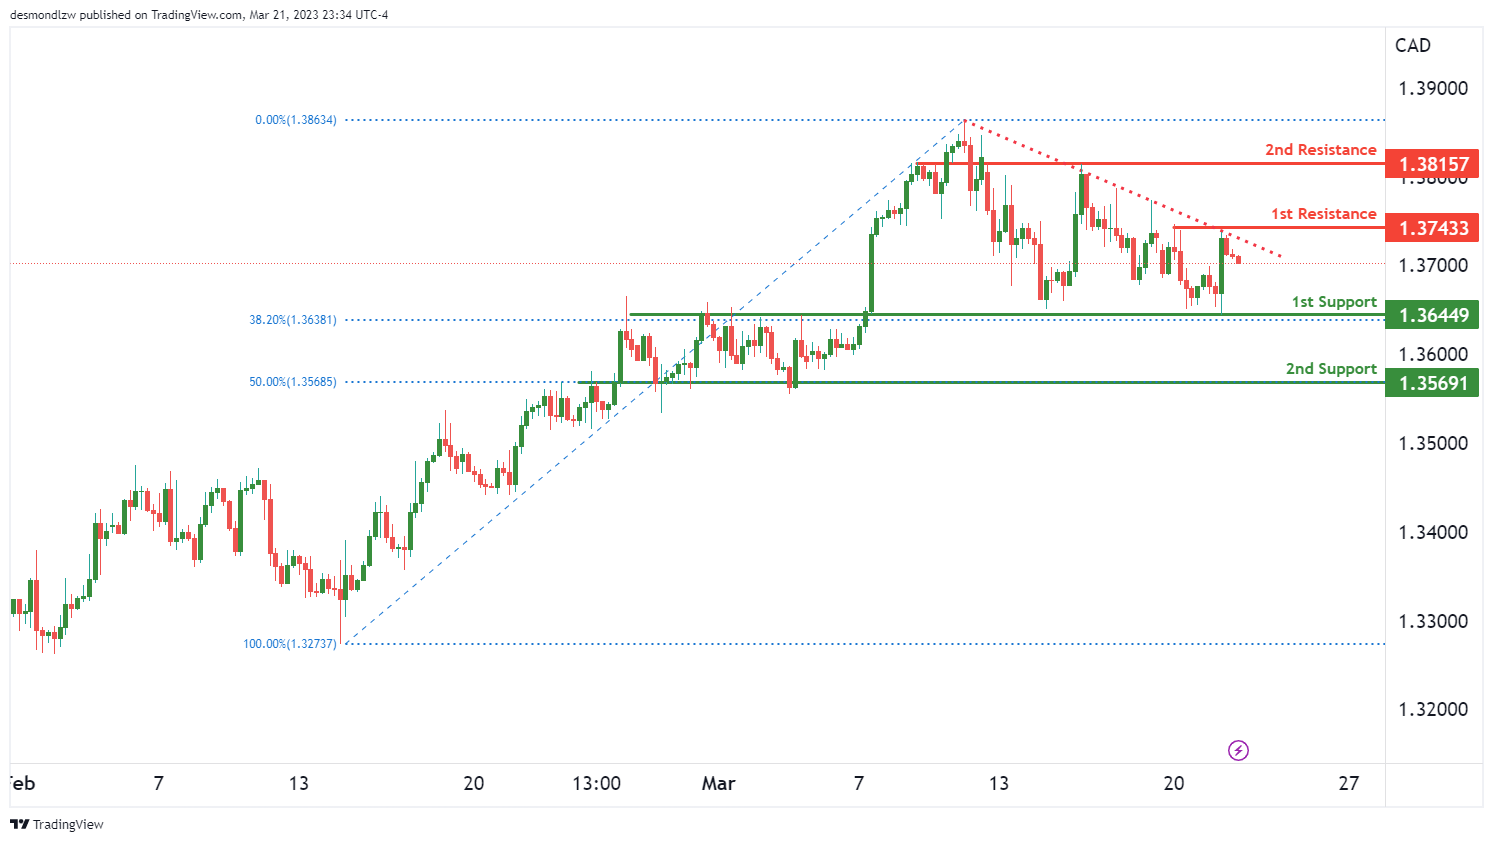
USD/CAD:
NZD/USD has a bullish overall momentum with potential for a bullish continuation towards the first resistance. The first support is at 0.6133, which is an overlap support, while the second support is at 0.6087, a multi-swing low support. The first resistance at 0.6266 is an overlap resistance and lines up with the 38.20% Fibonacci retracement. There is also a second resistance at 0.6388 which is also an overlap resistance. An intermediate support level is at 0.6160, which lines up with the 78.60% Fibonacci retracement. Traders should keep an eye on these levels for potential price reactions.
It’s worth noting that NZD/USD has a bullish overall momentum, and the price has the potential to continue its upward trend. However, traders should also be cautious and watch for any potential pullbacks or reversals. A break below the support levels could indicate a change in the momentum, while a break above the resistance levels could lead to further bullish momentum.
DJ30:
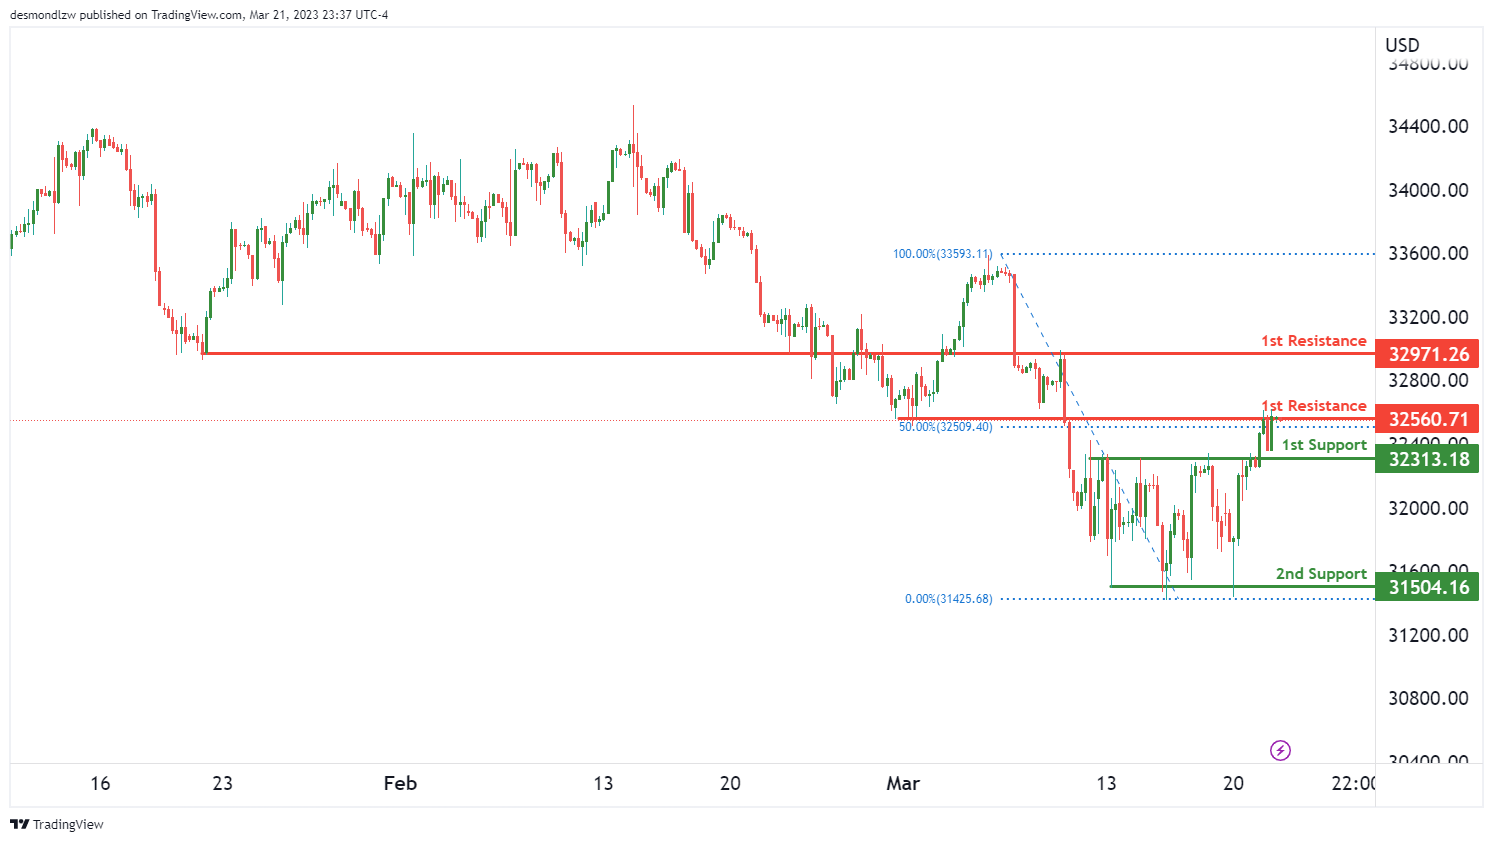
The DJ30 chart is currently showing bearish momentum with potential for a bearish reaction off the 1st resistance and a drop towards the 1st support. The overall trend of the chart suggests that prices could continue to fall in the short term.
The 1st support level is at 32313, which is a strong overlap support level. If prices were to break this level, the next support level would be at 31504, which is a multi-swing low support level.
On the resistance side, the 1st resistance is at 32560, which is an overlap resistance level and also has a 50% Fibonacci retracement lining up with it. If prices were to break this level, the next resistance level would be at 32971, which is also an overlap resistance level.
It’s important to note that if prices break above the 1st resistance, this could potentially signal a shift towards a bullish momentum. However, the current bearish momentum suggests that prices will likely continue to fall towards the 1st support level.
Overall, the DJ30 chart is showing bearish momentum with potential for a drop towards the 1st support level at 32313. It’s important to monitor the chart for any potential breakouts above the 1st resistance level, which could signal a shift towards a bullish momentum.
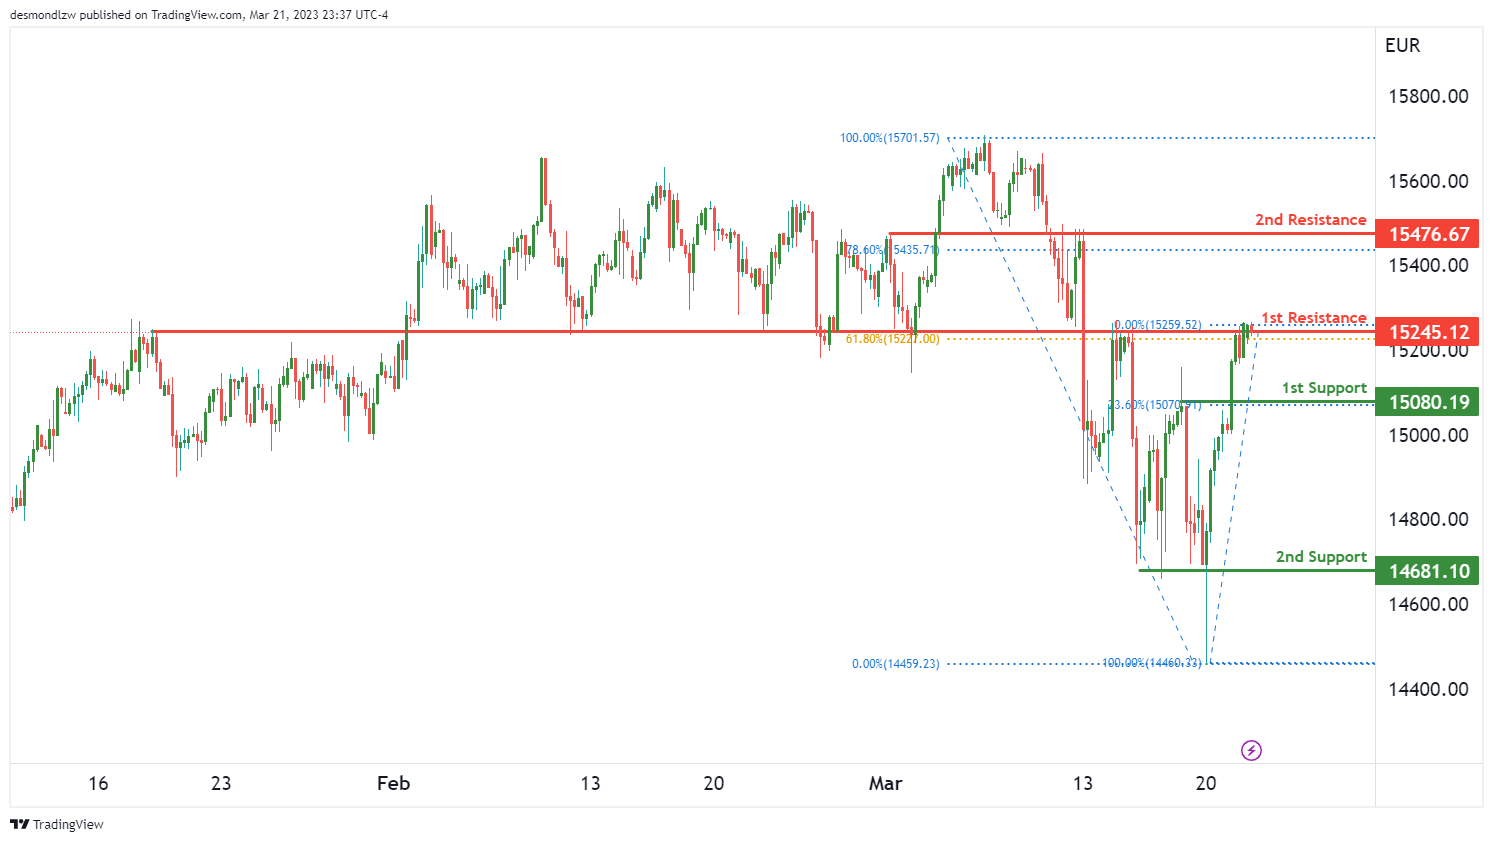
GER30:
The GER30 chart is showing bearish momentum, which could continue if the price reacts negatively to the 1st resistance level and drops towards the 1st support level.
The 1st support is at 15080 and is considered a pullback support, as it aligns with the 23.60% Fibonacci retracement level. If the price bounces from this support level, it could potentially rise towards the 1st resistance level at 15245, which is an overlap resistance level and lines up with the 61.80% Fibonacci retracement.
However, if the price breaks through the 1st support level, it could drop to the 2nd support at 147, which is a multi-swing low support level.
On the other hand, if the price manages to break through the 1st resistance level, it could potentially rise towards the 2nd resistance level at 15476, which is an overlap resistance level and lines up with the 78.60% Fibonacci retracement.
Overall, the GER30 chart is showing bearish momentum, and a drop towards the 1st support level could occur if the price reacts negatively to the 1st resistance level. However, if the price manages to break through the resistance level, there is potential for a bullish move towards the 2nd resistance level.
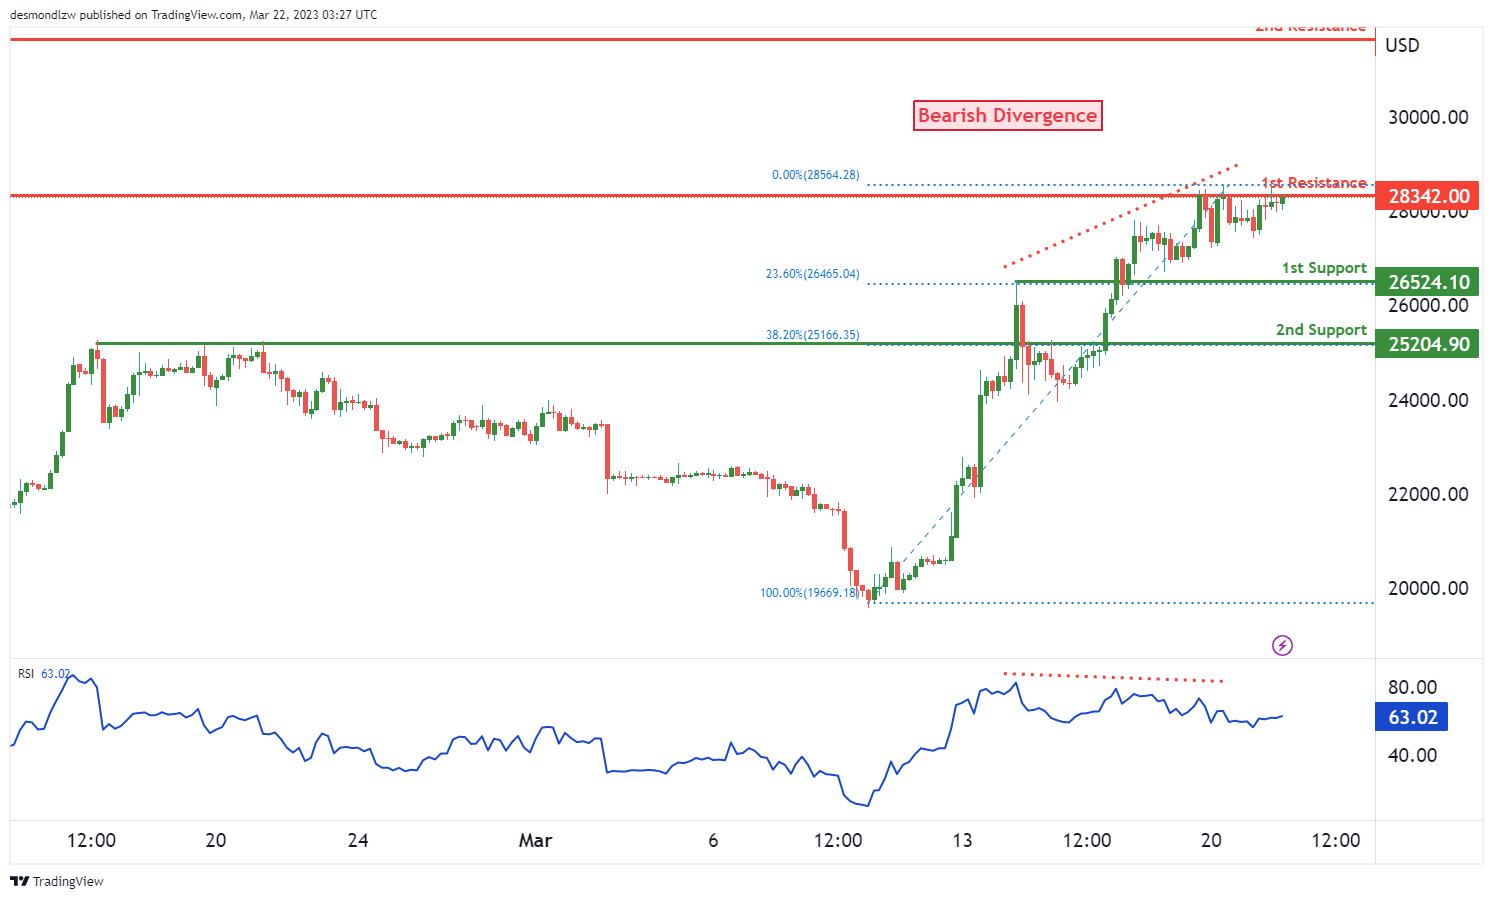
BTC/USD:
The overall momentum of the BTC/USD chart is bearish, with the potential for a bearish reaction off the 1st resistance and a drop to the 1st support. The 1st support level is at 26524, which is an overlap support and coincides with the 23.60% Fibonacci retracement. The 2nd support level is at 25204, which is also an overlap support and lines up with the 38.20% Fibonacci retracement.
On the other hand, the 1st resistance level is at 28342, which is an overlap resistance. The 2nd resistance level is at 31662, which is a swing high resistance. If the price were to break through the 1st resistance level, it could potentially rise towards the 2nd resistance level.
The RSI is also displaying bearish divergence versus price, which suggests that a reversal might occur soon.
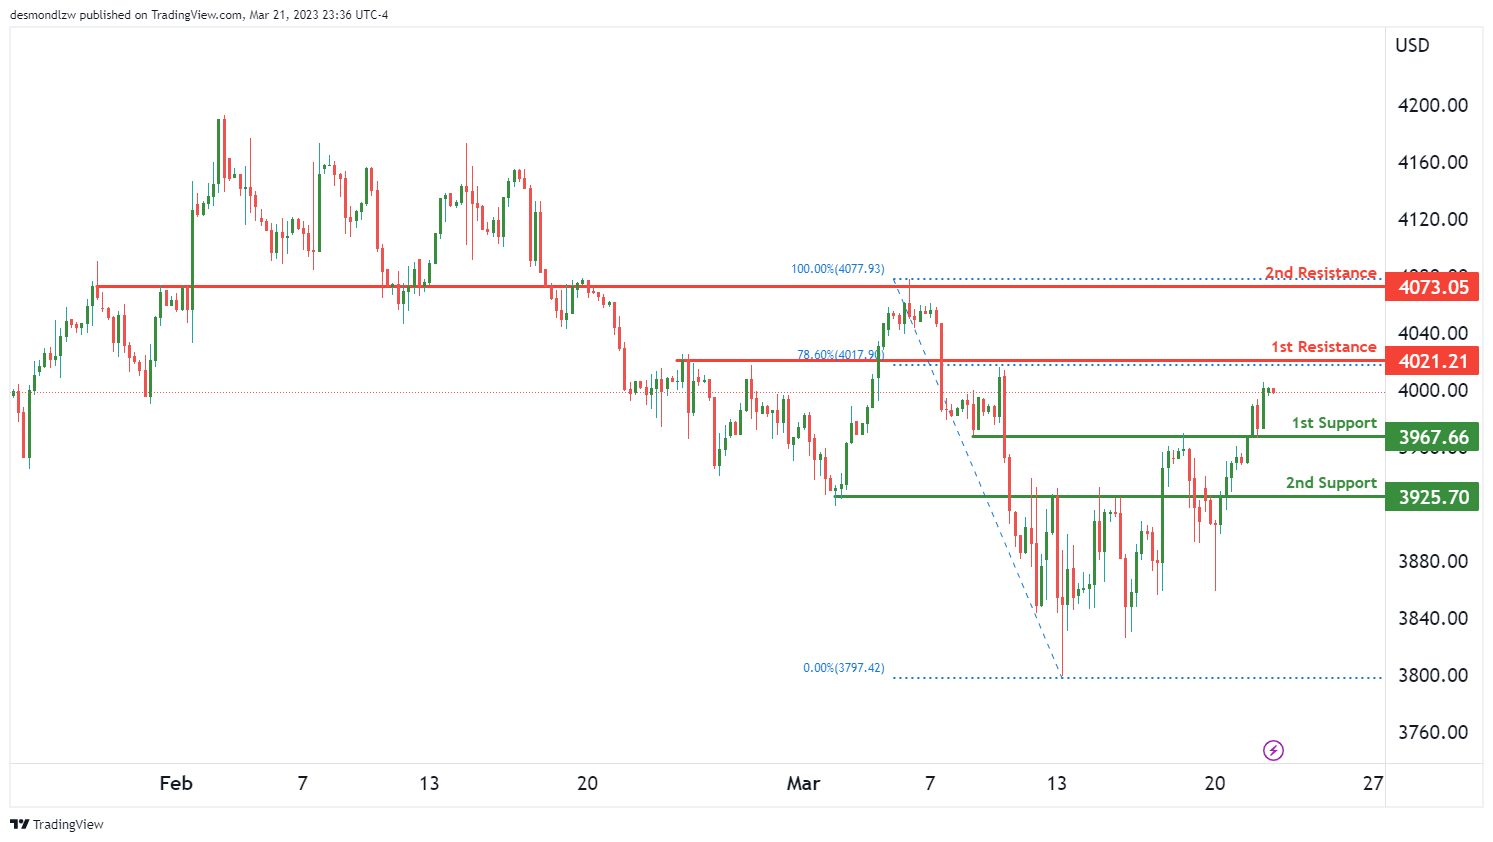
US500
The US500 chart is showing strong bullish momentum, with price potentially continuing its upward trend towards the 1st resistance level at 4021.
Support and Resistance Levels
The first support level is at 3967, which is an overlap support. The second support level is at 3925, which is also an overlap support.
The first resistance level is at 4021, which is an overlap resistance and has a 78.60% Fibonacci retracement lining up with it. The second resistance level is at 4073, which is a swing high resistance.
Overall Momentum
The overall momentum of the chart is bullish, indicating that prices may rise further. However, if the price were to break the 3967 support level, it could trigger a drop towards the 2nd support level at 3925.
ance levels, with the 1st resistance level acting as a significant barrier for the price to overcome.
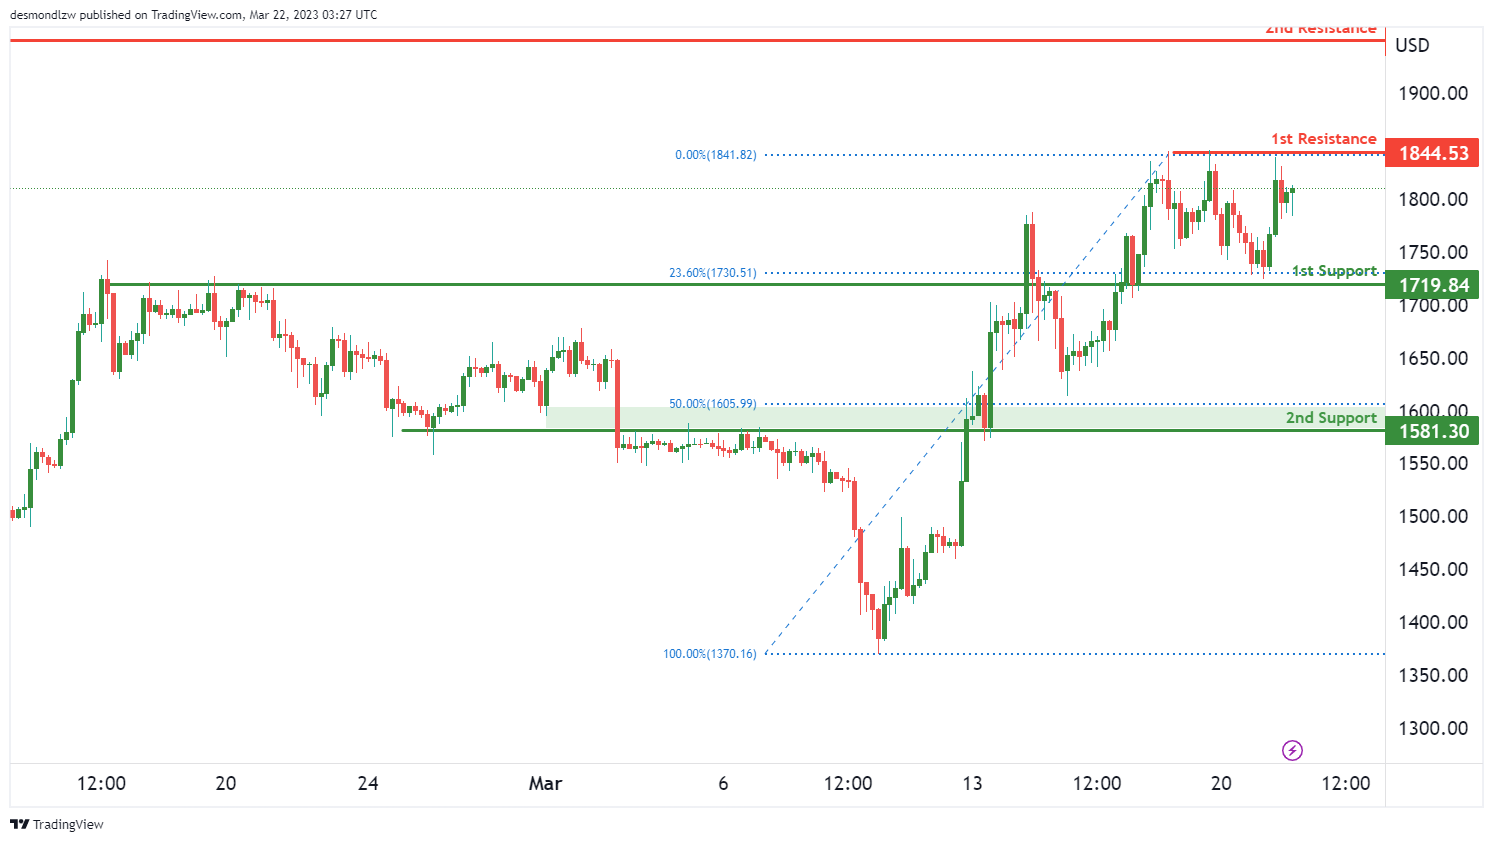
ETH/USD:
Ethereum’s chart is currently showing bearish momentum. However, there might be a short-term rise towards the first resistance before a potential reversal and drop towards the first support.
The first support level is at 1719.84, which is an overlap support and a 23.60% Fibonacci retracement level. A bounce off this level could potentially happen, leading to a short-term bullish move.
If the bullish move occurs, the first resistance level to watch out for is at 1844.53, which is a multi-swing high resistance. A rise towards this level could be expected in the short term.
However, a potential reversal and drop towards the first support might occur afterwards. The second support level is at 1518.30, which is another overlap support, and a 50% Fibonacci retracement level.
On the upside, the second resistance level to watch out for is at 1950.25, which is a swing high resistance.
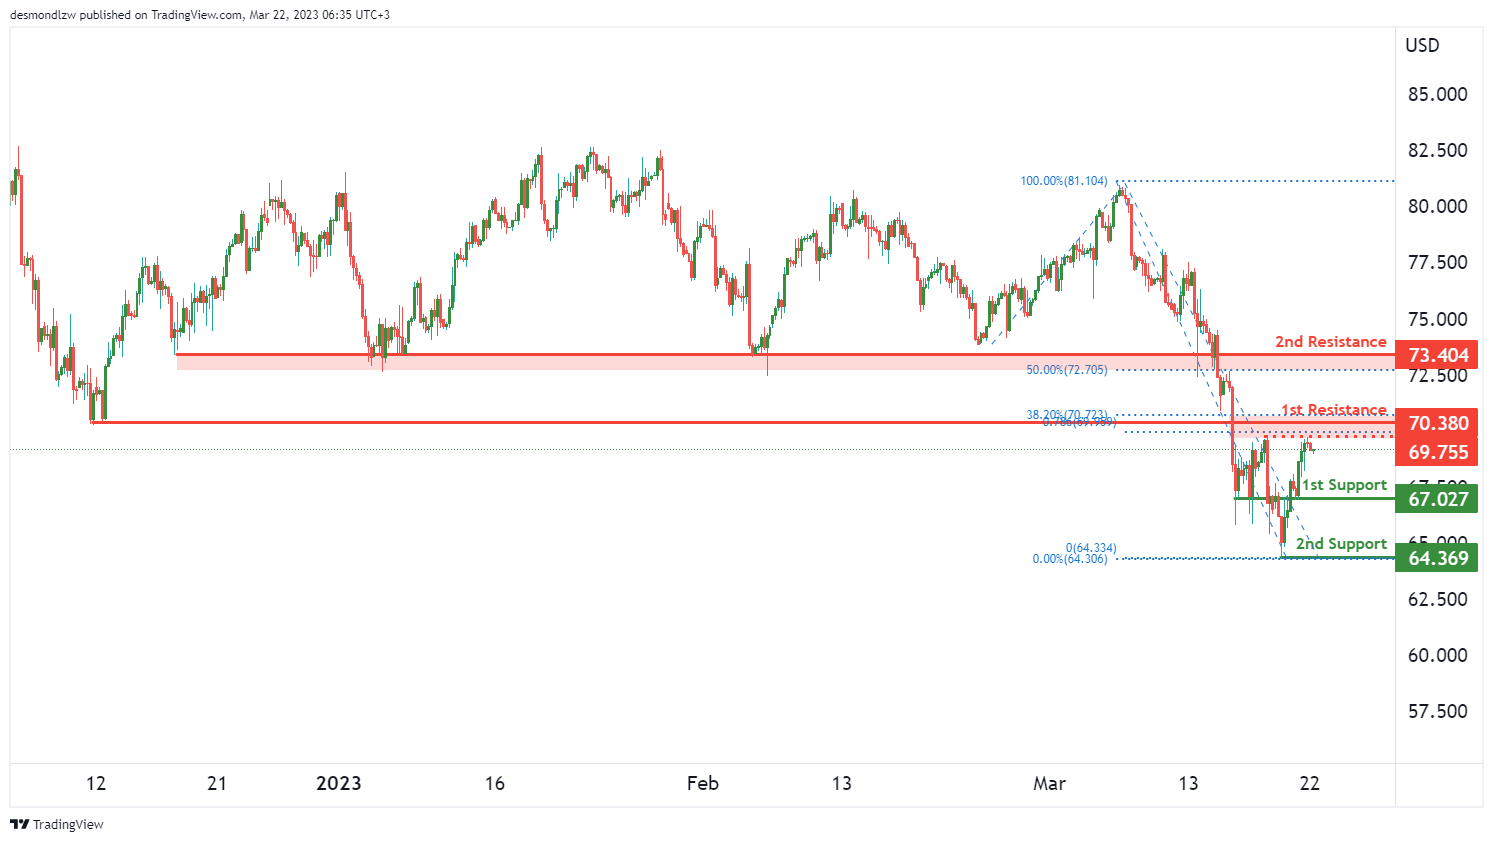
WTI/USD:
WTI crude oil has been experiencing a bearish momentum recently. The price is expected to potentially make a bearish reaction off the first resistance at 70.38 and drop to the first support at 67.02. The second support level at 64.36 is also expected to act as a support due to its multi-swing low support status.
In terms of resistance levels, the first resistance level at 70.38 is an overlap resistance, while the second resistance level at 73.40 is a 50% Fibonacci retracement level. Additionally, there is an intermediate resistance level at 69.75.
Overall, the chart’s momentum is bearish, with prices expected to react bearishly off the first resistance level and drop towards the first support level.
.
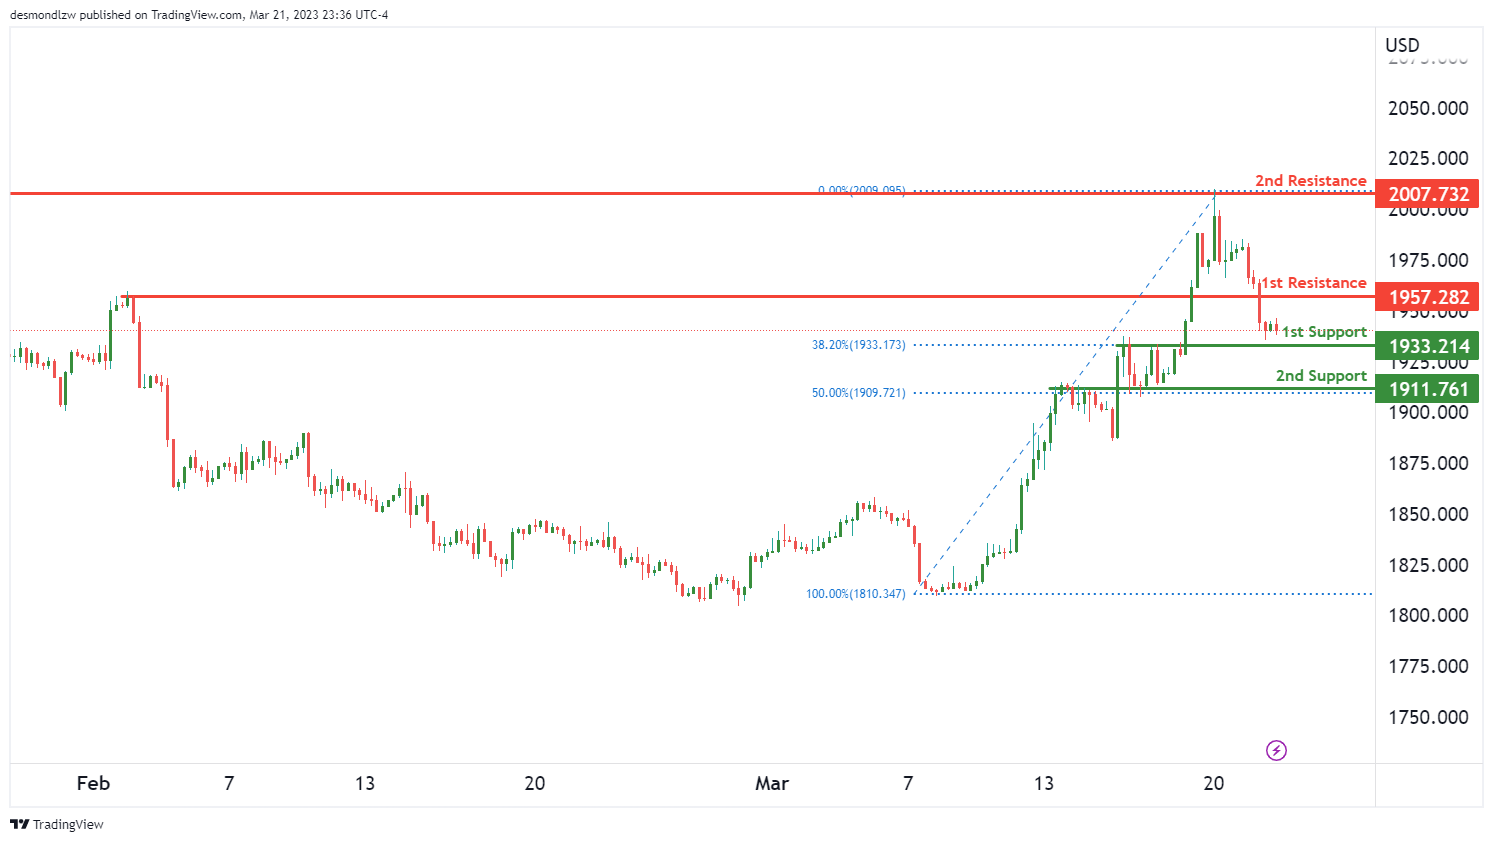
XAU/USD (GOLD):
Gold could potentially make a bullish bounce off the first support level at $1933 and head towards the first resistance level at $1957. The $1933 level is an overlap support, coinciding with the 38.20% Fibonacci retracement, which could act as a strong support level. Meanwhile, the $1957 level is also an overlap resistance that may provide a challenge for gold if it reaches that level. The next resistance level is at $2007, which is a swing high resistance.
If gold fails to hold above the $1933 support level, it could potentially drop to the $1911 support level, which is also an overlap support and coincides with the 50% Fibonacci retracement. A break below this level could lead to further downside momentum.
The accuracy, completeness and timeliness of the information contained on this site cannot be guaranteed. IC Markets does not warranty, guarantee or make any representations, or assume any liability regarding financial results based on the use of the information in the site.
News, views, opinions, recommendations and other information obtained from sources outside of www.icmarkets.com, used in this site are believed to be reliable, but we cannot guarantee their accuracy or completeness. All such information is subject to change at any time without notice. IC Markets assumes no responsibility for the content of any linked site.
The fact that such links may exist does not indicate approval or endorsement of any material contained on any linked site. IC Markets is not liable for any harm caused by the transmission, through accessing the services or information on this site, of a computer virus, or other computer code or programming device that might be used to access, delete, damage, disable, disrupt or otherwise impede in any manner, the operation of the site or of any user’s software, hardware, data or property.


