
Key risk events today:
Canada CPI m/m, Common CPI y/y, Median CPI y/y, Trimmed CPI y/y; BoC Monetary Policy Report, Rate Statement, Overnight Rate and Press Conference.
(Italics represents previous analysis and outside sources)
EUR/USD:
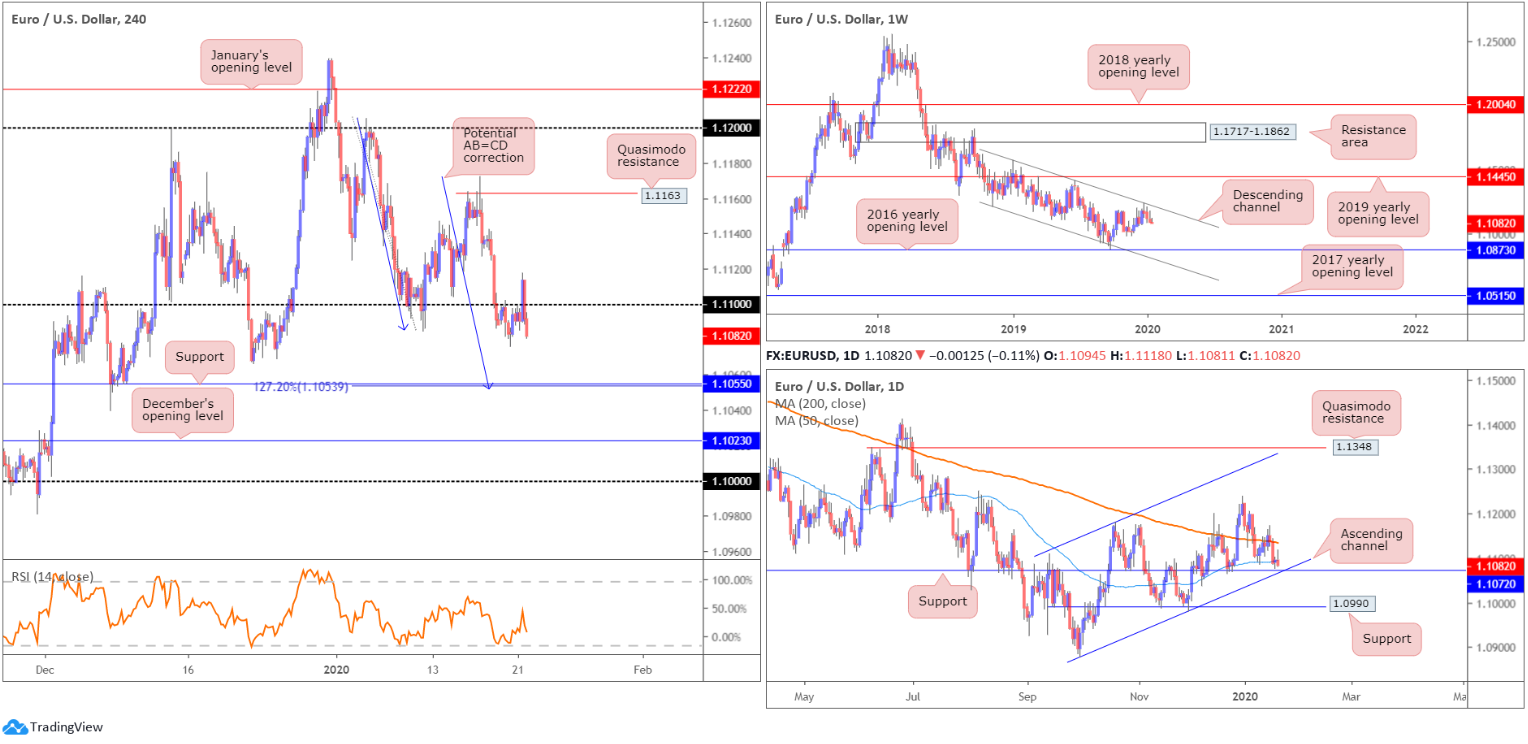
Europe’s single currency concluded the day a shade lower against the US dollar, despite EUR/USD gleaning some traction via an encouraging German/Eurozone ZEW survey earlier in the session. According to ZEW, the ZEW Indicator of Economic Sentiment for Germany has again risen sharply at the beginning of 2020. In January, the indicator stands at 26.7 points, 16.0 points higher than in the previous month. This is the indicator’s highest value since July 2015.
Technically, the H4 candles whipsawed above 1.11 to highs of 1.1118 before rotating lower and reclaiming 1.11. This was a typical stop-run above a psychological level, offering buy stops to sell into to push things lower. In terms of support on the H4 scale, a potential 127.2% AB=CD correction (blue arrows) to support at 1.1055 is in sight.
Before reaching 1.1055, though, traders must contend with daily support priced in at 1.1072 (sited just south of the 50-day SMA [blue – 1.1094]), which happens to converge with channel support, drawn from the low 1.0879. A violation of 1.1072, however, has support priced in at 1.0990 in sight.
Action on the weekly timeframe extended losses last week, south of long-standing channel resistance, drawn from the high 1.1569. Down for a third successive session, the next downside objective on this timeframe falls in around the 2016 yearly opening level at 1.0873 followed by channel support, taken from the low 1.1109. To the upside, assuming a break of the said channel resistance, price has the 2019 yearly opening level at 1.1445 to target. In terms of the primary trend, price has been trading lower since topping in early 2018, at 1.2555.
Areas of consideration:
A potential bullish scenario worthy of attention today, one that goes against weekly direction (see above), is a reaction off daily support at 1.1072, given it converges with a daily channel support. Entry based on a H4 close back above 1.11 on the H4 timeframe (considered a bullish indicator) could, therefore, be an idea. Traders are also urged to pencil in the possibility of a fakeout occurring through the said daily level to H4 support highlighted above at 1.1055 to complete the H4 AB=CD formation, before turning higher.
GBP/USD:
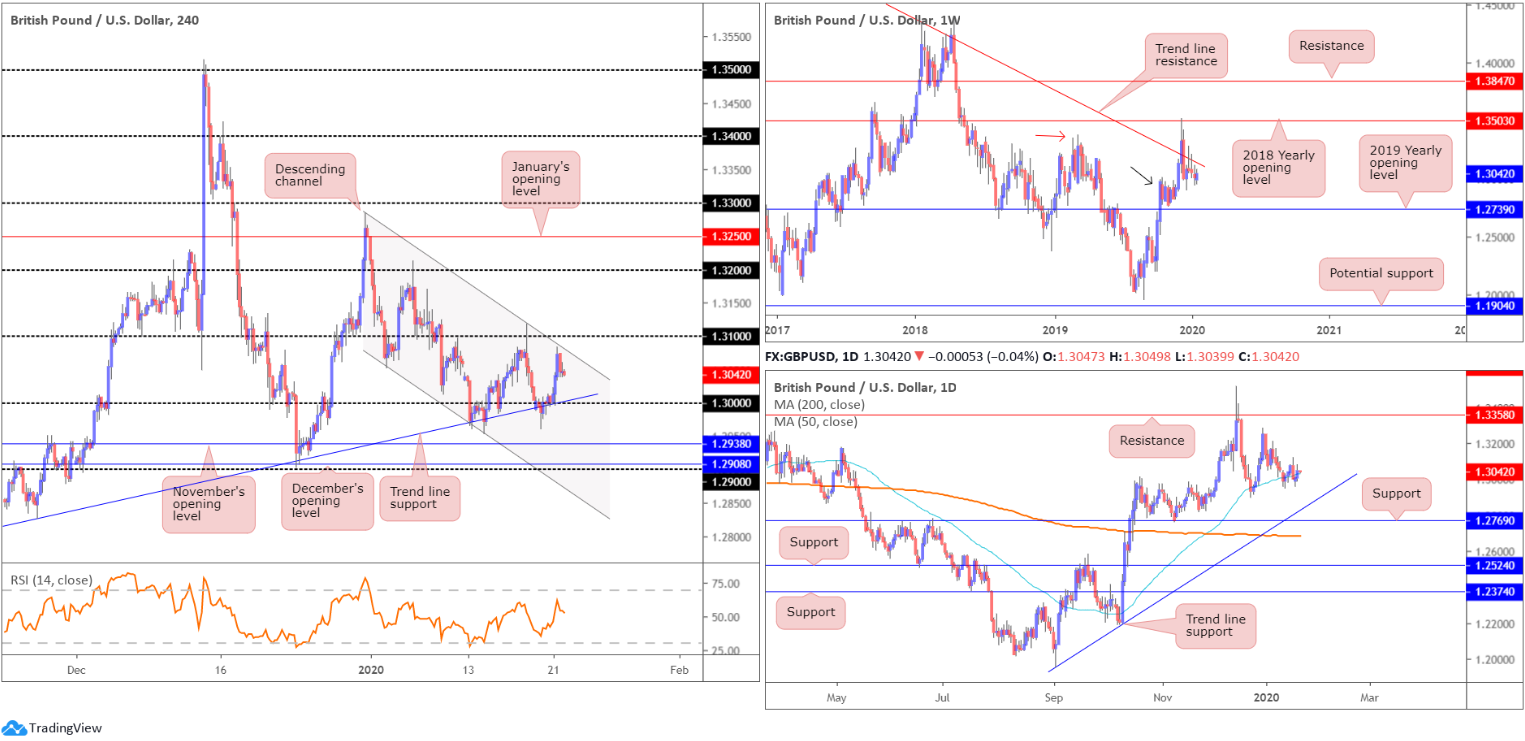
Following a clean retest at 1.30/trend line support, taken from the low 1.2768, GBP/USD climbed higher Tuesday on the back of upbeat UK jobs and earnings data that beat consensus almost across the board.
Recent buying, based on H4 structure, topped just south of channel resistance, extended from the high 1.3284, and the round number 1.31. Above here, limited resistance is seen until reaching 1.32, whereas beyond 1.30 we have November’s opening level at 1.2938, with a break exposing December’s opening level at 1.2908 and the 1.29 handle.
Against the backdrop of shorter-term flows, price on the weekly timeframe remains trading beneath long-standing trend line resistance (pencilled in from the high 1.5930). Buyers are also seen attempting to defend nearby demand around the 1.2939 region (black arrow), seduced by the recent break of the notable high at 1.3380 (red arrow). Continued selling, nevertheless, implies we might see a push lower to the 2019 yearly opening level at 1.2739, consequently tripping sell stops below the aforementioned demand zone.
A closer reading on the daily timeframe shows the unit consolidating around the 50-day SMA (blue – 1.3032). A move lower from here highlights trend line support, taken from the low 1.1958. Another layer of support is visible nearby at 1.2769, sited a few points north of the 200-day SMA (orange – 1.2687). With respect to resistance, the only level of interest right now sits at the 1.3284 December 31st high and 1.3358, which capped upside since mid-June 2019.
Areas of consideration:
A whipsaw, preferably in the shape of a H4 bearish candlestick pattern – think shooting star formation, through H4 channel resistance to 1.31 could be in the offing today. The buy stops taken from above the said channel and resistance off 1.31 may be enough to deliver moves back to 1.30. Entry and risk levels, for those interested in shorts, can be positioned according to the candlestick pattern.
AUD/USD:
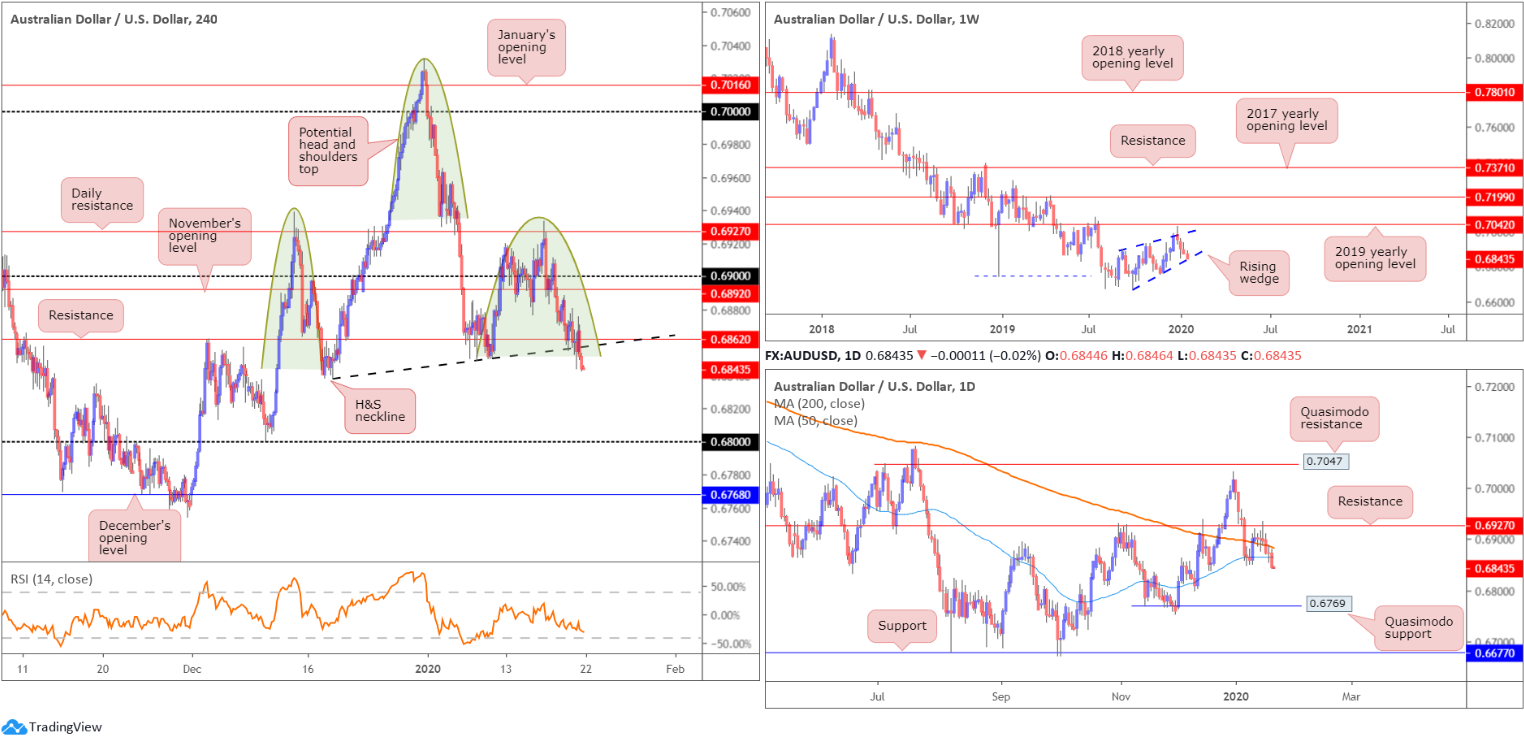
AUD/USD bears continued to tunnel lower Tuesday, ahead of tomorrow’s jobs data out of Australia.
As underlined in Monday’s technical briefing, H4 price has also been chalking up a potential head and shoulders top pattern since mid-December 2019 (left shoulder sports a top at 0.6938, right shoulder at 0.6933 and the head at 0.7031 – green). The neckline is drawn from the 0.6838 December 18 low and the 0.6850 January 9 low (black line). Traditionally, traders wait for a close beneath the neckline to trigger shorts; others, however, may attempt a short at the right shoulder or even at the formation of the head.
As evident from the H4 timeframe, price closed beneath support at 0.6862 (now a serving resistance) and the H&S neckline. Although an initial (structure) target can be seen at 0.68, H&S traders will be looking for much lower levels.
On a wider perspective, weekly action, since registering a bottom in late September at 0.6670, has been carving out what appears to be a rising wedge formation, typically considered a continuation pattern. Over the past three weeks, and also so far this week, price declined back into the rising wedge, following a minor whipsaw through the top edge of the said wedge, missing the 2019 yearly opening level at 0.7042 by a mere ten points. With the primary downtrend having been in full force since topping at 0.8135, in early 2018, a break lower beyond the lower edge of the noted wedge formation could be seen. This would trigger weighty sell stops, both from lower-timeframe traders entering long the correction and longer-term traders’ breakout sell orders.
Daily resistance at 0.6927 capped upside Thursday, establishing a robust selling wick, with Friday finishing beneath the 200-day SMA (orange – 0.6883). The 50-day SMA (blue – 0.6864) gave way yesterday, underscoring a potential move towards Quasimodo support at 0.6769.
Areas of consideration:
An ideal entry scenario, for most conservative H&S traders, would be for a H4 retest at 0.6862 (and the H&S neckline), in the form of a notable H4 bearish candlestick pattern (entry and risk can be determined according to the candlestick’s structure).
USD/JPY:
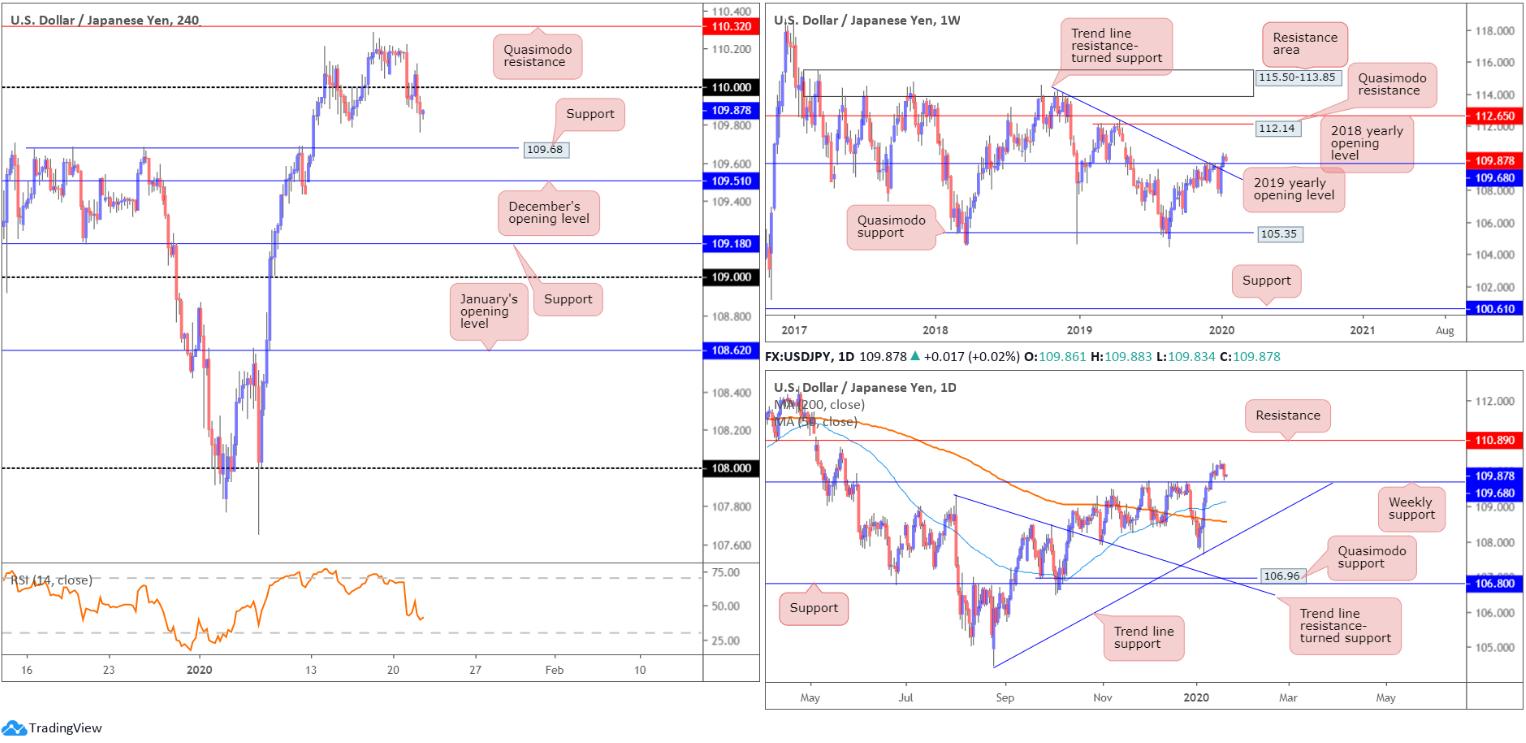
Tuesday had the USD/JPY pencil in its heaviest loss in two weeks, pulling the H4 candles south of the 110 handle. Aside from the 109.79 January 15 low, limited support is visible beneath 110 until reaching 109.68, closely followed by December’s opening level at 109.51.
On more of a broader view, weekly resistances, comprised of the 2019 yearly opening level at 109.68 and trend line resistance, extended from the high 114.23, gave way in recent trading, perhaps setting a long-term stage for a run to Quasimodo resistance at 112.14 and the 2018 yearly opening level at 112.65. Prior to further buying, however, the possibility of a retest at 109.68 is certainly there. In terms of market trend, immediate flows point north.
In similar fashion, daily price remains above the recently broken weekly resistance at 109.68. According to the daily timeframe, additional upside is also a possibility, though resistance is seen around the 110.89 region on this scale.
Areas of consideration:
The combined H4 support and weekly support at 109.68 is in focus today, offering a potential bullish theme. As for protective stop-loss orders, beneath December’s opening level at 109.51 is an option, though conservative traders will likely want to witness a H4 bullish candlestick formation emerge from 109.68 before pulling the trigger. This not only helps identify buyer intent, it provides entry and risk levels to work with.
The initial take-profit target can be sited around the 110 region.
USD/CAD:
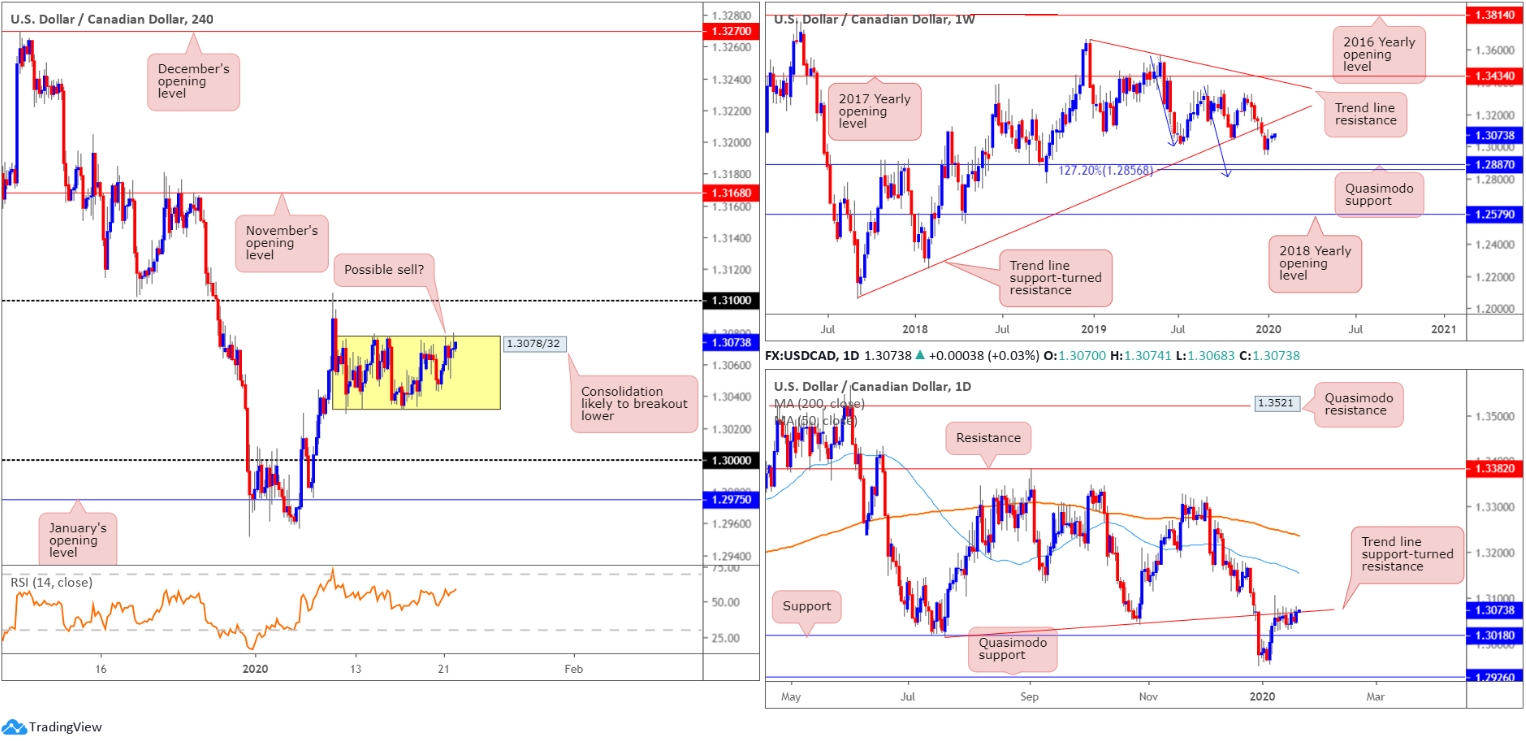
USD/CAD held on to a mildly positive tone Tuesday, albeit failing to overthrow the top edge of the current H4 range at 1.3078. Traders are likely to remain on the side-lines ahead of Canadian inflation figures and BoC later today.
Since January 10, USD/CAD has been confined between 1.3078/32 on the H4 timeframe. Outside of this range, areas of interest fall in at 1.30, sited above January’s opening level at 1.2975, and 1.31, with a break underlining November’s opening level at 1.3168.
Structure on the weekly timeframe shows price could effectively swing either way. To the upside, we have trend line support-turned resistance, extended from the low 1.2061. Lower on the curve, the pair also exhibits scope to test Quasimodo support at 1.2887, positioned close by a 127.2% AB=CD bullish correction (blue arrows) at 1.2856. The immediate trend has faced north since bottoming in September 2017; however, this move could also be considered a deep pullback in a larger downtrend from the 1.4689 peak in early January 2016.
Daily flow remains capped around the underside of a trend line support-turned resistance, taken from the low 1.3015. Sellers from this point have support at 1.3018 in view, with a break possibly triggering a push to the 1.2951 December 31 low and Quasimodo support at 1.2926. A break to the upside, nonetheless, has the 50-day SMA (blue – 1.3154) in view, trailed by the 200-day SMA (orange – 1.3236).
Areas of consideration:
With weekly price displaying room to explore lower ground, and daily price holding at the underside of trend line resistance, the lower edge of the current H4 consolidation is likely to give way.
Traders, therefore, have the option of either attempting to sell the top edge of the H4 range (this is best done entering on the back of additional candlestick confirmation to help avoid whipsaws to 1.31 [entry/risk can be determined according to the candle pattern]), or waiting for a breakout to form. The latter, although considered the more conservative route, unfortunately has immediate support at 1.30 to contend with, consequently limiting risk/reward.
USD/CHF:
For those who read Monday’s technical briefing on the H4 timeframe you may recall the following:
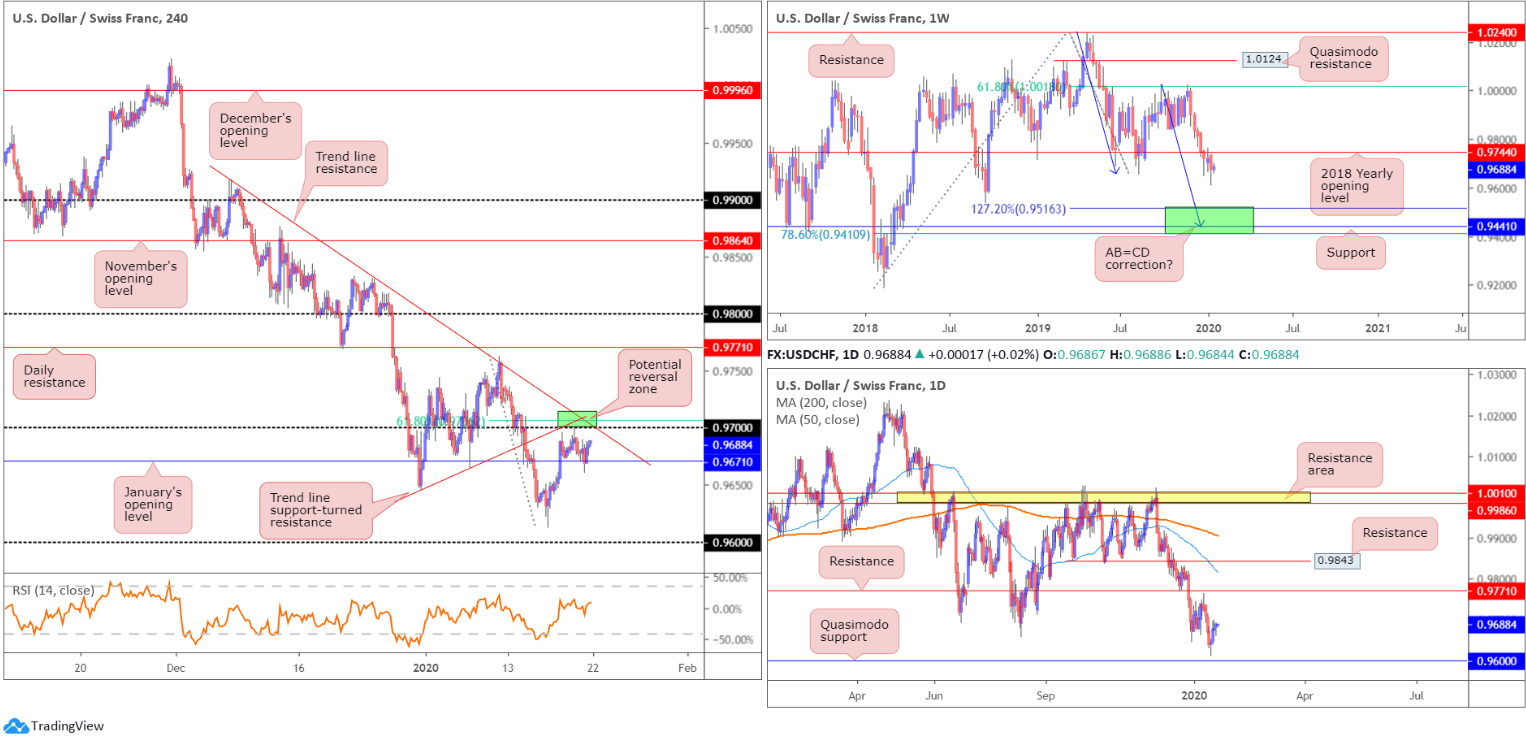
USD/CHF built on Thursday’s intraday recovery on Friday, led by broad-based USD buying. The pair refreshed session tops with bulls now poised to approach the 0.97 handle. Although we crossed above January’s opening level at 0.9671, a reasonably strong reversal zone is present around 0.97. Comprised of a 61.8% Fibonacci resistance at 0.9707 and two trend line resistances, we could be heading for fresh yearly lows from here this week, targeting daily Quasimodo support at 0.9600 (the 0.96 handle also on the H4).
As evident from the H4 timeframe, price fell short of reaching 0.97 by less than a point on the charted feed Monday, before turning lower amid holiday-thinned trade. The session wrapped up within striking distance of January’s opening level mentioned above at 0.9671. Tuesday, nonetheless, saw January’s opening level enter the fight which, as you can see, is holding the unit higher, as we write.
The situation on the higher timeframes remains pretty much unchanged:
Weekly timeframe:
Following a brief pause, that snapped a five-week losing streak and retested the underside of the 2018 yearly opening level at 0.9744, USD/CHF reignited its bearish tone last week. Losing more than 45 points and clocking lows of 0.9613, levels not seen since September 2018, the next downside target sits in the range of 0.9410/0.9516 (comprised of a 78.6% Fibonacci retracement at 0.9410, support at 0.9441 and a 127.2% AB=CD bullish correction [black arrows] at 0.9516 – green]).
Daily timeframe:
Leaving Quasimodo support at 0.9600 unopposed (drawn from September 2018), Thursday printed a half-hearted hammer candlestick pattern (considered a bullish signal), followed through on Friday’s modest upside.
Resistance, according to the technical studies presented here, is not expected to arise until crossing swords with 0.9771.
Areas of consideration:
Another retest at 0.97 could emerge today, offering traders another opportunity to sell from confluence (see above in bold).
In the event we continue exploring lower ground, however, traders will likely be watching for the H4 candles to close south of 0.9671. A close beneath here, that’s preferably followed up with a retest in the shape of a bearish candlestick signal, is possibly enough to encourage further selling to the 0.9613 January 16 low, closely shadowed by the 0.96 handle.
Dow Jones Industrial Average:
Major US benchmarks settled lower Tuesday, retreating from fresh record peaks formed last week. Reports the Chinese coronavirus spread to the US elevated fears of a pandemic that might affect global economic growth, consequently sending stocks lower and snapping a six-day bullish phase. The Dow Jones Industrial Average lost 152.06 points, or 0.52%; the S&P 500 erased 8.83 points, or 0.27% and the tech-heavy Nasdaq 100 ended lower by 7.11 points, or 0.08%.
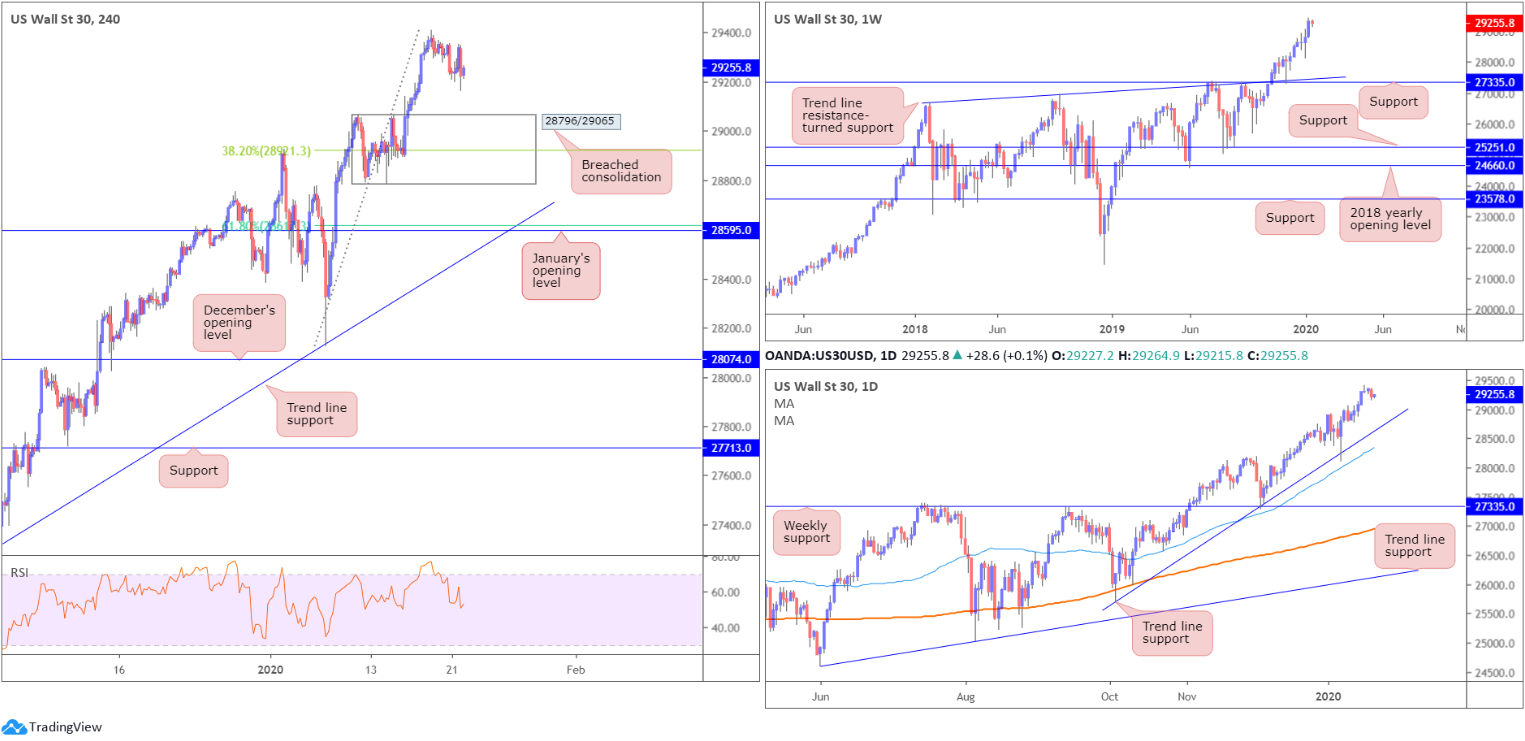
The recent setback, based on the H4 timeframe, positions the market within reasonably close striking distance of 29065, the top edge of a recently breached consolidation. Within this area also rests a 38.2% Fibonacci retracement at 28921, therefore a possible area of support to consider as well. Other areas of interest on the H4 chart are the lower edge of the consolidation around 28796 and January’s opening level at 28595, which happens to merge with a 61.8% Fibonacci support at 28618 and trend line support, extended from the low 27314.
Higher-timeframe technical structure remains unchanged as we enter Wednesday’s Asia Pac session:
Following a weekly hammer candlestick pattern (considered a buy signal at troughs), formed seven weeks back at the retest of weekly support drawn from 27335, along with trend line support etched from the high 26670, the index has continued to advance higher since, testing fresh record peaks of 29409 last week.
Daily trend line support, extended from the low 25710, remains in motion, bolstered by additional support from the 50-day SMA (blue – 28255). Candlestick traders may also wish to acknowledge Friday printed a near-perfect ‘gravestone doji’ at all-time highs of 29409, typically considered a bearish signal, which has held ground thus far.
Areas of consideration:
With the uptrend remaining strong, and daily price trading north of trend line support, traders likely have eyes on a retest of H4 support at 29065 or the 38.2% H4 Fibonacci retracement at 28921 for potential long opportunities. A retest, preferably in the shape of a H4 bullish candlestick signal (entry/risk levels can be determined according to this formation), would likely be sufficient to entice traders seeking a buy-the-dip scenario to join this seemingly everlasting trend.
XAU/USD (GOLD):
Bullion remained pretty much neutral Tuesday, but did manage a high at 1568.6 and a low of 1546.4.
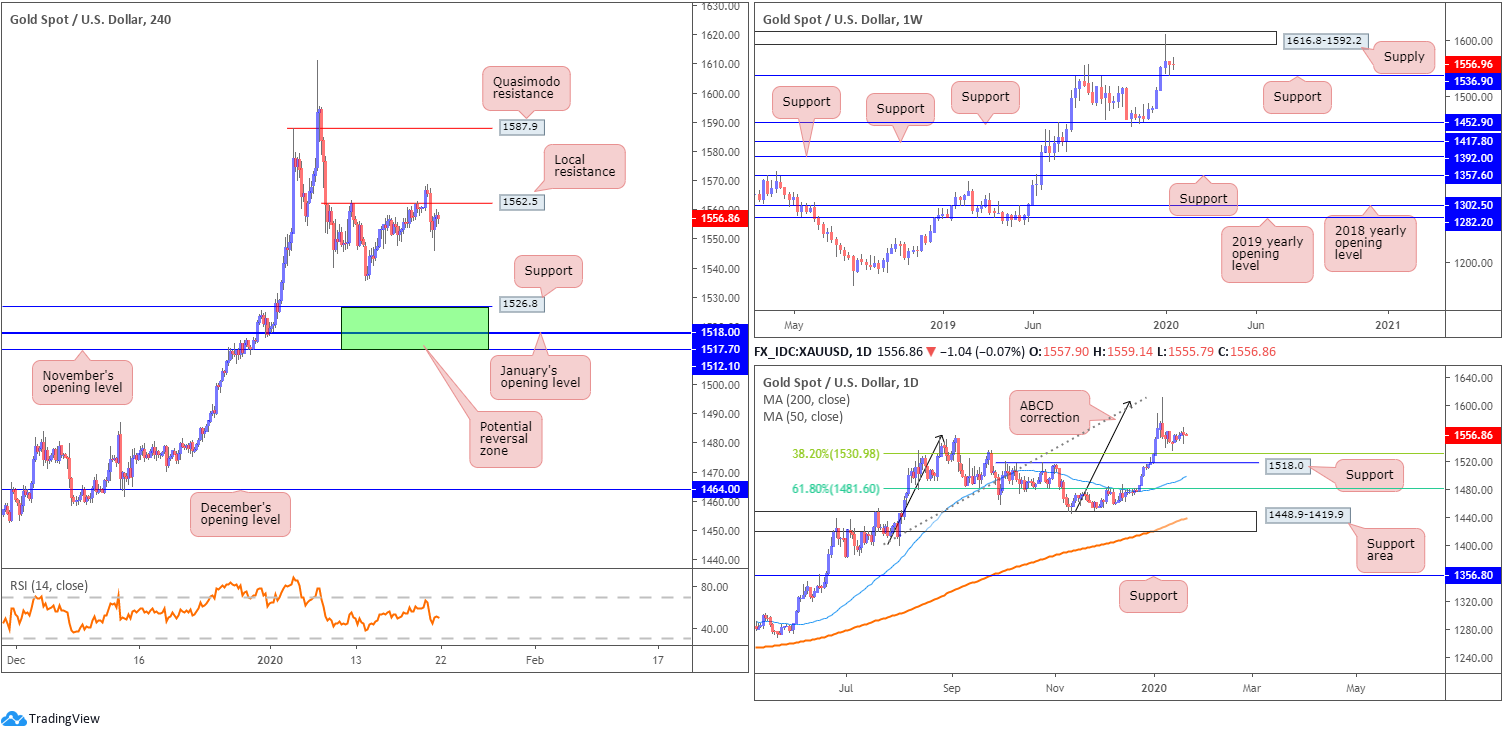
Technical research based on the H4 timeframe has the candles shaking hands with a local resistance coming in at 1562.5. In the early hours of yesterday’s session, traders witnessed a whipsaw motion through the said resistance to highs at 1568.6 before swiftly turning lower and reaching lows of 1546.2, amid early US hours. Undoubtedly, this caused a lot of pain. Traders attempting to fade the resistance level had buy stops filled, whereas buyers looking to trade the breakout also had their buy stops filled, though were swiftly taken out of the market.
A move lower from 1562.5 may see the 1536.1 January 14 low make an appearance, followed by an area of support (green) between November’s opening level at 1512.1 and support at 1526.8 (daily support at 1518.0 and January’s opening level at 1517.7 seen within). A move north of H4 resistance at 1562.5, on the other hand, unlocks the door to potential bullish themes, targeting H4 Quasimodo resistance at 1587.9, closely shadowed by the lower edge of weekly supply at 1592.2.
Weekly price is seen recovering from support at 1536.9, following a dominant rejection out of supply at 1616.8-1592.2. A violation of the said support could prompt selling towards additional layers of support at 1452.9, 1417.8, 1392.0 and 1357.6.
Although we seem to be entering into a bottoming phase on the daily timeframe, it’s still worth bearing in mind the 38.2% Fibonacci retracement at 1530.9 as support, closely followed by 1518.0. The former offers an initial take-profit target for traders short the ABCD bearish correction (black arrows) at 1608.0.
Areas of consideration:
Should a selloff occur, 1512.1/1526.8 on the H4 timeframe is a zone worth watching for signs of buyer intent. Not only does it boast a strong mix of confluence, the support area forms in line with the primary trend.
Continued buying, along with a H4 close north of H4 resistance at 1562.5, is likely of interest to many in this market. Breakout traders will, despite yesterday’s whipsaw higher, still likely enter on the close of another breakout candle, and position stops beneath its respective low (lower candle shadow). The more conservative approach, though, entails waiting for a retest at 1562.5 (following the breakout) to occur and entering based on the rejection candle’s framework, either at market or using a buy stop entry.
The accuracy, completeness and timeliness of the information contained on this site cannot be guaranteed. IC Markets does not warranty, guarantee or make any representations, or assume any liability regarding financial results based on the use of the information in the site.
News, views, opinions, recommendations and other information obtained from sources outside of www.icmarkets.com.au, used in this site are believed to be reliable, but we cannot guarantee their accuracy or completeness. All such information is subject to change at any time without notice. IC Markets assumes no responsibility for the content of any linked site.
The fact that such links may exist does not indicate approval or endorsement of any material contained on any linked site. IC Markets is not liable for any harm caused by the transmission, through accessing the services or information on this site, of a computer virus, or other computer code or programming device that might be used to access, delete, damage, disable, disrupt or otherwise impede in any manner, the operation of the site or of any user’s software, hardware, data or property.


