
EUR/USD:
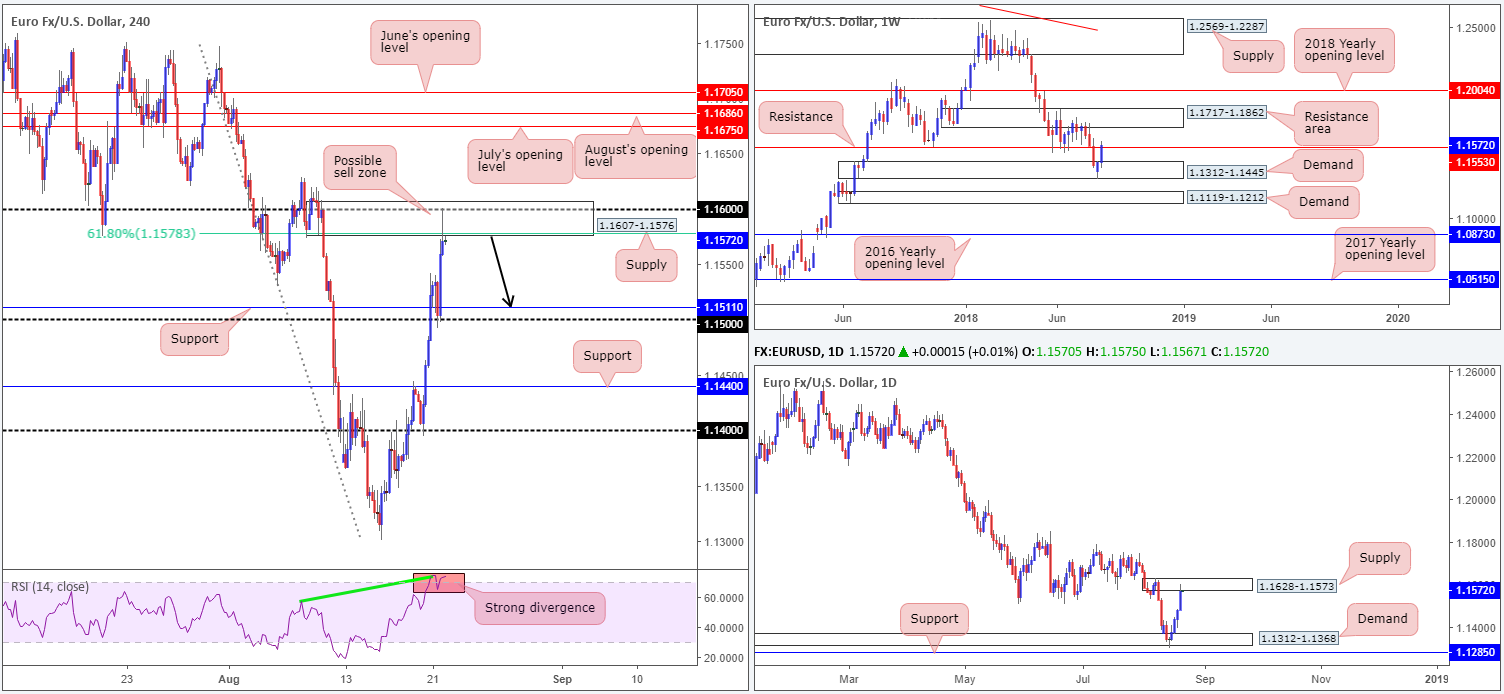
Trump’s disapproval of the Fed continued to weigh on the greenback on Tuesday, down 0.54% on the day (US dollar index). This, as you can see, helped support a retest off the 1.15 handle on the EUR/USD, and pulled the unit towards H4 supply at 1.1607-1.1576, which happens to encase 1.16 and a 61.8% Fib resistance at 1.1578 (taken from the high 1.1747). Another key thing to be aware of on the H4 timeframe this morning is the divergence/overbought reading seen on the RSI indicator.
Meanwhile, on the daily timeframe, the pair is seen interacting with a strong supply zone coming in at 1.1628-1.1573. Weekly movement, however, recently crossed above resistance at 1.1553. The next upside objective on this scale does not come into view until the resistance area marked at 1.1717-1.1862. Whether or not sellers are consumed here is difficult to judge, given the break is relatively minor on this timeframe.
Areas of consideration:
To our way of seeing things, the current H4 supply has a healthy chance of capping upside today. Not only do we have robust H4 confluence supporting the zone, we also have a daily supply in the mix. For that reason, a move back down to the 1.15 neighborhood is certainly not out of the question.
For those looking to sell, stop-loss orders could be sited above the top edge of the H4 demand at around 1.1610ish, targeting H4 support at 1.1511 as the initial take-profit zone.
Today’s data points: US existing home sales; FOMC meeting minutes.
GBP/USD:
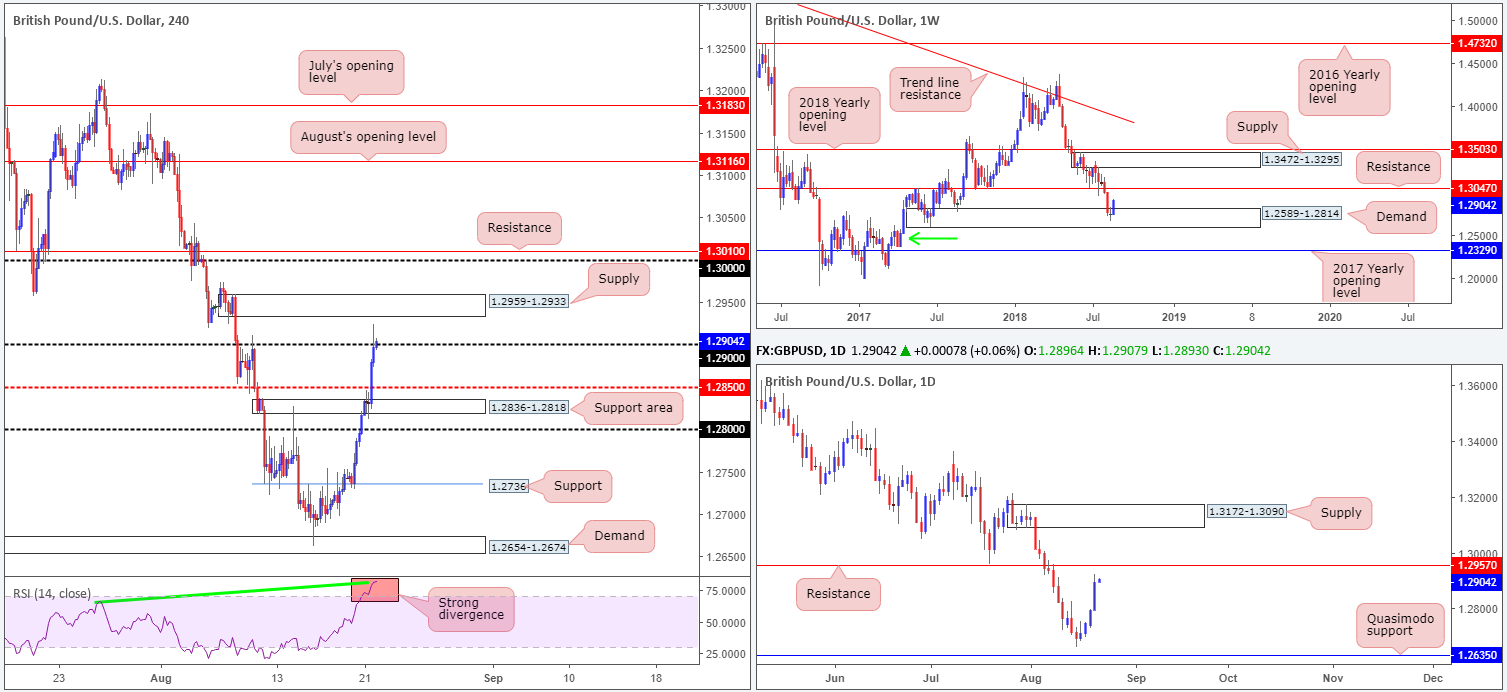
For the most part, sterling has been taking its cues from the waning US dollar. Recording its fourth consecutive daily gain on Tuesday, the GBP/USD concluded the day tripping stop-loss orders above 1.29 on the H4 timeframe, and came within a stone’s throw away from testing H4 supply at 1.2959-1.2933.
From a technical standpoint on the higher timeframes, strong buying continues to be observed out of weekly demand at 1.2589-1.2814. The path north from here appears reasonably clear until weekly resistance plotted at 1.3047. The story on the daily timeframe, nonetheless, places the candles within close proximity to resistance at 1.2957, which boasts a relatively sound history (check out the daily demand [now acting supply] formed around this region at 1.2905-1.2966 in early September 2017).
Areas of consideration:
The aforesaid H4 supply zone will likely bounce price today, given its relationship with nearby daily resistance. To be on the safe side, however, do not expect much beyond 1.29 from here.
Eventually, though, we are expecting the key figure 1.30 to re-enter the fight, and quite possibly the weekly resistance mentioned above at 1.3047. Between 1.3047/1.30 is certainly an area to keep on the watchlist for potential sells in this market in the near future.
Today’s data points: US existing home sales; FOMC meeting minutes.
AUD/USD:
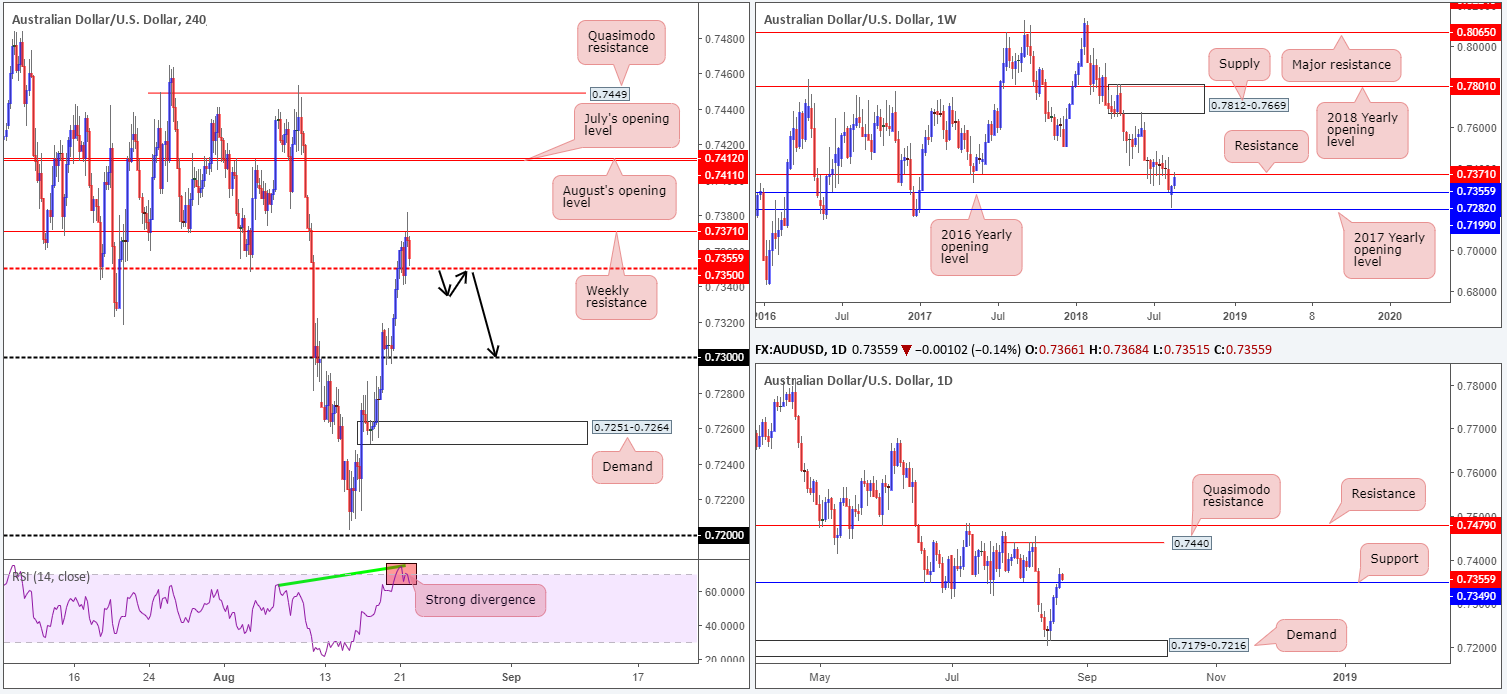
Coming at you from the top this morning, we can see weekly activity recently crossed swords with resistance at 0.7371. Besides this level holding strongly as support back in May 2017, it also proved a problematic support to overcome in June/July of this year. Therefore, this level should carry weight as resistance. With that being said, though, daily flow took out resistance at 0.7349 (now acting support) amid yesterday’s trade, potentially freeing upside towards a Quasimodo resistance located at 0.7440.
Despite the commodity currency registering its fourth consecutive daily gain on Tuesday, the H4 candles were somewhat subdued yesterday as weekly resistance entered the fray. Also worthy of note on the H4 timeframe is the RSI, similar to the euro and pound, is seen displaying a strong divergence/overbought reading. Should the market observe a decisive H4 close below H4 mid-level support, the 0.73 handle will likely be retested, and quite possibly the H4 demand located at 0.7251-0.7264.
Areas of consideration:
A H4 close beneath 0.7350 that’s followed up with a successful retest (preferably in the shape of a full or near-full-bodied bearish candle) as resistance would, according to the overall technical picture, likely be enough to drawn in sellers down to at least the 0.73 region.
Today’s data points: RBA Assist Gov. Debelle speaks; US existing home sales; FOMC meeting minutes.
USD/JPY:
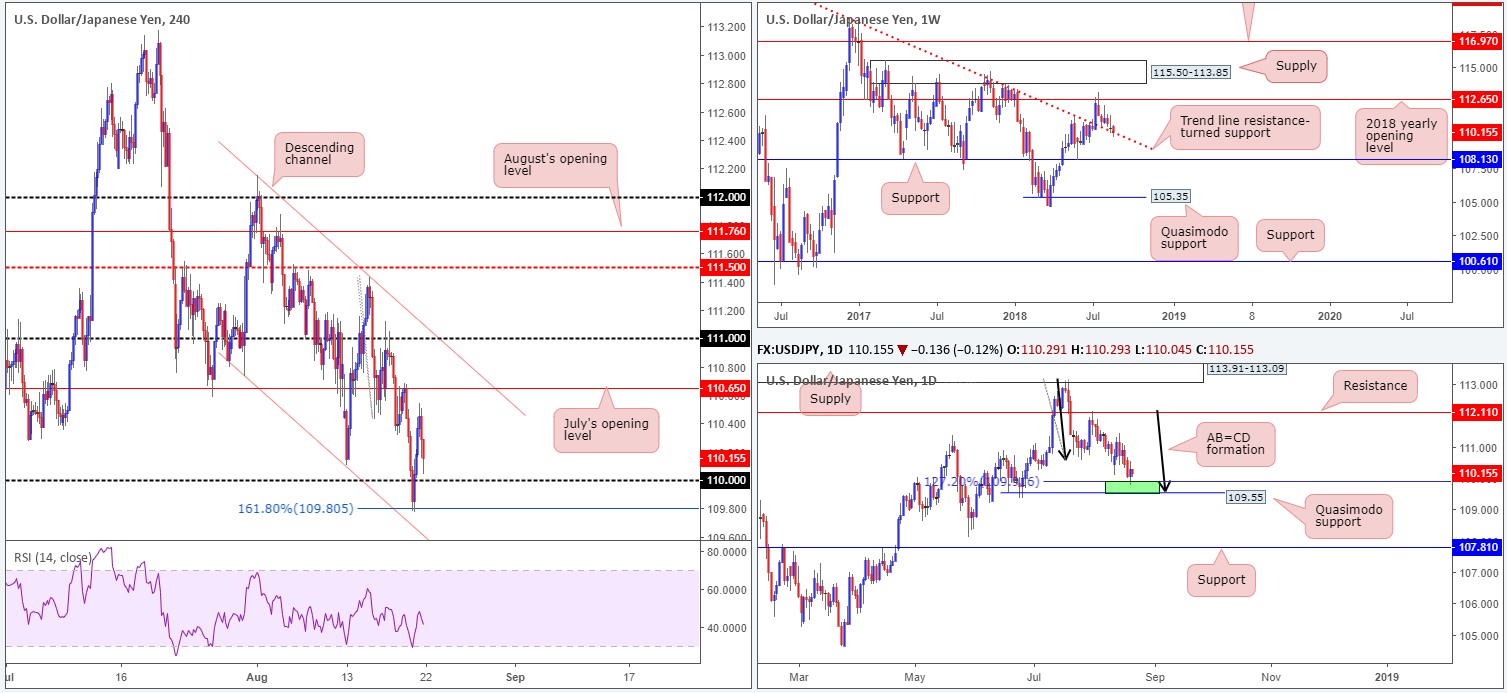
For those who read Tuesday’s technical briefing you may recall the team highlighted the 161.8% H4 Fib ext. at 109.80 as a possible buy (in the technical domain, this is considered an ‘alternate AB=CD pattern’ [developed by Scott Carney]). We liked this level due to the following:
- Fused closely with a H4 channel support (taken from the low 110.73).
- Weekly movement, as you can see, remains toying with a trend line resistance-turned support (taken from the high 123.57). Having seen this line hold firm as resistance on a number of occasions in the past, it’s likely to remain a defensive barrier going forward.
- In conjunction with weekly flow, an AB=CD formation (black arrows) recently completed around the 127.2% Fib ext. point at 109.91, which happens to be positioned nearby a Quasimodo support at 109.55 (green area).
As is evident from the H4 chart, 109.80 responded beautifully in recent trade and produced a 70+-pip move. Well done to any of our readers who managed to jump aboard this train.
Moving forward, we can see the H4 candles are en route to retesting the 110 handle after topping just above the 110.50 neighborhood. Should 110 reject price action, July’s opening level at 110.65 will likely be the next stop.
Areas of consideration:
Ultimately, the market is likely watching 110 this morning. A H4 full or near-full-bodied bullish candle printed from this region would be considered a strong buy signal (stops can be positioned below the rejecting candle’s tail), owing to where we are coming from on the higher timeframes (see above in bold). As highlighted above, the first upside target from 110 will likely be July’s opening level on the H4 timeframe at 110.65.
Today’s data points: US existing home sales; FOMC meeting minutes.
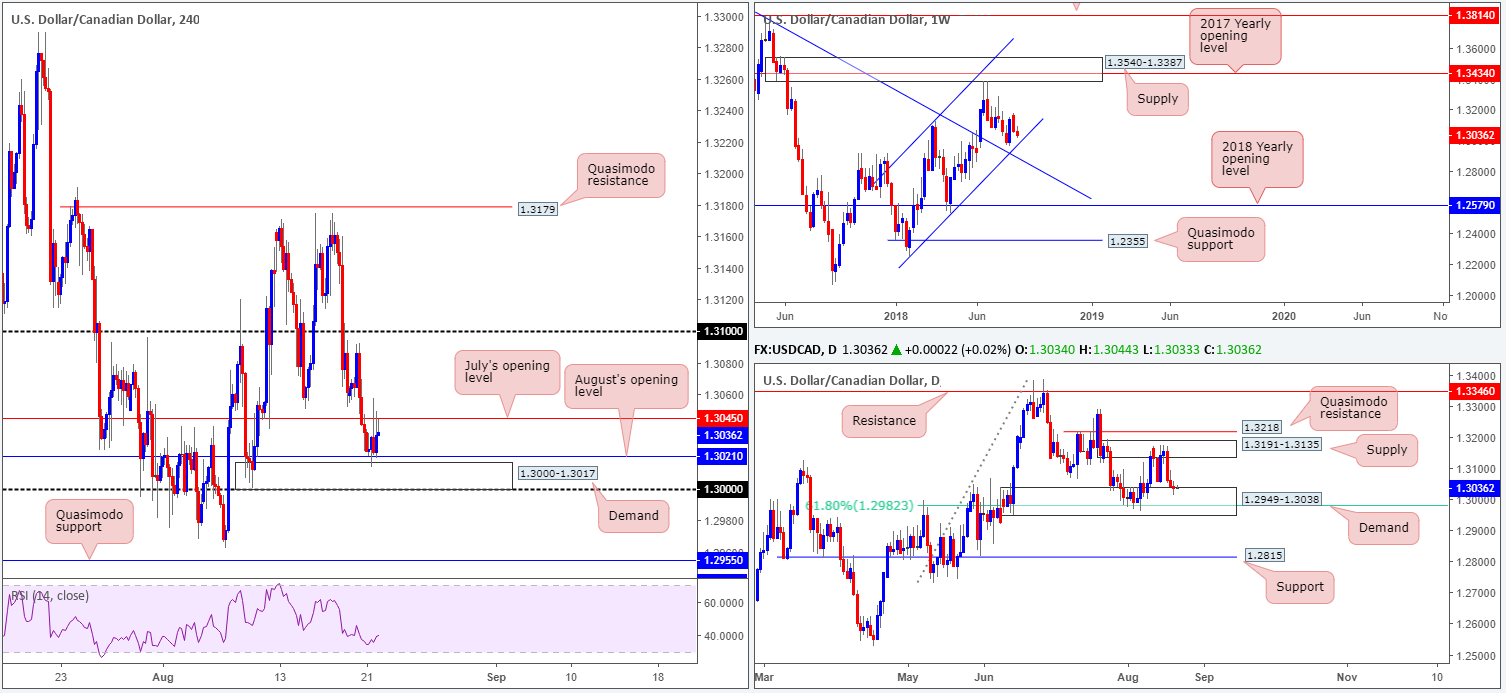
USD/CAD:
In Tuesday’s report, the team underlined the H4 demand zone at 1.3000-1.3017 as an area of interest. Besides forming on top of the key figure 1.30, it is positioned a few pips beneath August’s opening level at 1.3021 and is also sited within the walls of a daily demand area seen at 1.2949-1.3038. As is shown on the H4 chart, the area is so far holding ground, though struggling to breach July’s opening level at 1.3045.
A H4 close above 1.3045, brings H4 supply around the 1.3070 point into view, followed closely by the 1.31 handle. Ultimately, though, upside could possibly stretch as far north as daily supply coming in at 1.3191-1.3135.
Areas of consideration:
The majority of traders long from the current H4 demand have likely reduced risk to breakeven, now hoping for a continuation move to be seen above 1.3045. For those who missed this long, an opportunity to buy may be seen on a potential break/retest of 1.3045, targeting 1.31, and ultimately the underside of daily supply at 1.3135.
Today’s data points: US existing home sales; FOMC meeting minutes: Canadian retail sales m/m; Crude oil inventories.
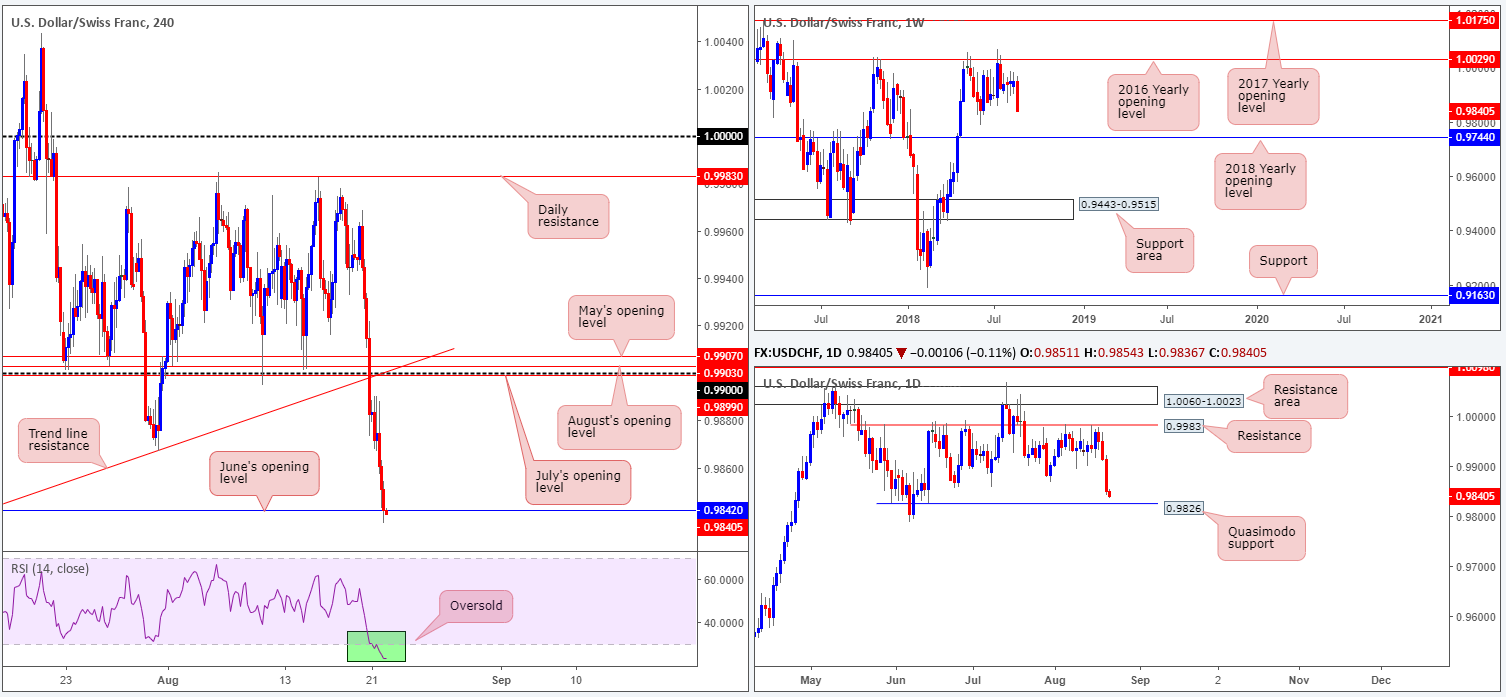
USD/CHF:
Broad-based USD weakness continued to be observed on Tuesday, weighing on USD/CHF movement. The 0.99 handle on the H4 timeframe was, as you can see, swiftly taken out, clearing the path for a move towards June’s opening level at 0.9842, which also happens to represent a Quasimodo support taken from June 13 of this year. Another aspect to keep in mind on this timeframe is the RSI indicator trading within oversold territory.
On the other side of the coin, weekly price shows room to press as far south as June’s low 0.9788, followed by the 2018 yearly opening level at 0.9744. Daily action, however, is seen fast approaching a Quasimodo support penciled in at 0.9826, positioned 16 pips beneath June’s opening level on the H4 timeframe.
Areas of consideration:
While weekly movement indicates further selling could be in store, a bounce from the current daily Quasimodo support is still in offing we believe. An ideal trade scenario here would be for H4 price to drive lower and test the noted daily Quasimodo, and quickly follow up with a H4 close back above June’s opening level (stop-loss orders, for those looking to long, could be positioned beyond the low of the breaking H4 candle). This, by and of itself, would likely be sufficient enough to encourage buyers into the market, ultimately targeting the 0.99 handle and its collection of monthly opening levels.
Today’s data points: US existing home sales; FOMC meeting minutes.
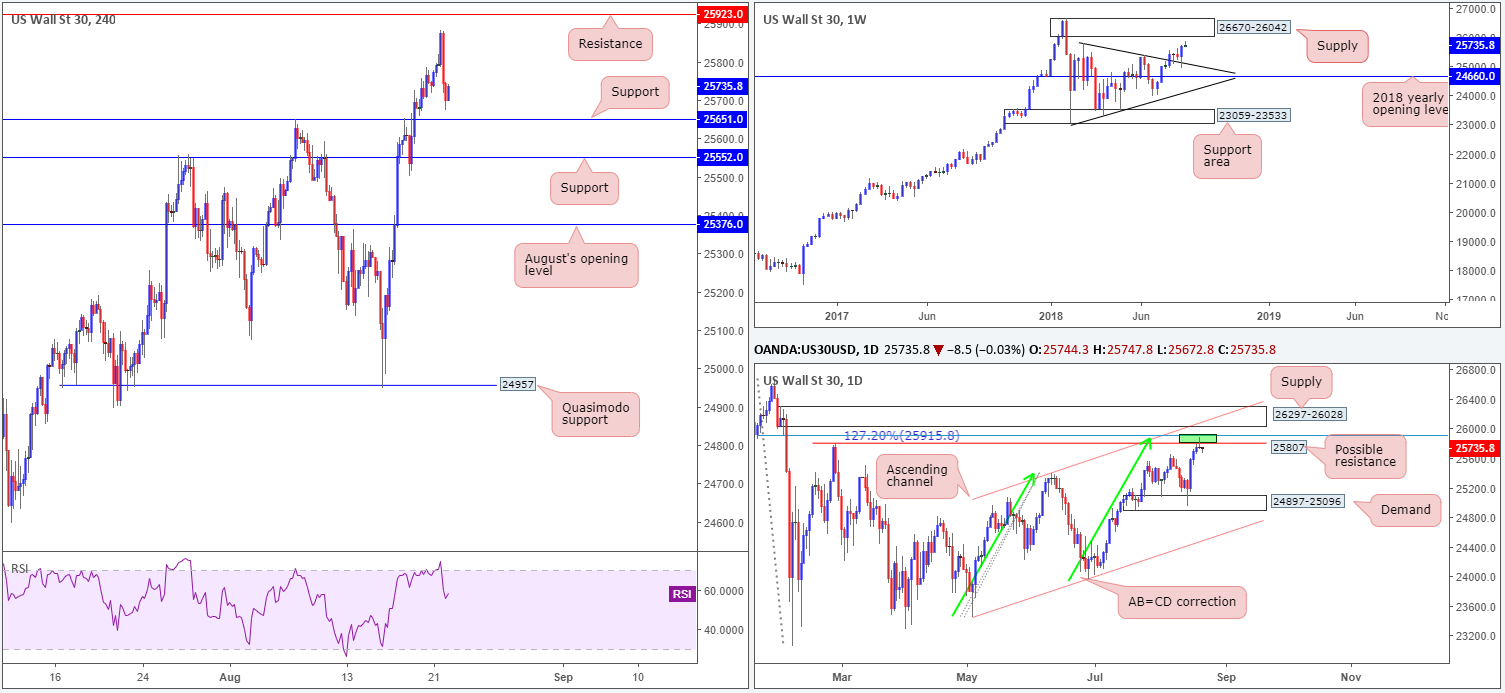
Dow Jones Industrial Average:
Breaking a three-day bullish phase, US equities turned lower on Tuesday just south of H4 resistance at 25923. From a technical perspective, we believe yesterday’s downside move was the result of a small area of confluence on the daily timeframe at 25915/25807. Comprised of a resistance level at 25807 (Feb 27 high), a 127.2% AB=CD (green arrows) correction point at 25915 and a 78.6% Fib resistance at 25904, this zone, as you can see, held ground in the shape of a strong bearish pin-bar formation.
While yesterday’s daily bearish candle may excite candlestick traders, H4 support at 25651, followed closely by support at 25552 could hamper downside. It would only be once these two barriers are removed would the market show sufficient space on the H4 scale to stretch its legs, targeting August’s opening level at 25376.
Also worth highlighting is weekly action showing room to press as far north as supply coming in at 26670-26042, following a strong retest off a trend line resistance-turned support (etched from the high 25807).
Areas of consideration:
In regards to selling this market at current price based on the daily bearish pin-bar formation, waiting for H4 support at 25552 to be engulfed is, according to the technicals, likely the safer route to take.
The H4 resistance mentioned above at 25923 is also still an area worth watching this week. Positioned between the daily area of (green) confluence and supply at 26297-26028, a response from this angle is likely. Yet, do not go into this full throttle! There’s a chance this level could break as the index may want to test the underside of the aforementioned daily supply or even bring the market towards weekly supply at 26670-26042. For that reason, tread carefully!
Today’s data points: US existing home sales; FOMC meeting minutes.
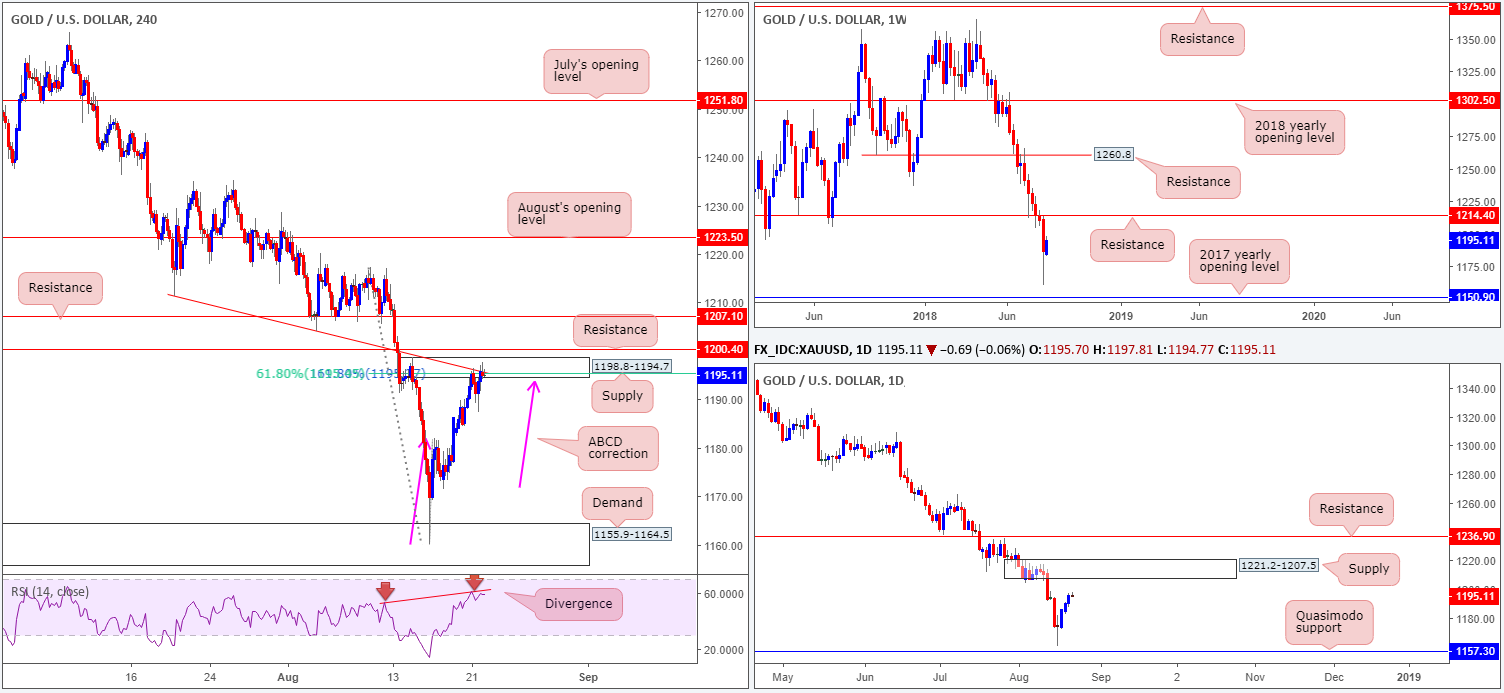
XAU/USD (Gold)
Outlook remains unchanged.
H4 supply at 1198.8-1194.7, as you can see, remains in the fight. What’s appealing about this area, apart from the strong downside momentum from the supply base, is the ABCD correction (pink arrows) completing within the lower limits of the noted supply at 1195.3 (161.8% Fib ext. point). This – coupled with a trend line resistance (taken from the low 1211.2), a 61.8% Fib resistance at 1195.5 and RSI divergence – marks a highly confluent supply zone.
The only drawback, as highlighted in yesterday’s piece, is higher-timeframe structure displays limited resistance around the aforementioned H4 supply. Weekly price has room to stretch as far north as resistance at 1214.4, while daily price appears poised to tackle supply at 1221.2-1207.5 – both zones located above the current H4 supply.
Areas of consideration:
The H4 supply area mentioned above at 1198.8-1194.7 boasts strong H4 confluence for a possible short. The only concern, as mentioned above, is the limited higher-timeframe convergence. Does that mean we should ignore the H4 confluence? Definitely not! Traders are, however, urged to wait and assess H4 price action before pulling the trigger at the aforementioned H4 supply. A full or near-full-bodied bearish candle printed from this area would likely be enough to draw in sellers and pull the market lower. Stop-loss orders can be positioned above the rejecting candle’s wick, with the first take-profit target set at the 38.2% Fib support (taken from the low 1160.0 and the completing point of the H4 ABCD).
The use of the site is agreement that the site is for informational and educational purposes only and does not constitute advice in any form in the furtherance of any trade or trading decisions.
The accuracy, completeness and timeliness of the information contained on this site cannot be guaranteed. IC Markets does not warranty, guarantee or make any representations, or assume any liability with regard to financial results based on the use of the information in the site.
News, views, opinions, recommendations and other information obtained from sources outside of www.icmarkets.com.au, used in this site are believed to be reliable, but we cannot guarantee their accuracy or completeness. All such information is subject to change at any time without notice. IC Markets assumes no responsibility for the content of any linked site. The fact that such links may exist does not indicate approval or endorsement of any material contained on any linked site.
IC Markets is not liable for any harm caused by the transmission, through accessing the services or information on this site, of a computer virus, or other computer code or programming device that might be used to access, delete, damage, disable, disrupt or otherwise impede in any manner, the operation of the site or of any user’s software, hardware, data or property.


