
Key risk events today:
UK Inflation; Canada Inflation.
(Previous analysis as well as outside sources – italics).
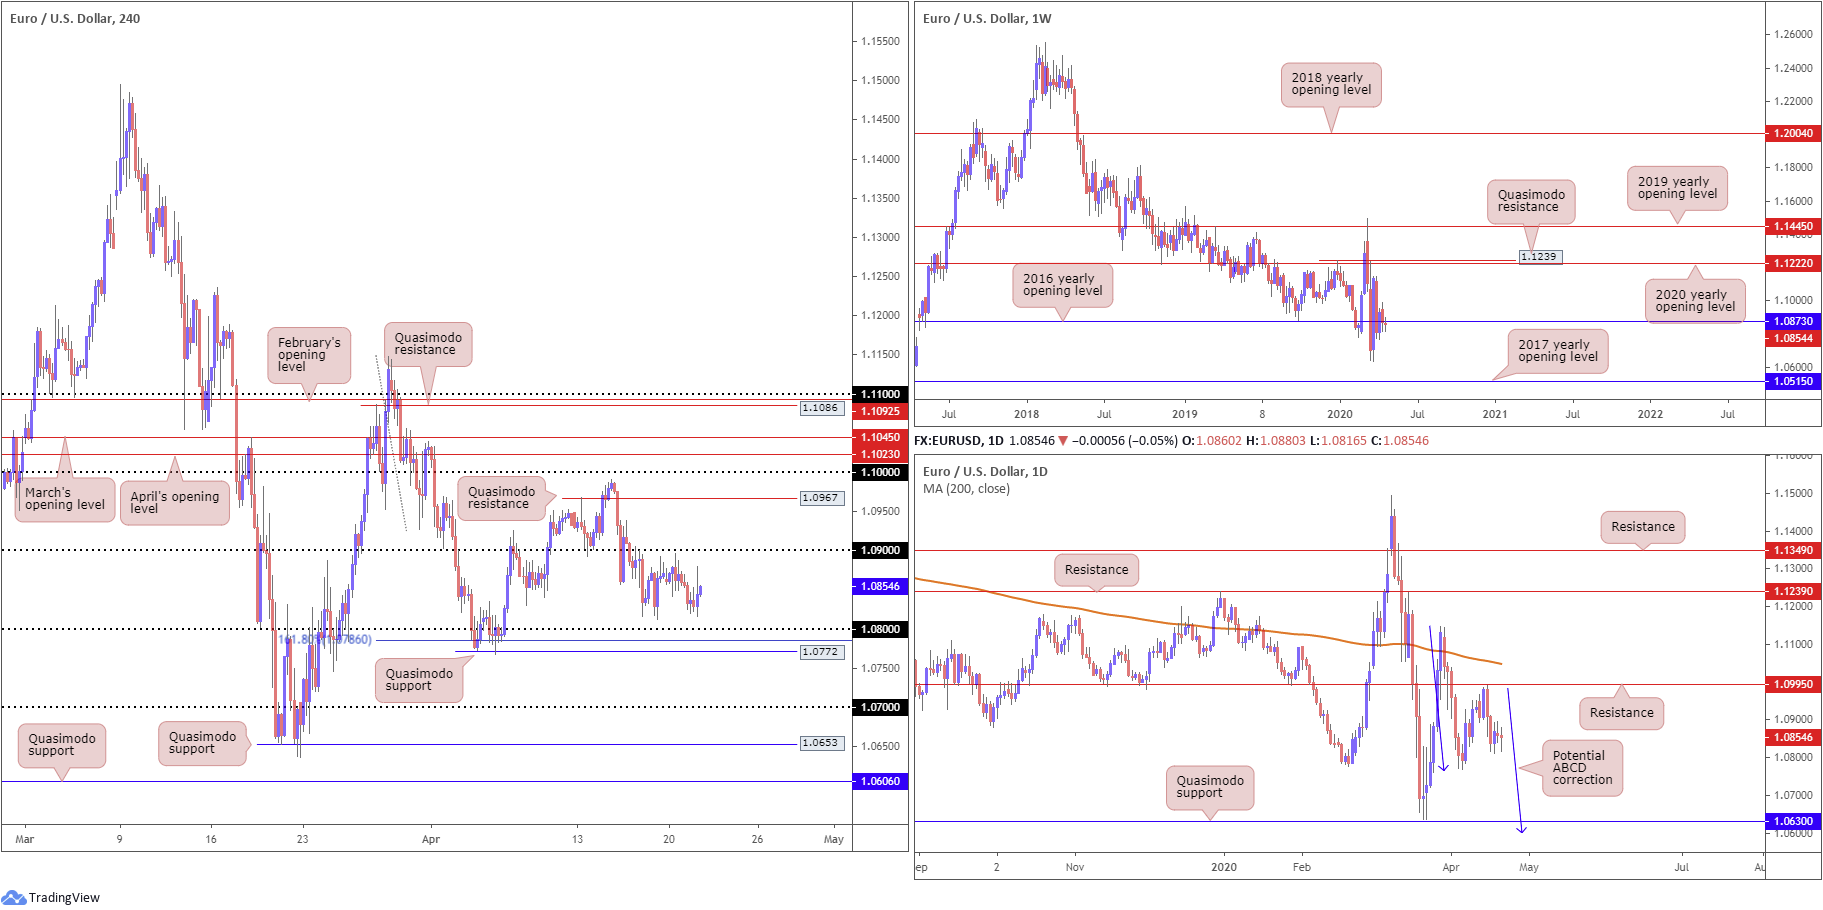
EUR/USD:
The US dollar index, or ‘DXY’, explored ground north of 100.00 Tuesday, though EUR/USD concluded pretty much unchanged for a second successive session. On the data front, the ZEW Indicator of Economic Sentiment for Germany rose by 77.7 points in April 2020, now valued at 28.2 points from -49.5. The assessment of the current economic situation, however, has worsened dramatically, with the corresponding indicator dropping to a new reading of minus 91.5 points, 48.4 points lower than in March[1].
Given another lacklustre session for EUR/USD, much of the following piece will, once again, echo thoughts put forward in Monday’s in-depth technical briefing.
From the weekly timeframe, price action remains linked with its 2016 yearly opening level at 1.0873. Skies above are reasonably blue; a run to the 2020 yearly opening level at 1.1222, shadowed by a Quasimodo resistance at 1.1239 is not out of the question. To the downside, multi-year lows at 1.0635 are in view, with follow-through moves shining the spotlight on the 2017 yearly opening level at 1.0515.
Last week, the daily candles ran into levels just south of resistance at 1.0995, stationed beneath a 200-day SMA (orange – 1.1050). Mid-week witnessed decisive selling, eventually dipping to lows at 1.0812 Friday. Although Monday and Tuesday’s session formed indecision candles, continued downside could have the 1.0768 April 6 low come into existence. Beyond here, Quasimodo support at 1.0630 is also a viable floor, closely shadowed by a potential ABCD correction (blue arrows) at 1.0597.
According to the H4 timeframe, price remains hovering south of 1.09. North of here, there’s space towards Quasimodo resistance at 1.0967, though marking 1.0950 may also be an idea as these mid-round numbers can bounce price. To the downside, 1.08 is visible, shadowed closely by a 161.8% Fibonacci extension point at 1.0786 and Quasimodo support at 1.0772.
Beyond 1.0768 (the April 6 low and lower limit of the H4 Quasimodo support at 1.0772), technical eyes are likely fixed on 1.07, owing to the lack of H4 support in between.
Areas of consideration:
1.08, given its close connection with a 161.8% Fibonacci extension point at 1.0786 and Quasimodo support at 1.0772, could prompt an intraday rebound if brought into play today. Conservative traders may seek additional candlestick confirmation prior to pulling the trigger, however, as round numbers are prone to whipsaws. In fact, a whipsaw to H4 Quasimodo support mentioned above at 1.0772 would not be a surprise.
In the event we conquer 1.0768, the pathway south appears clear for a run to 1.07, potentially unlocking the door for bearish scenarios. Likewise, moves above 1.09 could trigger breakout buying towards 1.0950/1.0967.
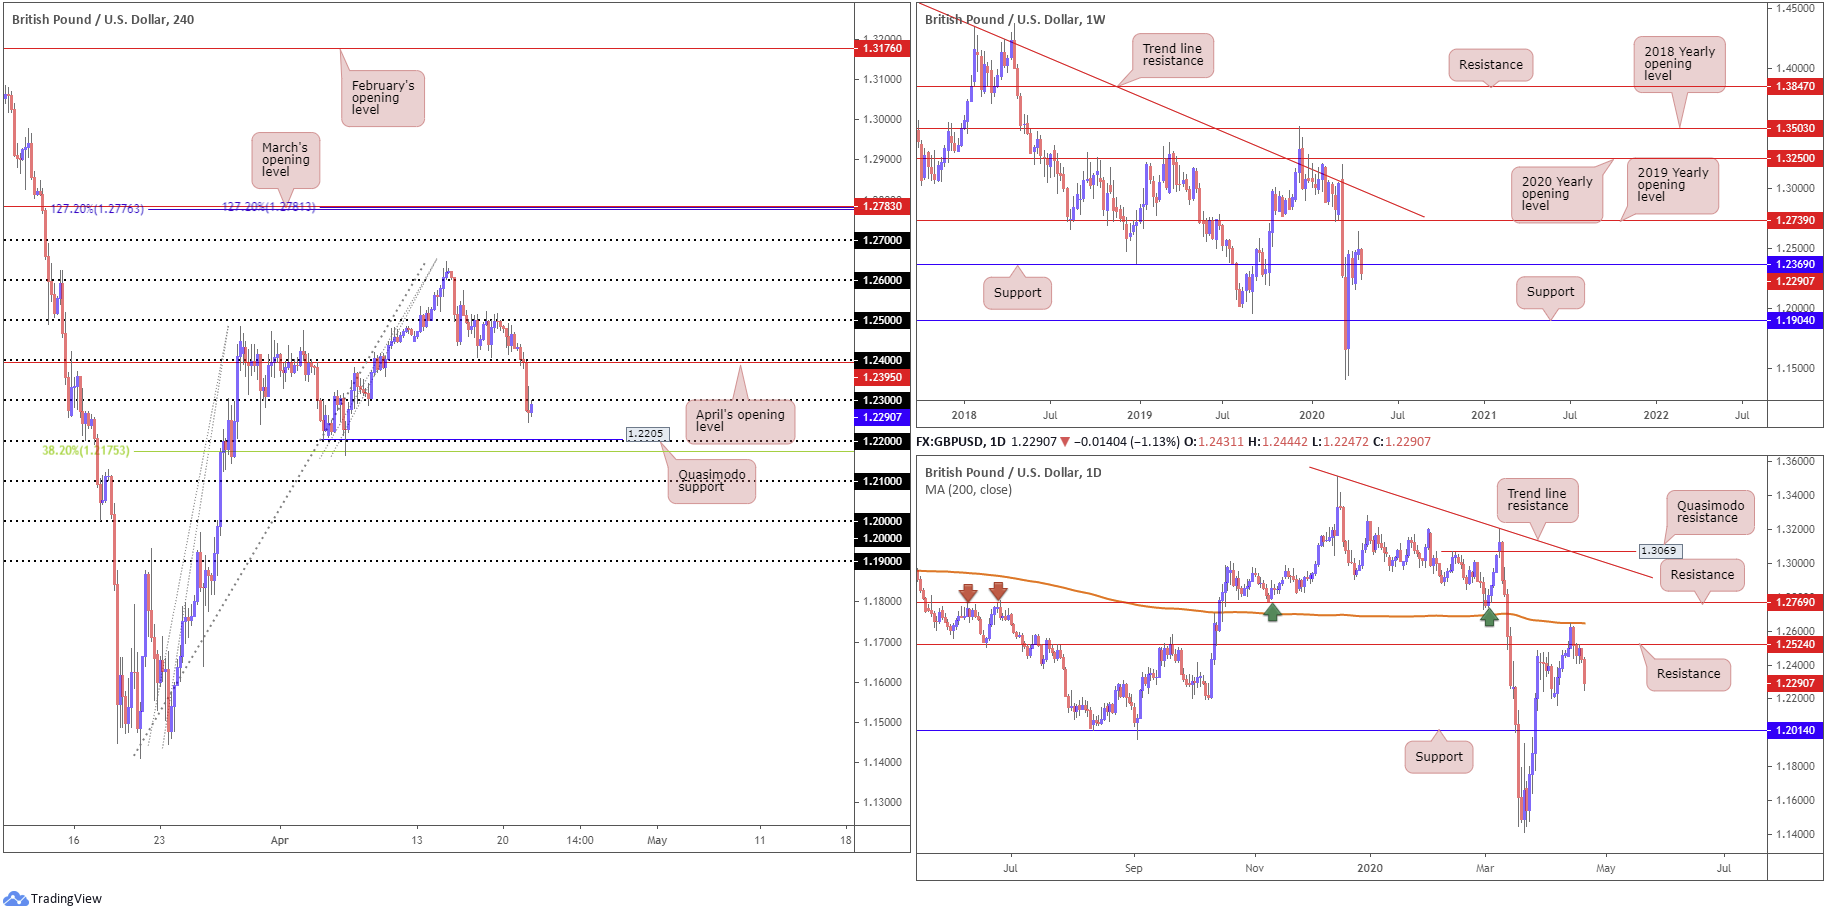
GBP/USD:
The British pound extended losses Tuesday, pressured amid USD demand. In one fell swoop, the H4 candles cleared 1.24, April’s opening level at 1.2395 and 1.23, reaching lows at 1.2247. Quasimodo support resides close by at 1.2205, fixed a few points north of 1.22 and a 38.2% Fibonacci retracement ratio at 1.1753. As of writing, however, 1.23 is being retested as resistance.
On more of a broader perspective, weekly price crossed below support at 1.2369 following a clear-cut shooting star pattern formed the week prior, targeting support at 1.1904. While sellers may not have the fire power to reach this far south this week, it’s certainly a support worthy of the watchlist.
After retesting the underside of resistance on the daily timeframe at 1.2524 and pushing lower yesterday, focus has likely shifted towards the 1.2163 April 7 low as the next viable support on this chart.
Areas of consideration:
Having noted weekly price overrunning support at 1.2369 and daily price eyeing the 1.2163 April 7 low, the retest at 1.23 on the H4 timeframe may be of interest for sellers today. In order to protect against the possibility of a whipsaw, which is common viewing around psychological levels, conservative traders will likely seek additional candlestick confirmation before committing.
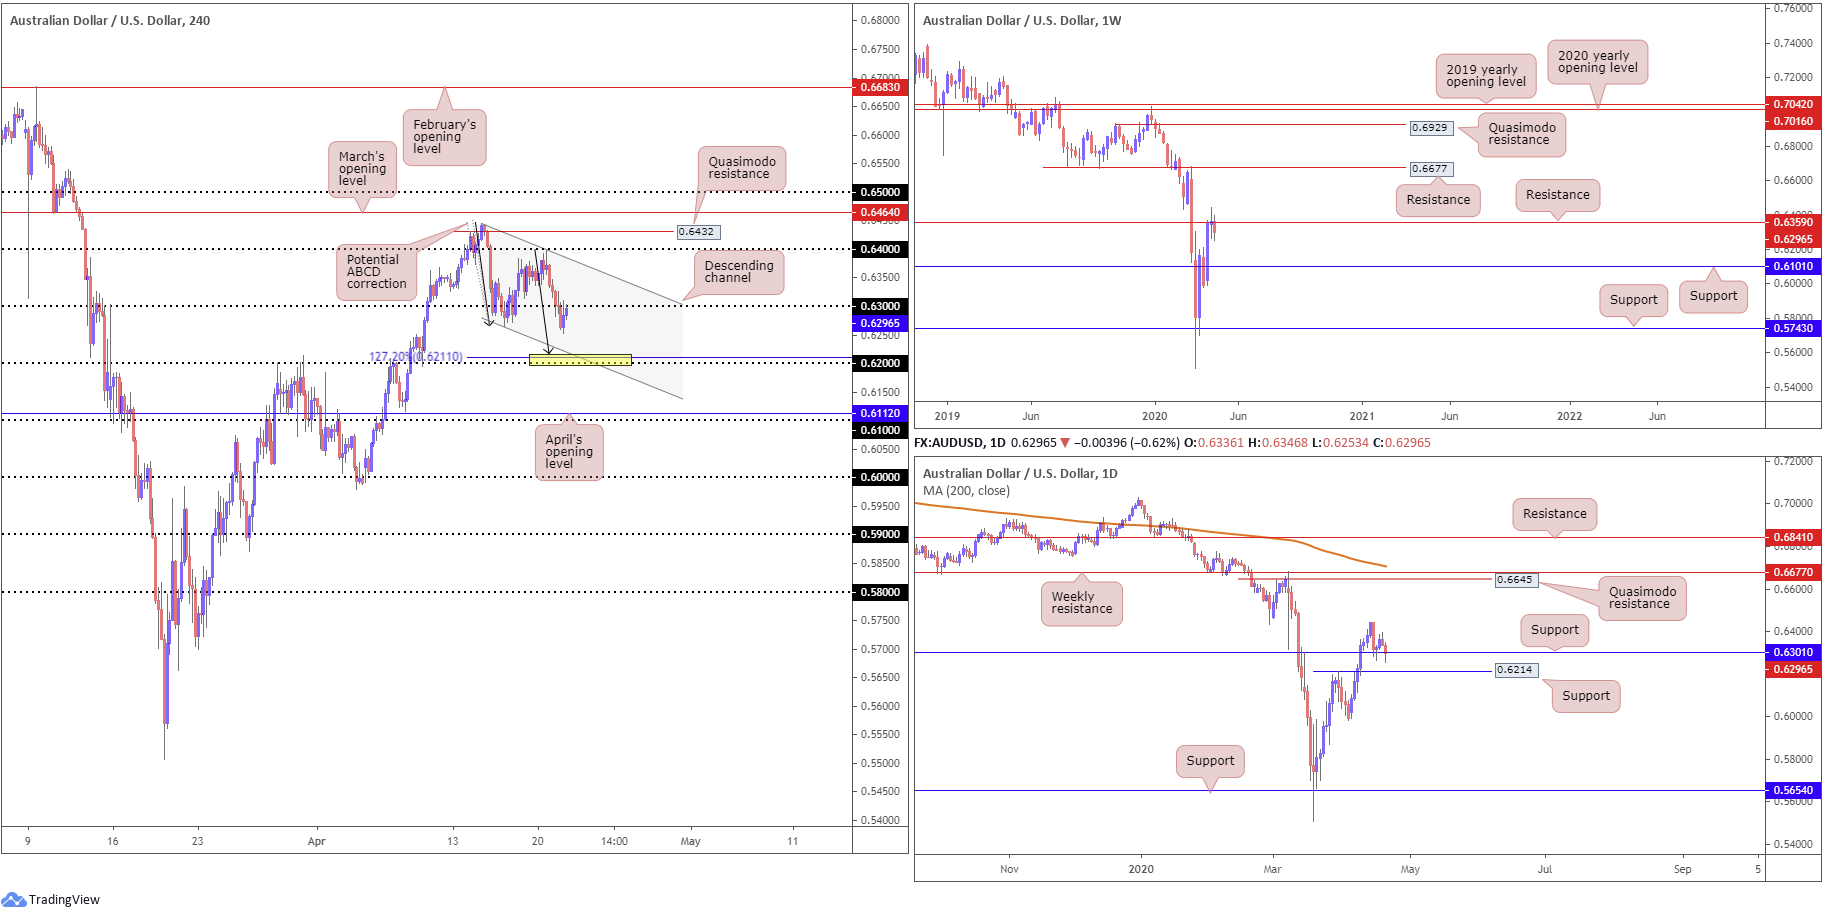
AUD/USD:
AUD/USD prices retreated for a second consecutive session Tuesday, scoring lows at 0.6253.
Price action, based on the weekly timeframe, is seen making its way south of resistance at 0.6359, threatening the possibility of retesting support priced in at 0.6101. The story on the daily timeframe has the unit making its way through support at 0.6301, suggesting scope for a run to nearby support from 0.6214.
Across the page on the H4 timeframe, we can see the candles compressing within a descending channel pattern (0.6444/0.6264). What’s also notable from a technical perspective is we are seeing price retest the underside of 0.63 after breaking the said level to the downside amid early London hours. In addition, a possible 127.2% ABCD correction (black arrows) may terminate just ahead of 0.62.
Areas of consideration:
0.62 remains an area of interest in this market as possible support. The combination of this psychological number, the 127.2% ABCD correction at 0.6211, H4 channel support and daily support from 0.6214 is likely to appeal to buyers (yellow).
Another possibility is sellers making a showing off the underside of 0.63, targeting 0.62.
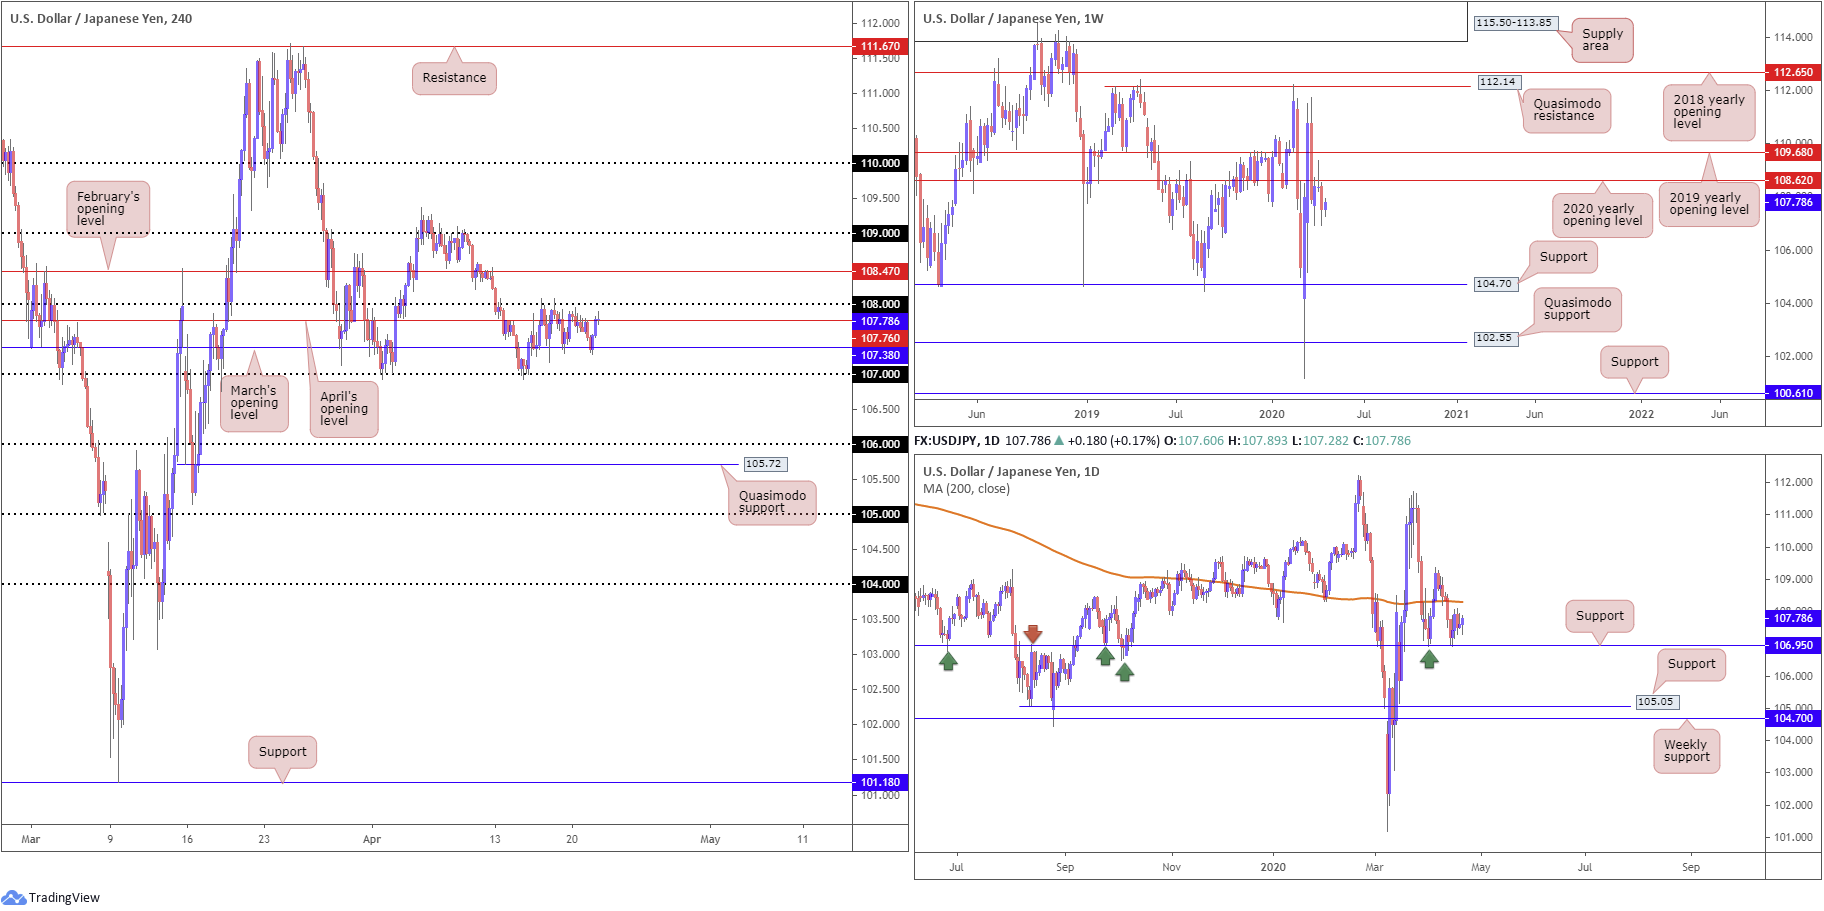
USD/JPY:
USD/JPY continued to trade with a reasonably subdued tone Tuesday, ranging between 107.89 and 107.28. As a result, much of the following piece will represent similar points to Tuesday’s technical briefing.
Since Thursday, the H4 candles have been busy carving out a consolidation between the 108 handle and March’s opening level at 107.38 (note in between this range we also have April’s opening level at 107.76 present). 107 is seen as viable support outside of the consolidation, along with February’s opening level at 108.47 as resistance.
The vibe on the weekly timeframe continues to represent a bearish tone. Price action recently produced a clear-cut shooting star candlestick configuration off the 2020 yearly opening level at 108.62, with last week putting in a strong follow-through move to the downside to lows of 106.92. The next support target is not seen until 104.70. Note this figure also represents the lower boundary of a multi-month range between Quasimodo resistance at 112.14.
Daily support at 106.95 made an appearance mid-week and held ground last week. The 200-day SMA (orange – 108.30) stands as possible resistance this week, whereas a break through 106.95 could land the 105.05 support in the mix, followed by weekly support highlighted above at 104.70.
Areas of consideration:
Traders may wish to acknowledge 107 aligns closely with daily support at 106.95, while February’s opening level at 108.47 comes in closely with the 200-day SMA at 108.30.
Weekly price suggesting lower levels certainly places a question mark on further gains above 108, though if we’re able to reach 108.47, active sellers are likely to enter the fray. The combination of daily support at 106.95 and 107 may also spark a reaction if tested.
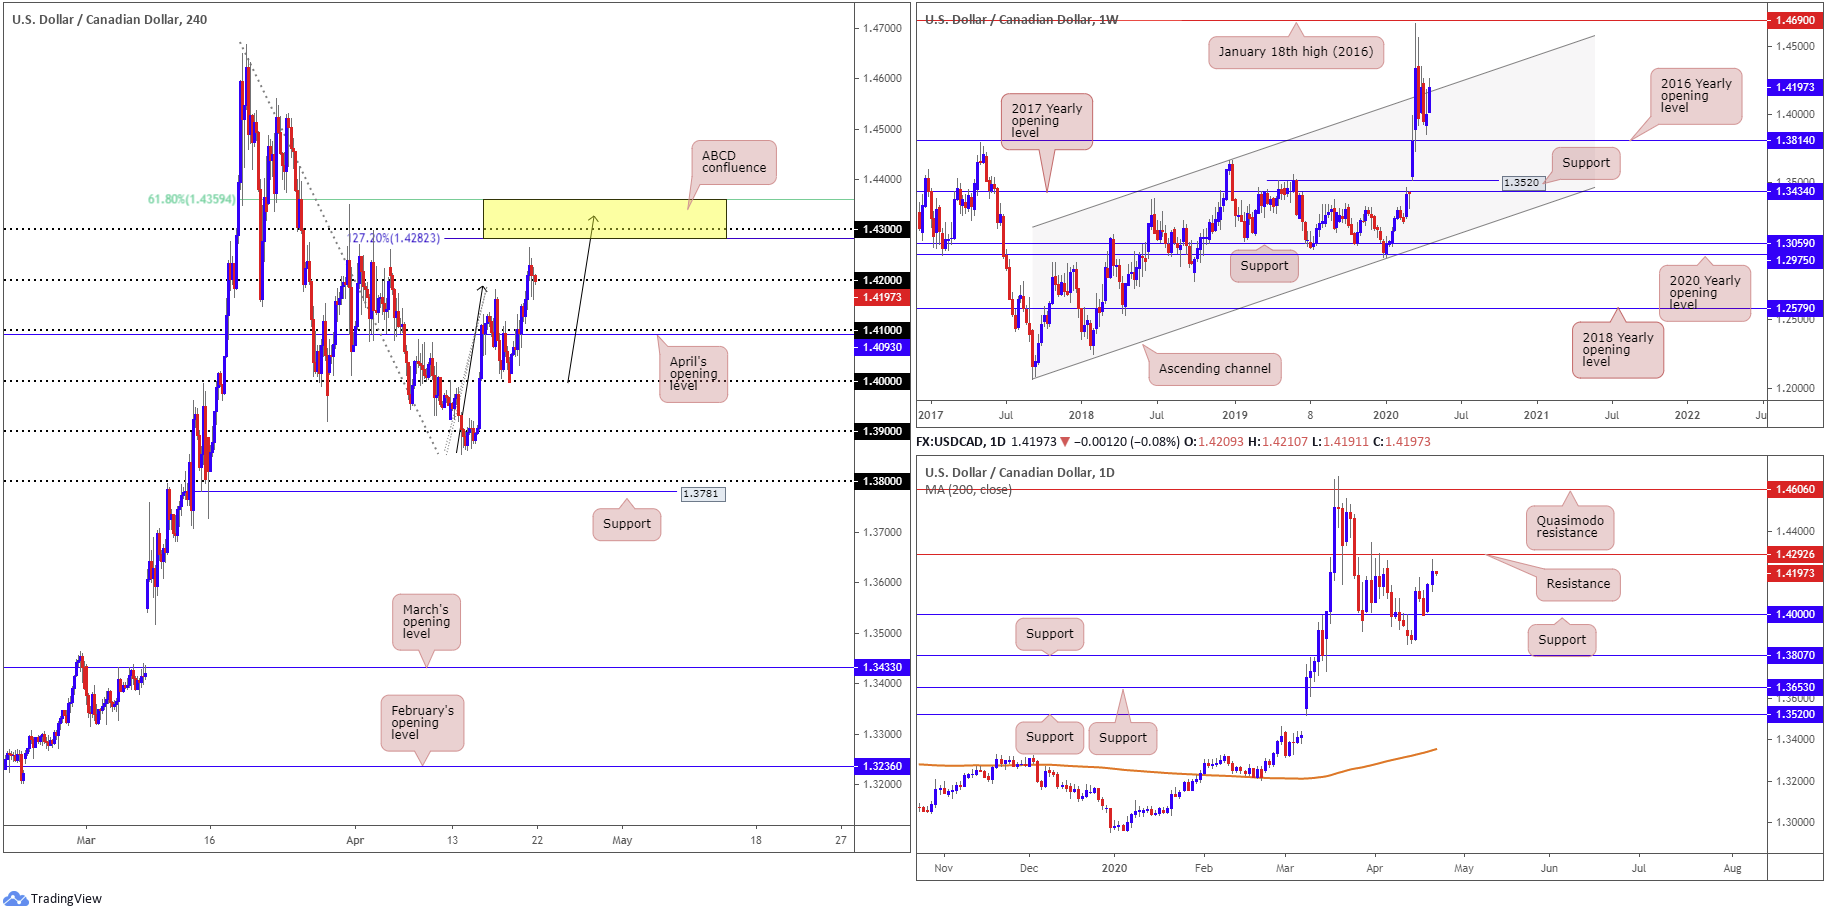
USD/CAD:
The US dollar firmed against its Canadian counterpart Tuesday, reaching highs at 1.4264 before retreating marginally sub 1.42. As evident from the H4 timeframe, price action topped just ahead of an interesting area of resistance made up of a 61.8% Fibonacci retracement at 1.4359, the 1.43 handle and an ABCD (black arrows) 127.2% Fibonacci extension at 1.4282. Continued downside from current price on the H4 timeframe could draw in the 1.41 handle along with April’s opening level at 1.4093.
Over on the weekly timeframe, price is seen engaging with a long-term channel resistance, extended from the high 1.3661. This follows a near-test of the 2016 yearly opening level at 1.3814 the week prior. Coming from the daily timeframe, we can see the couple came within striking distance of resistance at 1.4292 before rotating southbound. Support on the daily timeframe remains around 1.4000.
Areas of consideration:
Technically, there’s still a chance we may connect with 1.4359/1.4283 on the H4 timeframe today which may offer possible shorting opportunities, given its local confluence and relationship with daily resistance at 1.4292.
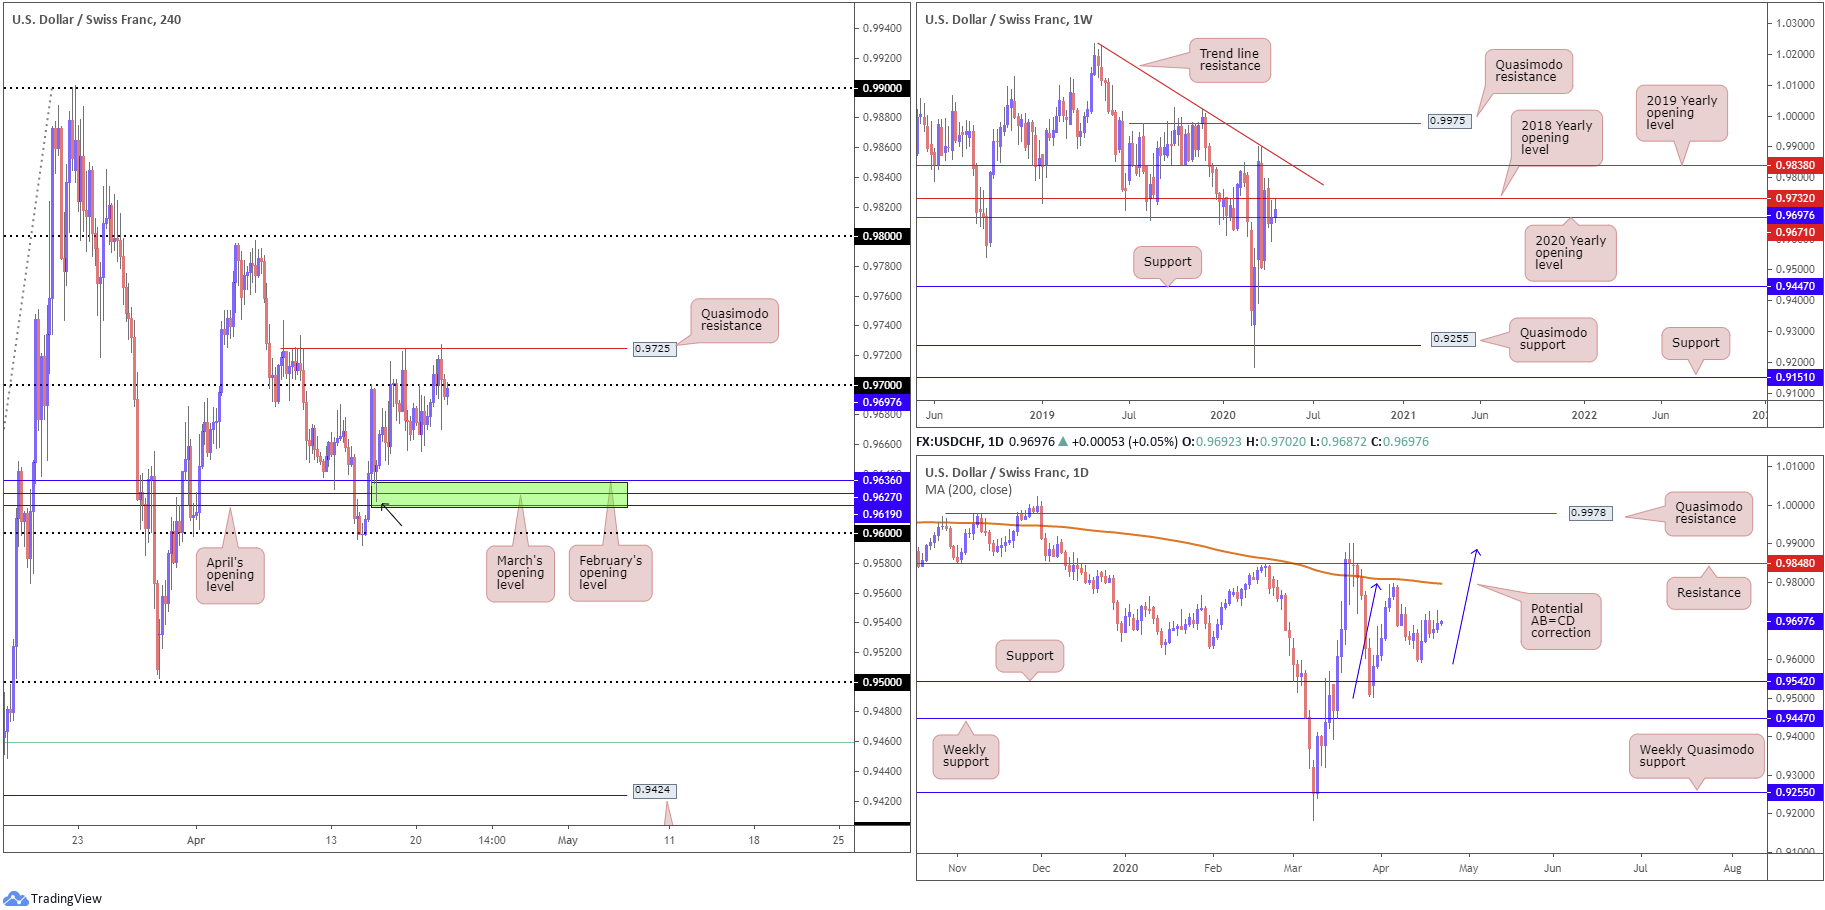
USD/CHF:
All in all, it was a reasonably mellow session Tuesday, ranging no more than 60 points on the day. H4 price brushed aside 0.97 once again and challenged Quasimodo resistance at 0.9725 before retreating sub 0.97 into the close.
Note upon exploring higher ground above 0.97, price action came within touching distance of testing the 2018 yearly opening level at 0.9732, posted on the weekly timeframe. Traders will also likely acknowledge that beneath current price on the weekly chart, the 2020 yearly opening level at 0.9671 resides close by.
The daily timeframe, as of the current close, offers little in terms of support or resistance. To the upside, resistance is unlikely to emerge until reaching the 200-day SMA (orange – 0.9796), accompanied by 0.9848 and a potential AB=CD correction (blue arrows) at 0.9886. Lower on the curve we have support priced in at 0.9542, situated just ahead of weekly support at 0.9447.
Areas of consideration:
With Quasimodo resistance at 0.9725 in the spotlight, and given its positioned reasonably close to the 2018 yearly opening level at 0.9732, we could be in for further losses south of 0.97 on the H4 timeframe. As such, should H4 price pencil in a notable bearish candlestick signal from 0.97 today, moves towards the H4 support zone at 0.9619/0.9636 are possible (green), an area made up of April, March and February’s opening levels.
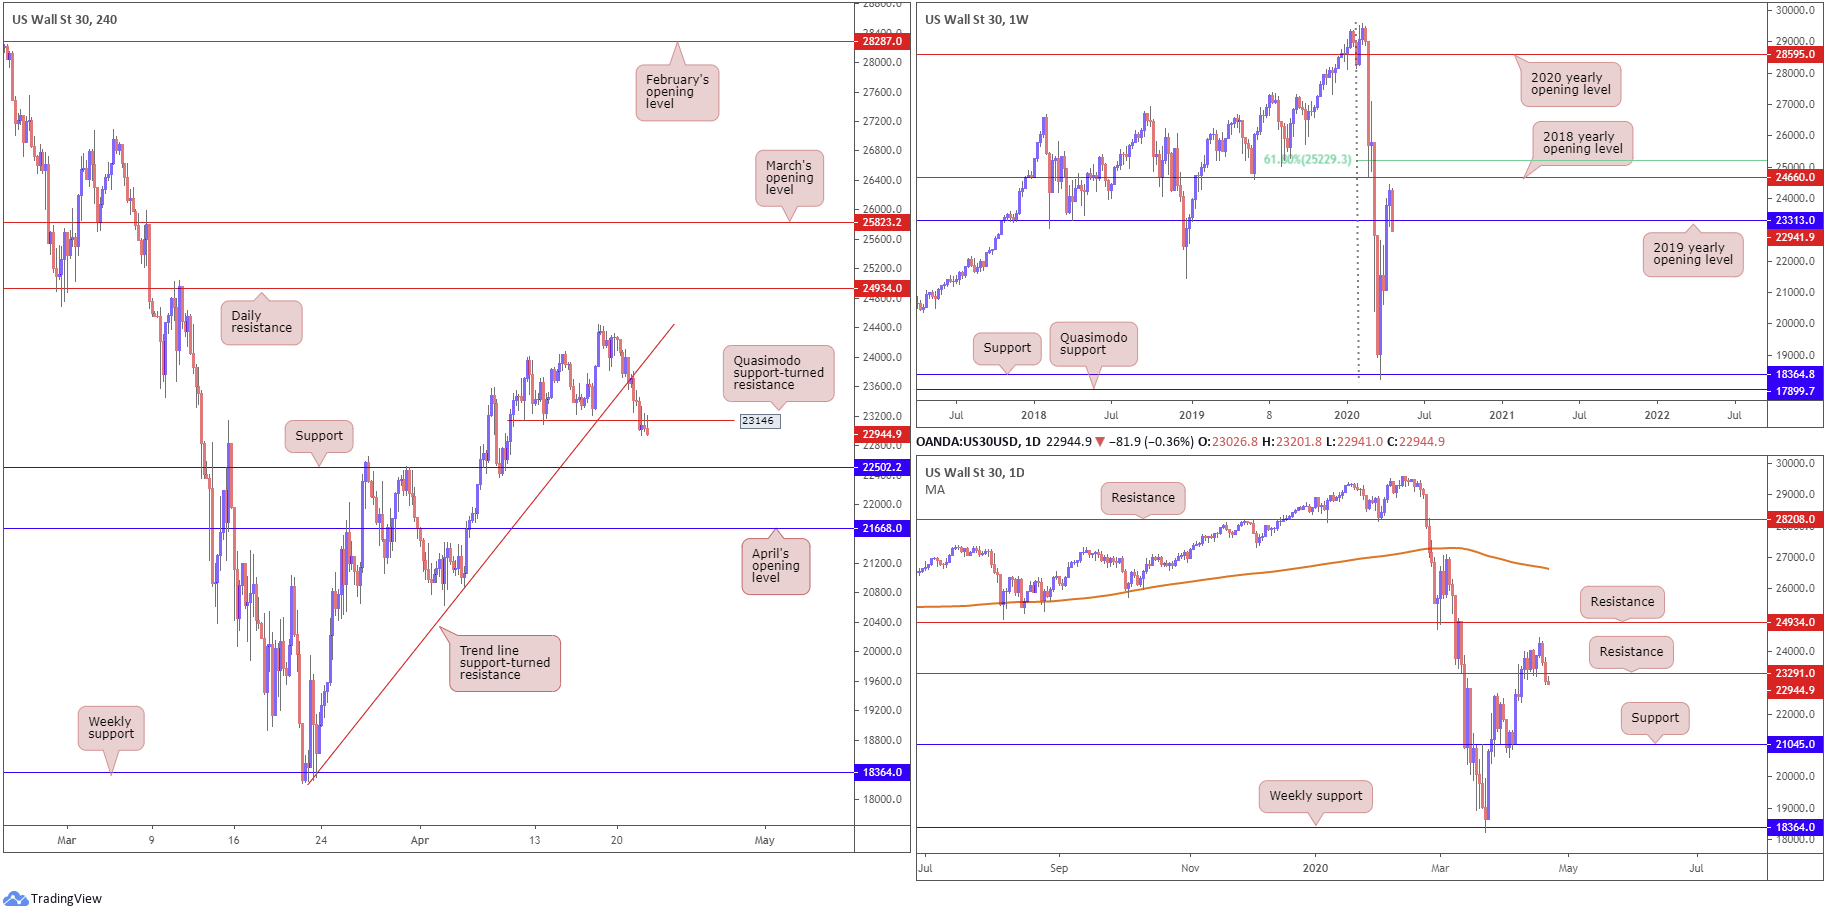
Dow Jones Industrial Average:
Tuesday had US stocks finish sharply lower across the board as tech shares ceded ground and the sell-off in oil prices weighed on sentiment. The Dow Jones Industrial Average erased 631.56 points, or 2.67%; the S&P 500 also lost 86.60 points, or 3.07%, and the tech-heavy Nasdaq 100 concluded lower by 323.51 points, or 3.71%.
Kicking off from the top this morning, the key technical observation on the weekly timeframe is the break back beneath the 2019 yearly opening level at 23313. While it’s far to early to tell if the break lower has any meaning, research reveals limited support until reaching 18364 on the weekly chart.
A closer reading of price action on the daily timeframe shows the unit crossed through support at 23291 (now a serving resistance) and perhaps unshackled downside to support coming in at 21045. Interestingly, on the H4 timeframe, we broke through trend line support, taken from the low 18221. Additionally, we are also testing the underside of a Quasimodo support-turned resistance at 23146, shaped by way of two back-to-back selling wicks. Downside support can be found at 22502, with a breach underlining the possibility of a run to April’s opening level at 21668.
Areas of consideration:
Chart studies suggest further losses, with traders potentially looking to short at current price, largely based on the back of H4 retesting the underside of 23146 and the higher timeframes crossing through supports.
H4 support targets from current price, as highlighted above, may fall in at 22502, followed by April’s opening level at 21668.
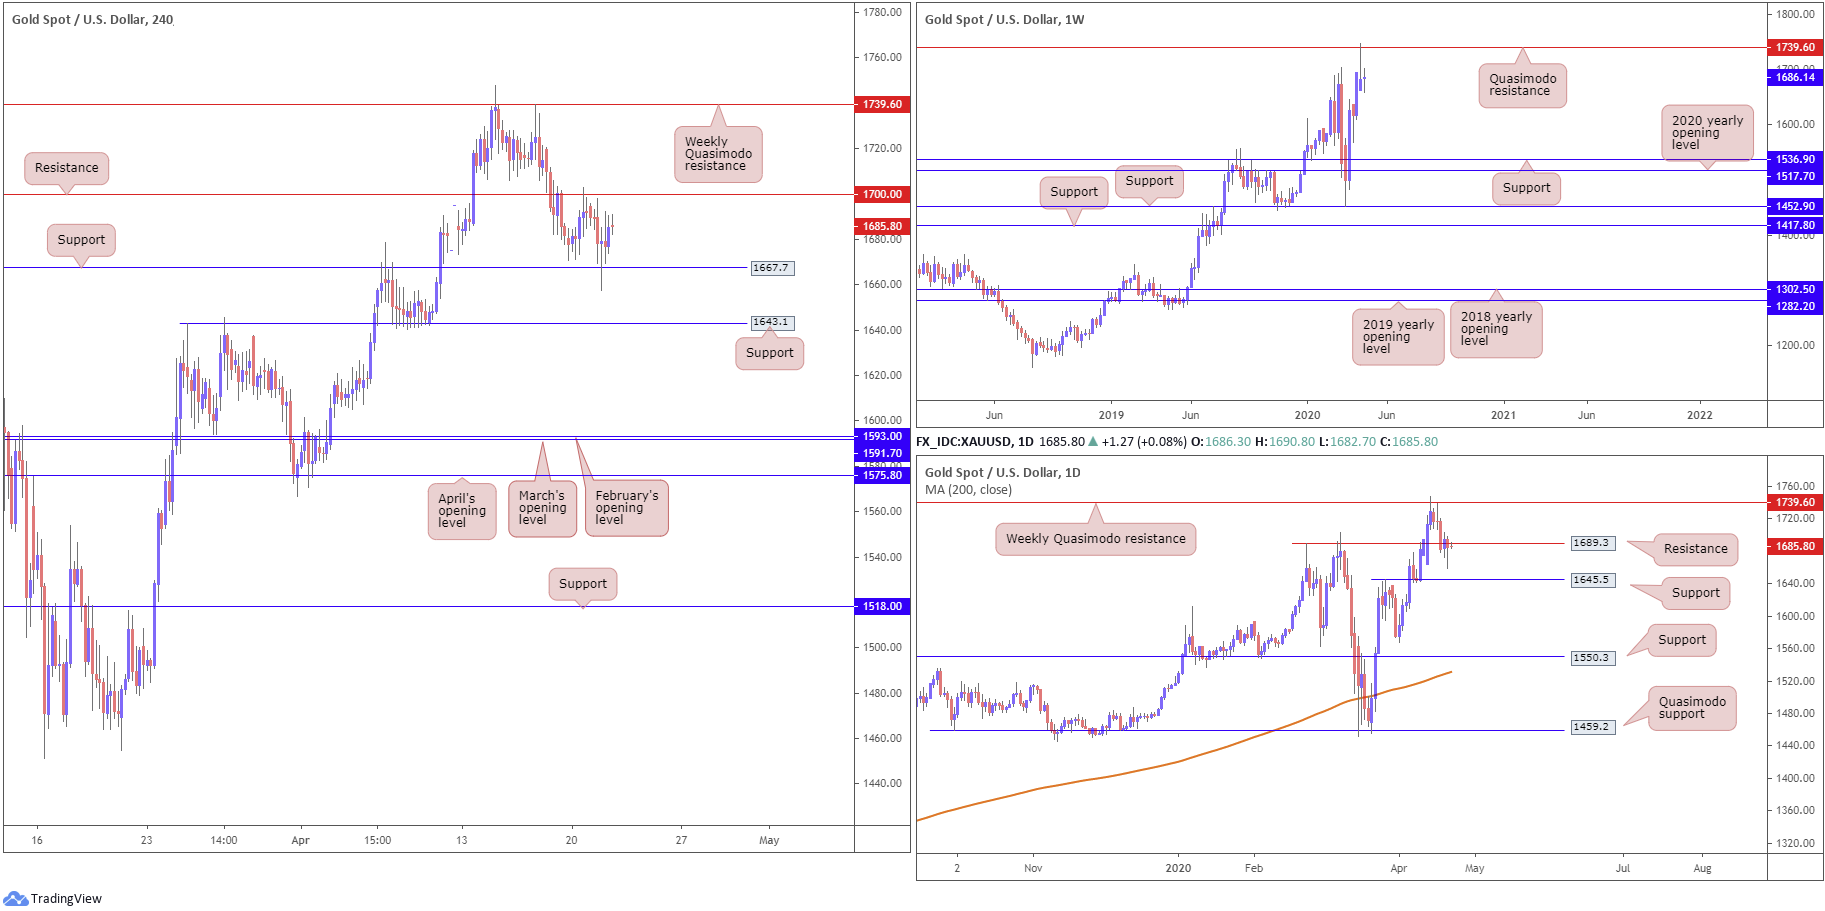
XAU/USD (GOLD):
The yellow metal failed to capitalise amid the risk-off vibe across global equities Tuesday, with gold settling 0.60% lower against the buck at the close of trade.
Technically, H4 support at 1667.7 stepped in and provided a floor heading into US hours, sited nearby another layer of support, a prior Quasimodo resistance, at 1643.1. Resistance is seen at 1700.0, with a break possibly paving the way back up to weekly Quasimodo resistance at 1739.6.
On note of the weekly timeframe, technical research shows last week clocked highs at 1747.7, levels not seen since November 2012, and concluded shaped as a clear-cut shooting star candlestick pattern (considered a bearish signal) off Quasimodo resistance at 1739.6. This will likely excite candlestick enthusiasts, with some perhaps setting sell-stop entry orders south of last week’s low 1663.0 (which were likely filled yesterday). In terms of support on the weekly scale, the river appears relatively ‘ripple free’ until reaching support at 1536.9.
Looking at gold from a daily viewpoint, resistance at 1689.3 remains in the fold. Buyers are clearly fragile here, emphasising the possibility of a decline to support at 1645.5.
Areas of consideration:
Weekly price bringing in Quasimodo resistance and forming a strong bearish candlestick signal, as well as daily action emphasising the possibility of striking 1645.5, could see the H4 candles hold any retest off 1700.0. This level, therefore, likely remains a possible sell zone for many traders. Conservative traders, however, may opt to wait and see if a H4 bearish candlestick forms off 1700.0 before pulling the trigger.
In the event we eventually overrun H4 support at 1667.7, breakout sellers may show interest towards H4 support at 1643.1, though do remain cognisant of daily support potentially entering the fold at 1645.5.
The accuracy, completeness and timeliness of the information contained on this site cannot be guaranteed. IC Markets does not warranty, guarantee or make any representations, or assume any liability regarding financial results based on the use of the information in the site.
News, views, opinions, recommendations and other information obtained from sources outside of www.icmarkets.com.au, used in this site are believed to be reliable, but we cannot guarantee their accuracy or completeness. All such information is subject to change at any time without notice. IC Markets assumes no responsibility for the content of any linked site.
The fact that such links may exist does not indicate approval or endorsement of any material contained on any linked site. IC Markets is not liable for any harm caused by the transmission, through accessing the services or information on this site, of a computer virus, or other computer code or programming device that might be used to access, delete, damage, disable, disrupt or otherwise impede in any manner, the operation of the site or of any user’s software, hardware, data or property.
[1] https://www.zew.de/en/presse/pressearchiv/verbesserung-auf-extrem-niedrigem-niveau/


