
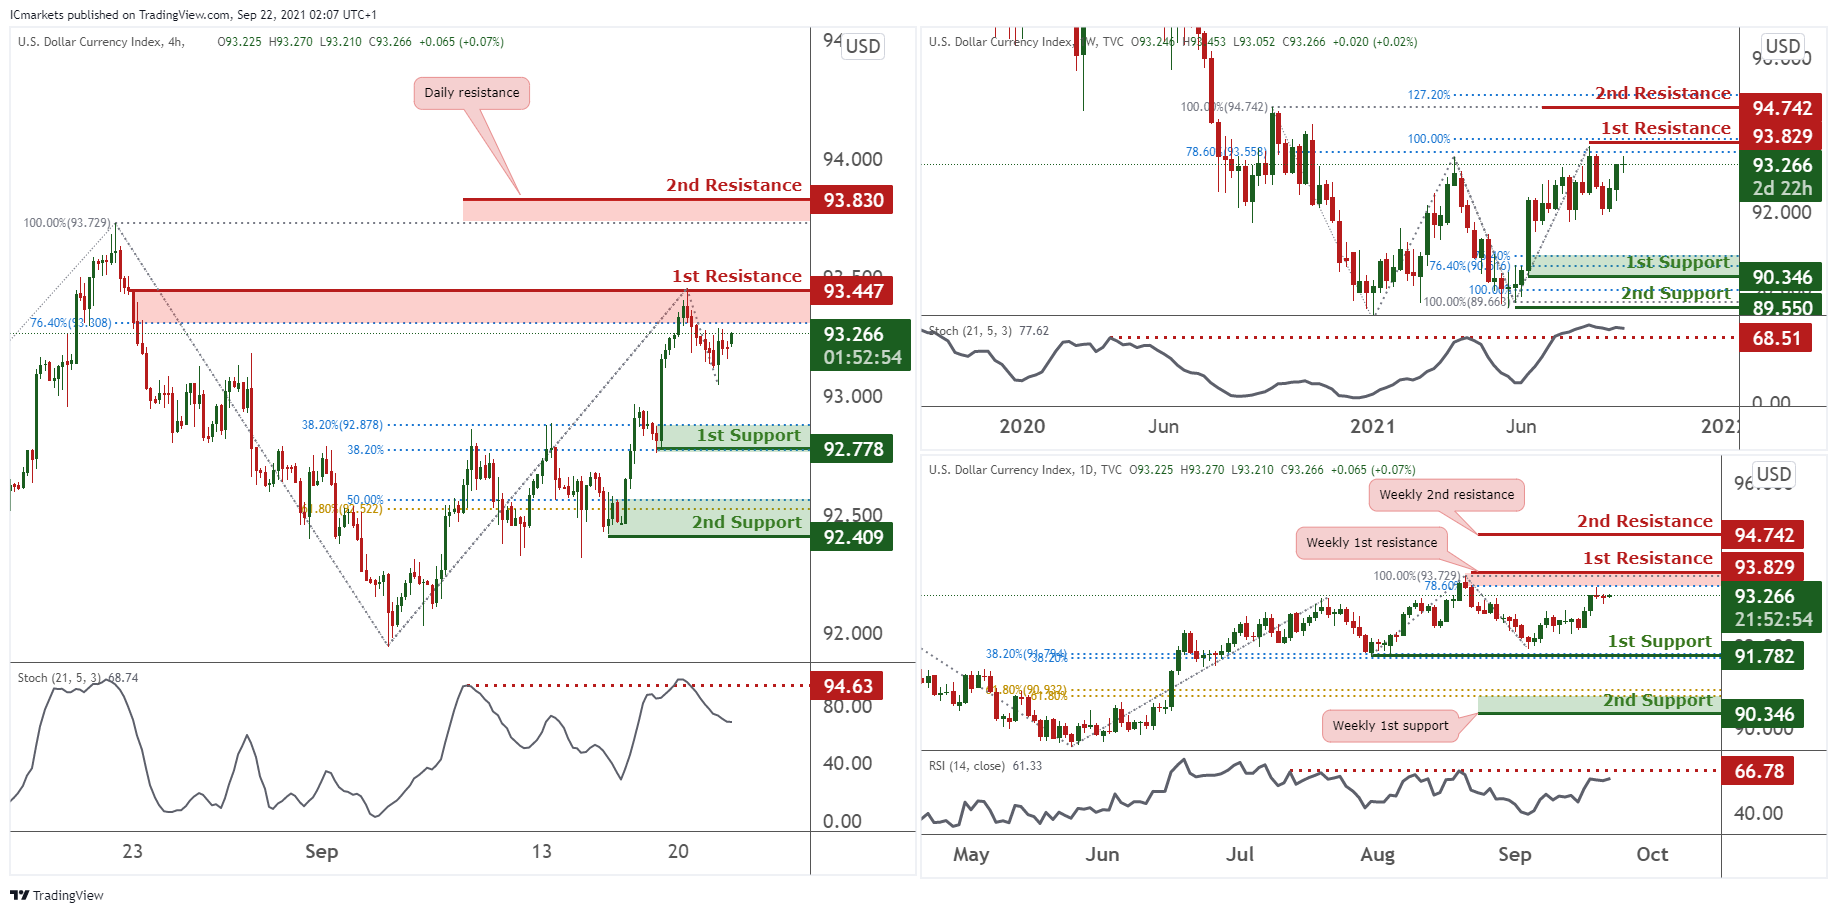
DXY:
Looking at the Weekly chart price may bearish towards the 1st support at 90.346 in line with 76.4% Fibonacci retracement and 76.4% Fibonacci extension. Our bearish bias is further supported by stochastic testing resistance where price dropped in the past. Otherwise, price may be bullish towards the 1st resistance at 93.829 in line with 78.6% Fibonacci retracement and 100% Fibonacci extension.
On the Daily timeframe, Price may bearish from 1st resistance at 93.829 in line with Horizontal swing and 78.6% Fibonacci extension towards the 1st support at 91.782 in line with 38.2% Fibonacci retracement and 38.2% Fibonacci extension. Our bearish bias is further supported by RSI is also reacting below resistance where price dropped in the past . Otherwise, price may bullish towards the 2nd resistance at 92.742 in line with Weekly 2nd resistance.
On the H4 timeframe, prices reversed off 1st resistance at 93.447 in line with 76.4% fibonacci retracement and 127.2% Fibonacci extension and may face bearish pressure towards the 1st support at 92.778 in line with 38.2% Fibonacci retracement and 38.2% Fibonacci extension. Our bearish bias is further supported by stochastic testing resistance where price dropped in the past. Otherwise, price may bullish towards the 2nd resistance at 93.830 in line with Horizontal swing high and 161.8% Fibonacci extension.
Areas of consideration:
- H4 time frame, 1st resistance of 93.447
- H4 time frame, 1st support of 92.778
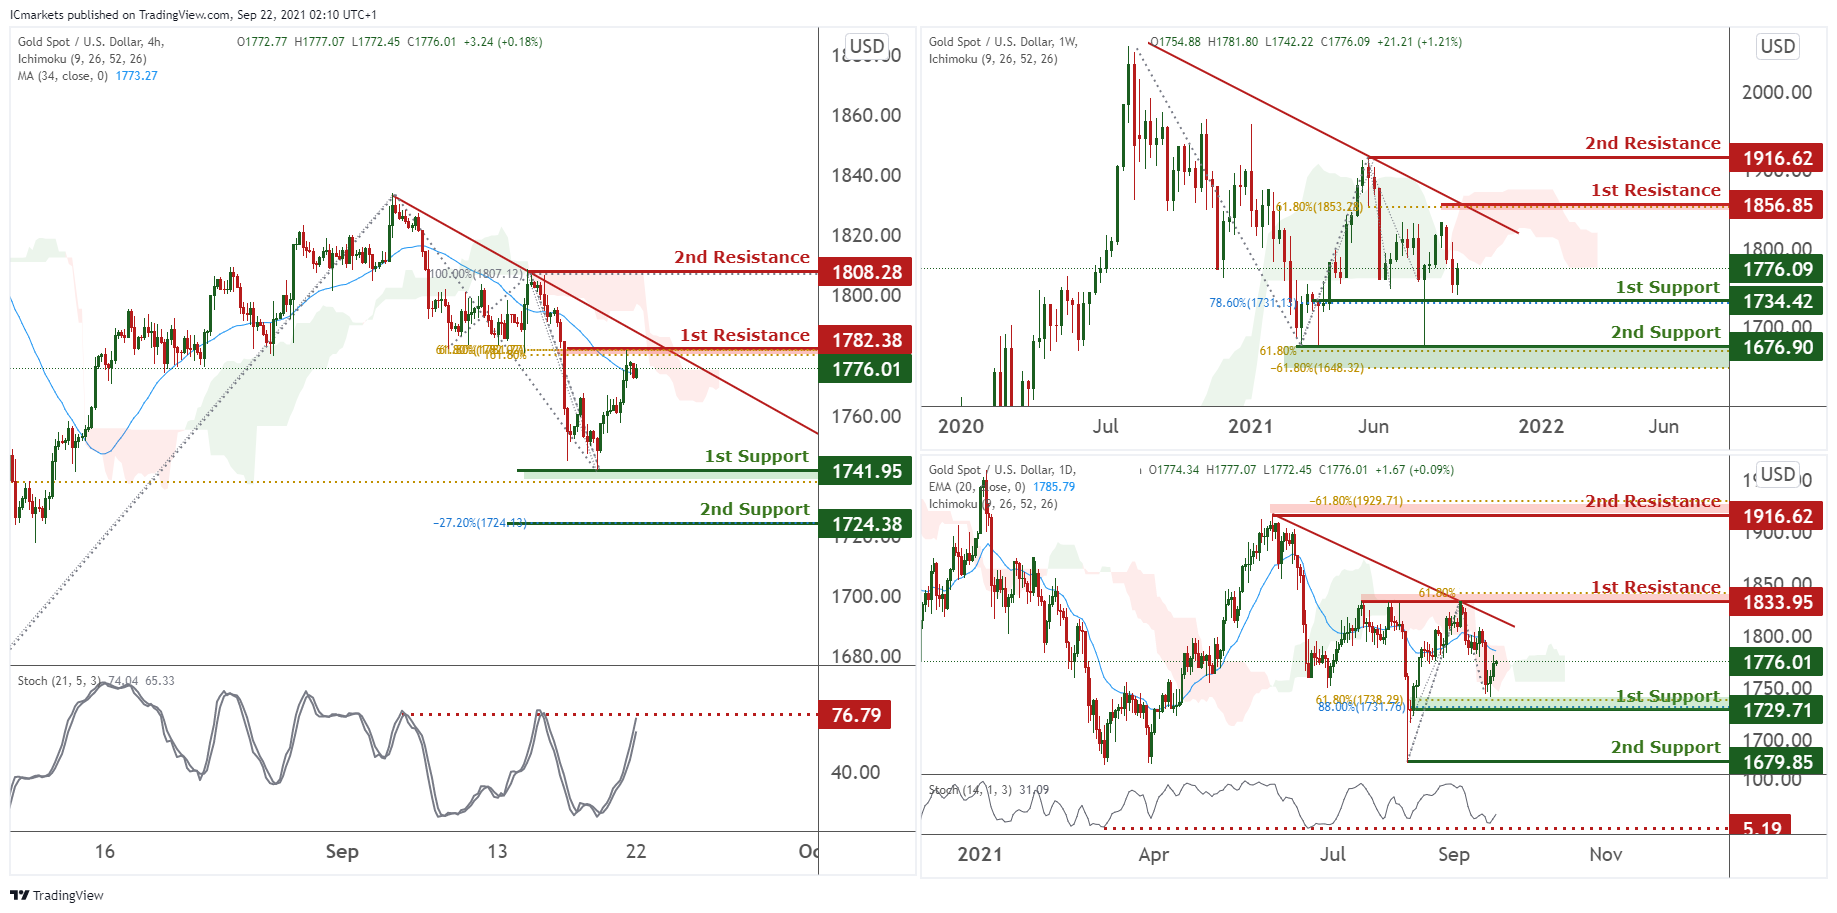
XAU/USD (GOLD):
On the weekly timeframe, price is on a downward trend and might be dipping towards 1st support at 1734.42, 78.6% Fibonacci retracement. Long term buyers could look to short the market as indicators are showing bearish momentum. Breaking the 1st support will see prices dipping further to our 2nd area of support at 1681.75, between 61.8% Fibonacci extension and -61.8% Fibonacci retracement. Alternatively, we might see price rebound to the bearish trendline before dipping further.
On the Daily chart, price has dipped below our 20 EMA and has recently bounced off our area of 1st support at 1729.71 in line with 61.8% and 88% Fibonacci retracement. We see the possibility of prices reacting at our 1st support and experience bullish reversal towards 1st resistance at 1833.95 in line with 61.8% Fibonacci retracement and bearish trendline. Technical indicators are forecasting potential trend reversal.
On the H4 chart, price has recently bounced off 1st resistance at 1782.38 in line with 61.8% Fibonacci retracement and 161.8% Fibonacci extension. Price may potentially dip further down towards our 1st support at 1741.95 in line with 61.8% and our graphical swing low. Ichimoku clouds are forecasting bearish momentum and stochastics are approaching levels where dips have occurred previously. In addition, our moving average is on a downward momentum. Alternatively, if prices breaks 1st resistance, they may climb higher to test our 2nd resistance at 1808.28 which is a graphical swing high.
Areas of consideration:
- 4h 1st support at 1741.95
- 4h 1st resistance 1782.38
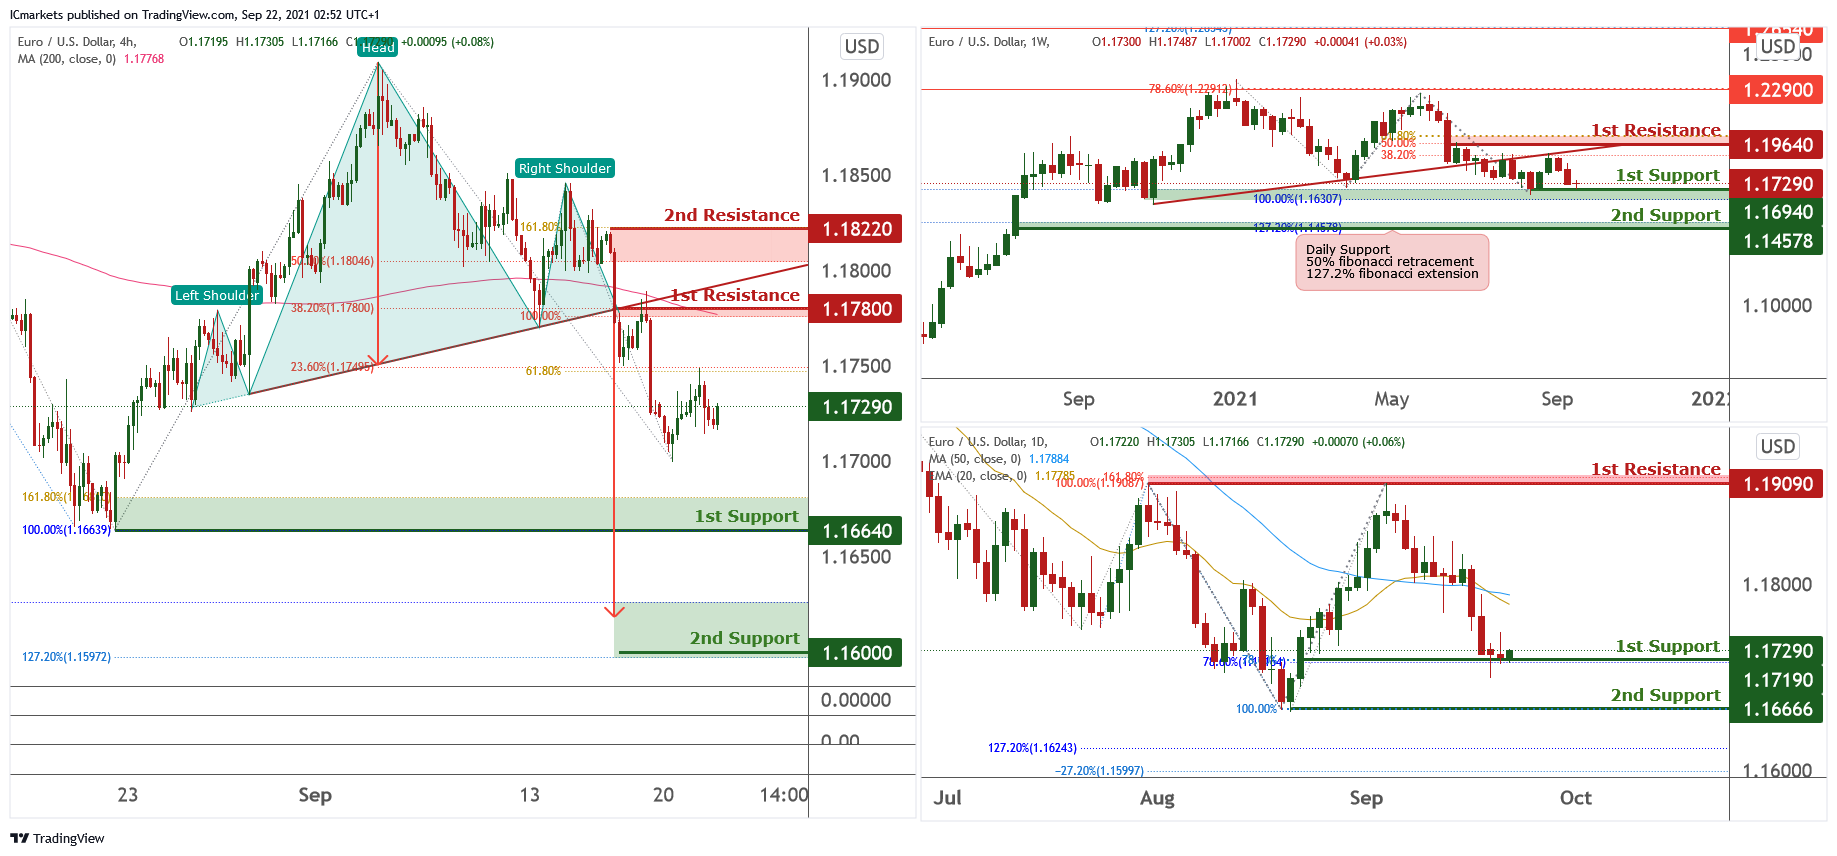
EUR/USD:
Looking at the weekly chart we can see that the price is flirting with the first support at 1.17250, in-line with 38.2% Fibonacci retracement and 100% Fibonacci extension. On the Daily chart, prices are consolidating above first support at 1.17190, in-line with 78.6% Fibonacci retracement and 78.6% Fibonacci extension. Price could potentially drop to next support at 1.17190, in-line with 100% Fibonacci retracement and 100% Fibonacci extension.
On the H4 timeframe price faced bearish pressure from resistance at 1.17495, in-line with 23.6% Fibonacci retracement, 127.2% Fibonacci extension and horizontal overlap resistance. Price is potentially playing out head & shoulder pattern and we expect it to continue its bearish momentum towards first support at 1.16640, in-line with 100% Fibonacci retracement, 161.8% Fibonacci extension and swing low support. The next support could potentially be at 1.16000, in-line with 127.2% Fibonacci retracement and 127.2% Fibonacci extension.
If prices bounces above, it could potentially swing towards first resistance at 1.17800, in-line with 38.2% Fibonacci retracement, 100% Fibonacci extension and horizontal overlap resistance. The next potential resistance could be at 1.18220, in-line with 50% Fibonacci retracement, 161.8% Fibonacci extension and horizontal overlap resistance.
Areas of consideration:
- H4 time frame, support level at 1.16640 and 1.16000
- H4 time frame, resistance level at 1.17800 and 1.18220
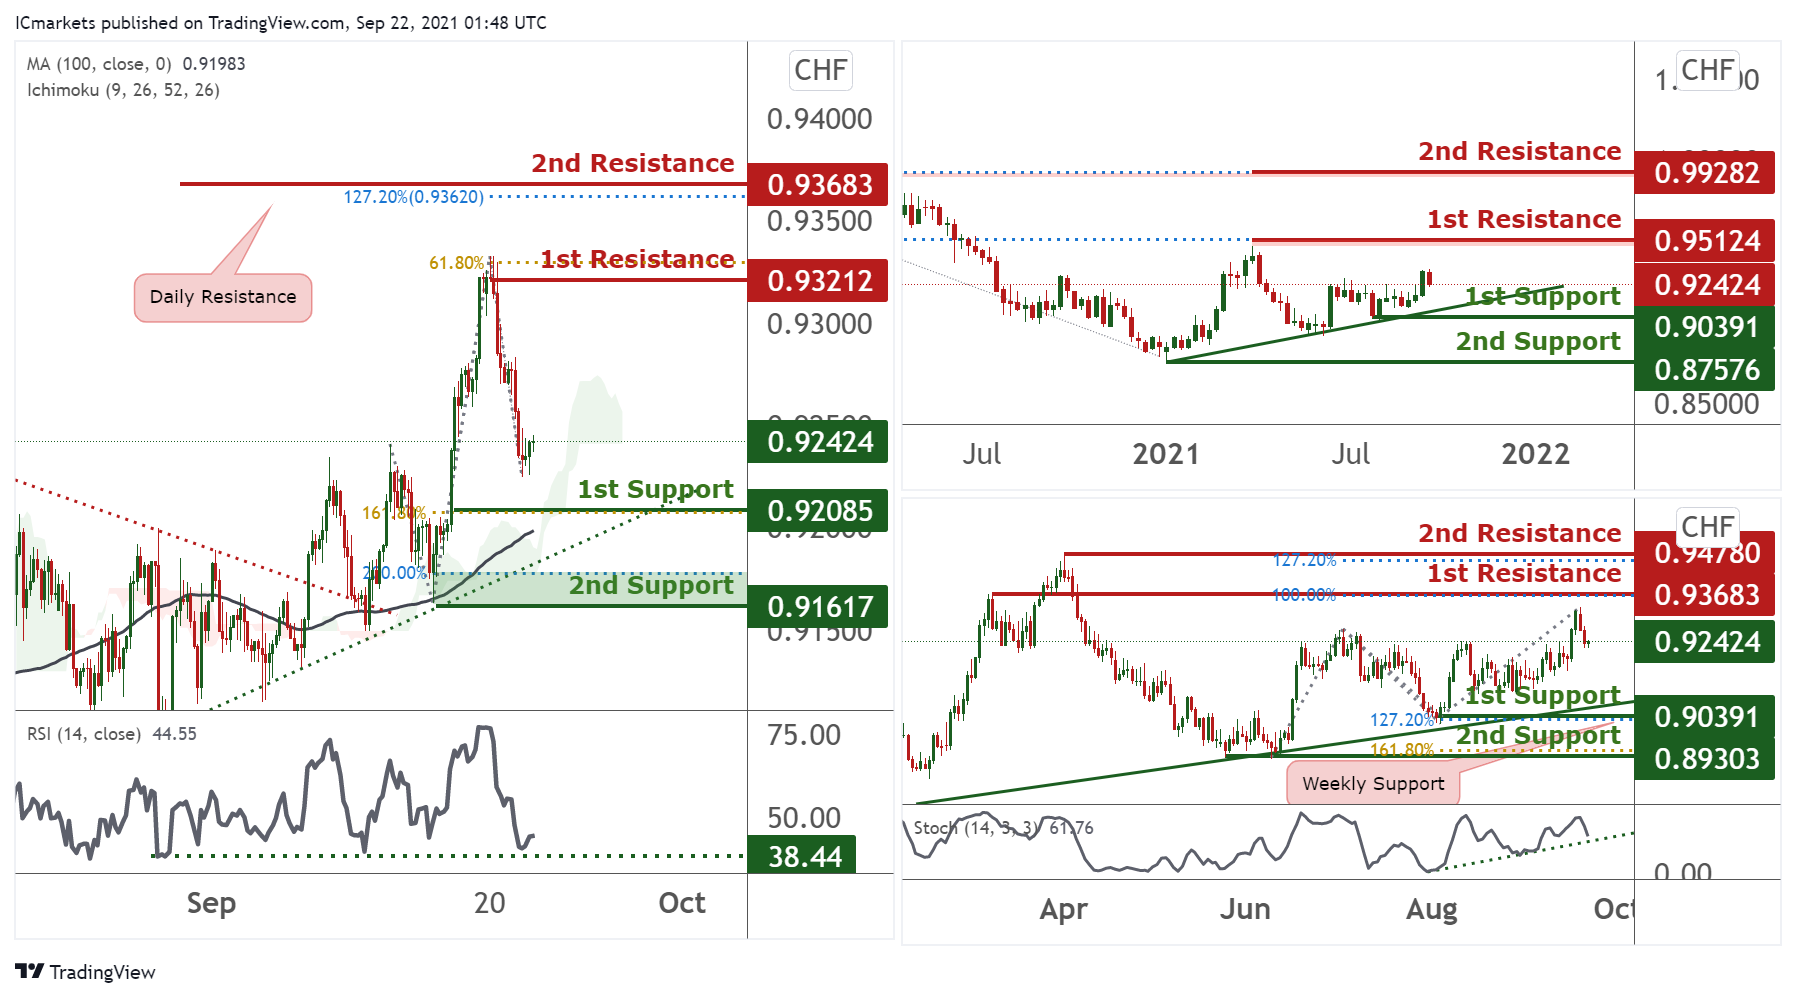
USD/CHF:
On the weekly, price is holding above ascending trendline support and also between 1st resistance at 0.95124 and 1st support at 0.90391. Traders should watch these levels closely for a break to see prices swing higher or drop lower. On the Daily, the price is consolidating in between the 1st support and resistance. It is seen to have a bullish movement towards the 1st resistance at 0.93683. With stochastics abiding to the ascending trendline, we can see that there is potential continuation of the bullish movement.
On the H4, price is seen to be reacting in between 1st Resistance 0.93212 and 1st Support 0.92085 and holding above the ascending trendline support . We can expect the price to rise to 1st Resistance in line with 61.8% Fibonacci projection. Our bullish bias is further supported by the price holding above the moving average, the RSI indicator where it bounced off the strong support line and price holding above the Ichimoku cloud.
Areas of consideration:
- Watch 1st resistance at 0.93212
- Watch 1st support at 0.92085
GBP/USD:
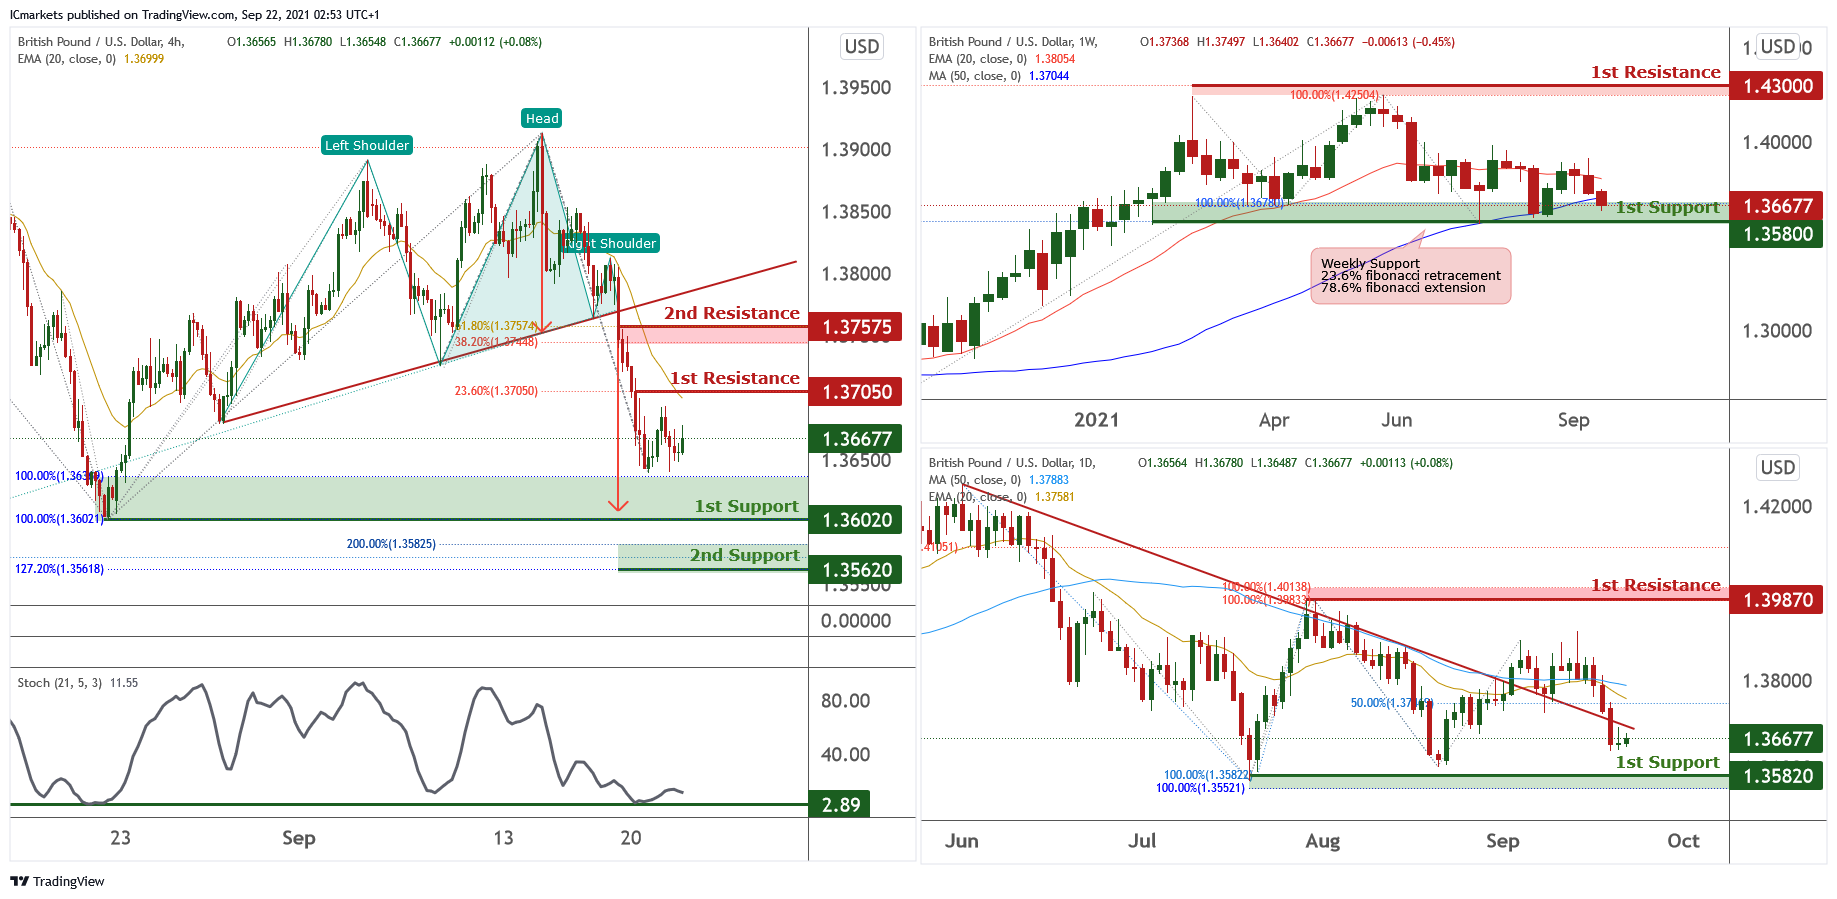
Looking at the weekly chart, the price has come back above previous support at around 1.35800, in-line with 23.6% Fibonacci retracement and 100% Fibonacci extension. On the Daily time frame, price had breakdown from previous trendline support and could potentially drop further to first support at 1.35820, in-line with 100% Fibonacci retracement and 100% Fibonacci extension.
On the H4 timeframe prices are flirting below first resistance at 1.37050, in-line with 23.6% Fibonacci retracement and 20 EMA. It could potentially swing towards first resistance before facing further bearish pressure. If price bounces above first resistance, the next resistance could potentially be at 1.37575, in-line with 38.2% Fibonacci retracement and 61.8% Fibonacci extension.
Price is potentially playing out head & shoulder pattern and we could expect it to drop towards first support at 1.36020, in-line with 100% Fibonacci retracement, 100% Fibonacci extension and swing low support. This is also the price target for the head & shoulder target. The next potential support could be at 1.35620, in-line with 127.2% and 200% Fibonacci extension.
Areas of consideration:
- H4 time frame, 36020 and 1.35620 support level
- H4 time frame, 1.37050 and 1.37575 resistance level
USD/JPY
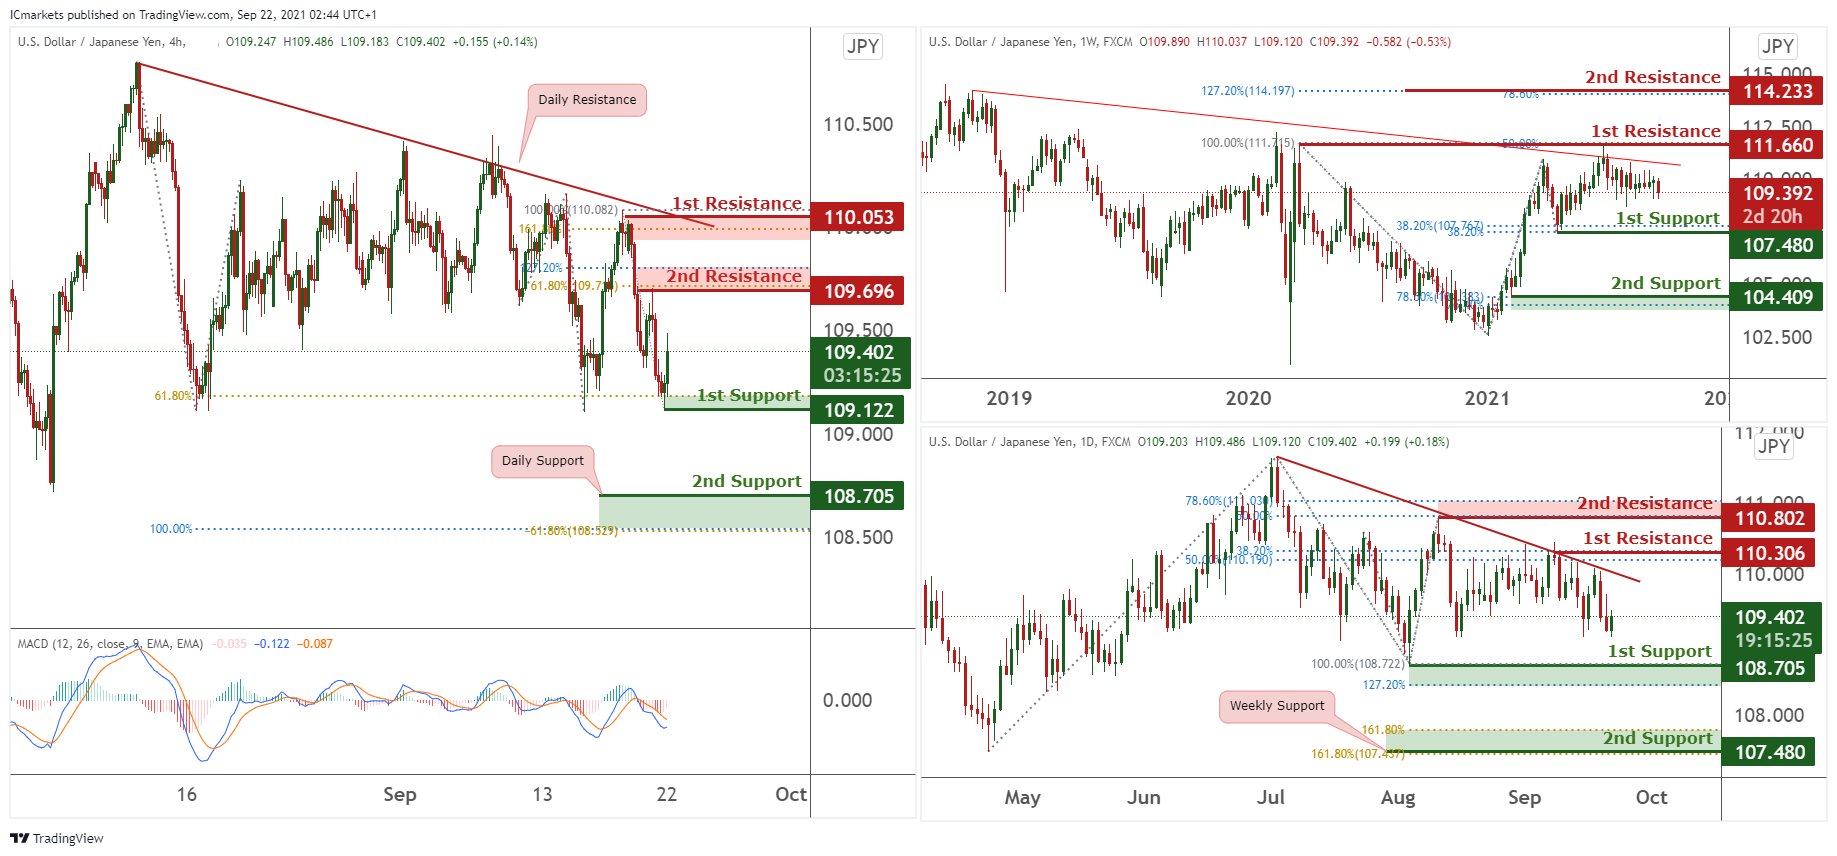
From the weekly timeframe, price is below the descending trendline resistance, and may bearish to 1st support 107.480 in line with 38.2% Fibonacci retracement and 38.2% Fibonacci extension. Otherwise, price might move towards the 1st resistance at 111.660 in line with Horizontal Swing High and 50% Fibonacci extension.
On the Daily timeframe, price is below the descending trendline resistance and may bearish to 1st support at 108.705 in line with Horizontal Swing Low and 127.2% Fibonacci extension. Otherwise, price might move towards the 2nd resistance at 110.802 in line with 78.6% Fibonacci retracement and 50% Fibonacci extension.
On the H4 timeframe, price is below the descending threadline resistance and may continue to face bearish pressure and break 1st support at 109.122 in line with Horizontal swing low and 61.8% Fibonacci extension towards 2nd support at 108.705 in line with -61.8% Fibonacci retracement and 100% extension. Our bearish view is further supported by how MACD is shown to be holding below the 0 line. Otherwise, price may bullish towards the 2nd resistance at 110.306 in line with 78.6% Fibonacci retracement.
Areas of consideration:
- H4 time frame, 2nd resistance of 110.306
- H4 time frame, 2nd support of 108.705
AUD/USD:
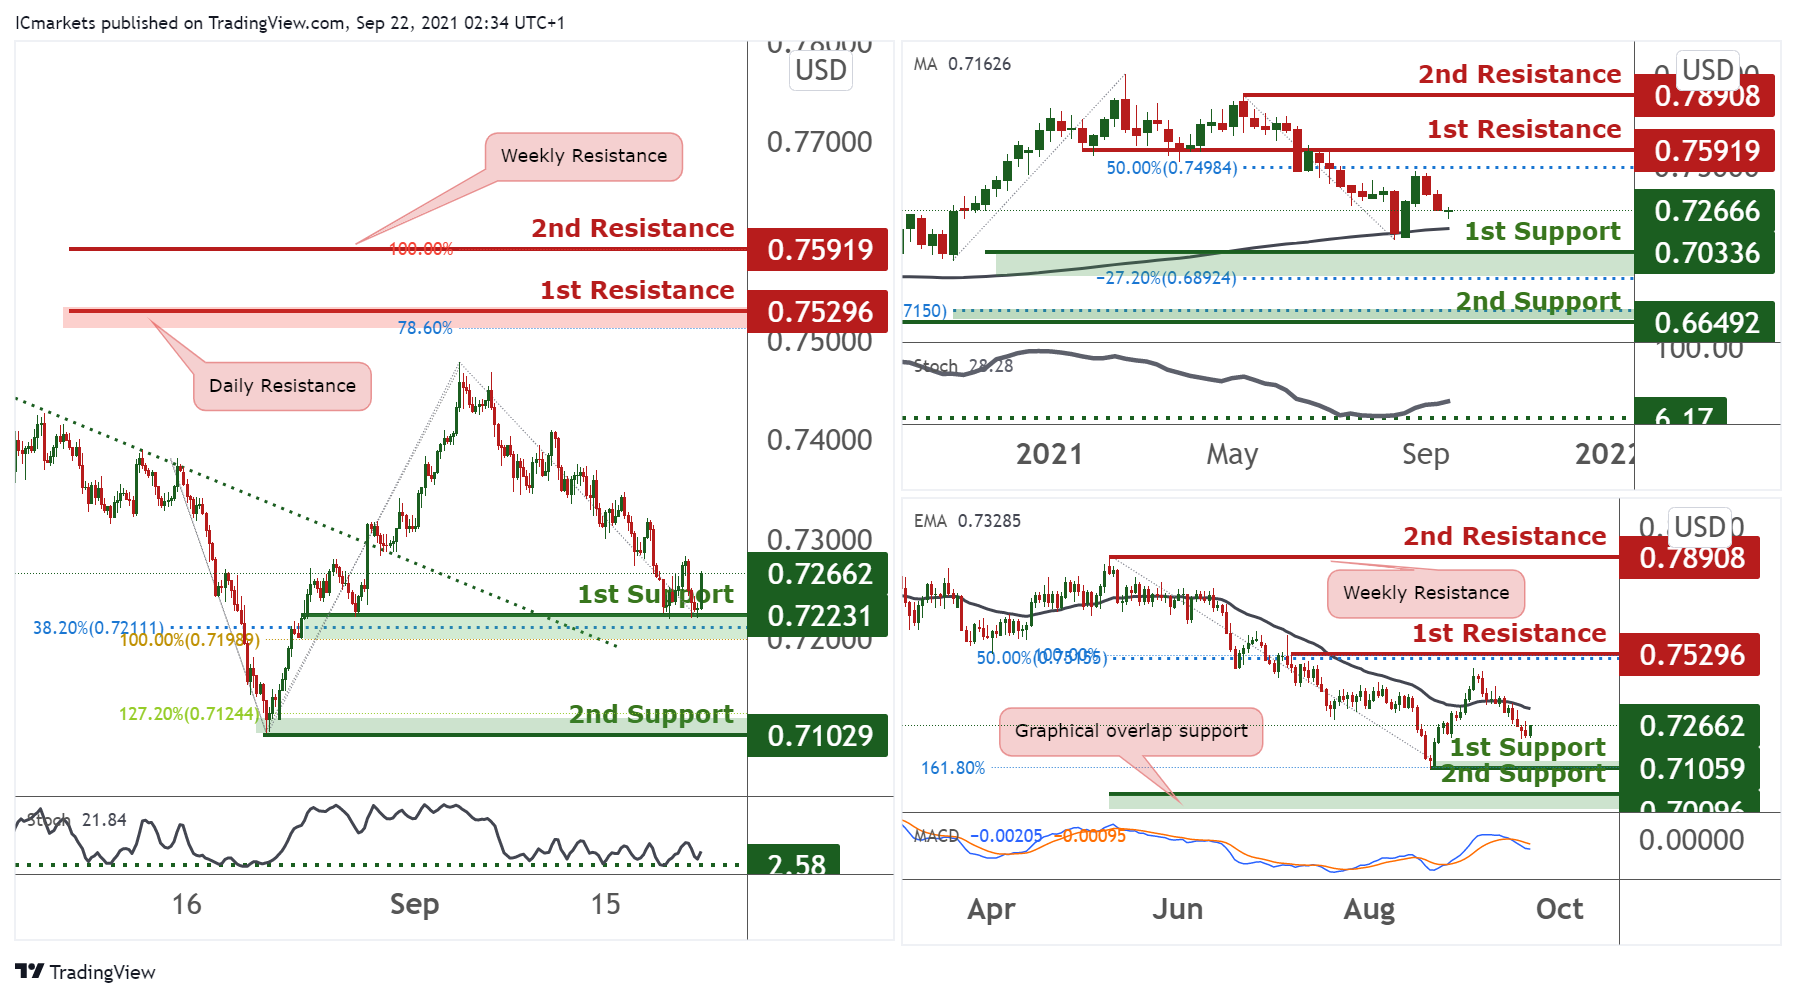
On the weekly, price is holding above the MA 100 showing bullish momentum, price is expected to push towards the first resistance in line with the 50% Fibonacci retracement level. Our bullish bias is further supported by the Stochastic indicator, where the K% line bounced off the support level. On the Daily, the price is holding below EMA 34 showing a potential bearish momentum, price bounced off from the first support in line with the 161.8% Fibonacci projection and now looking for a pull back, back to the support level. Our bearish bias is further supported by the MACD indicator where the signal line crosses above the MACD line.
On the H4, price is seen to have broken off the descending trendline resistance turned support. Price has bounced off the first support we are expecting price to be bullish and hence, push to the 1st Resistance level in line with 78.6% Fibonacci projection. Our short term bullish bias is further supported by the stochastic indicator %K line where it bounces off the support.
Areas of consideration:
- H4 1st resistance level 0.75296
- H4 1st support level 0.72231
NZD/USD:
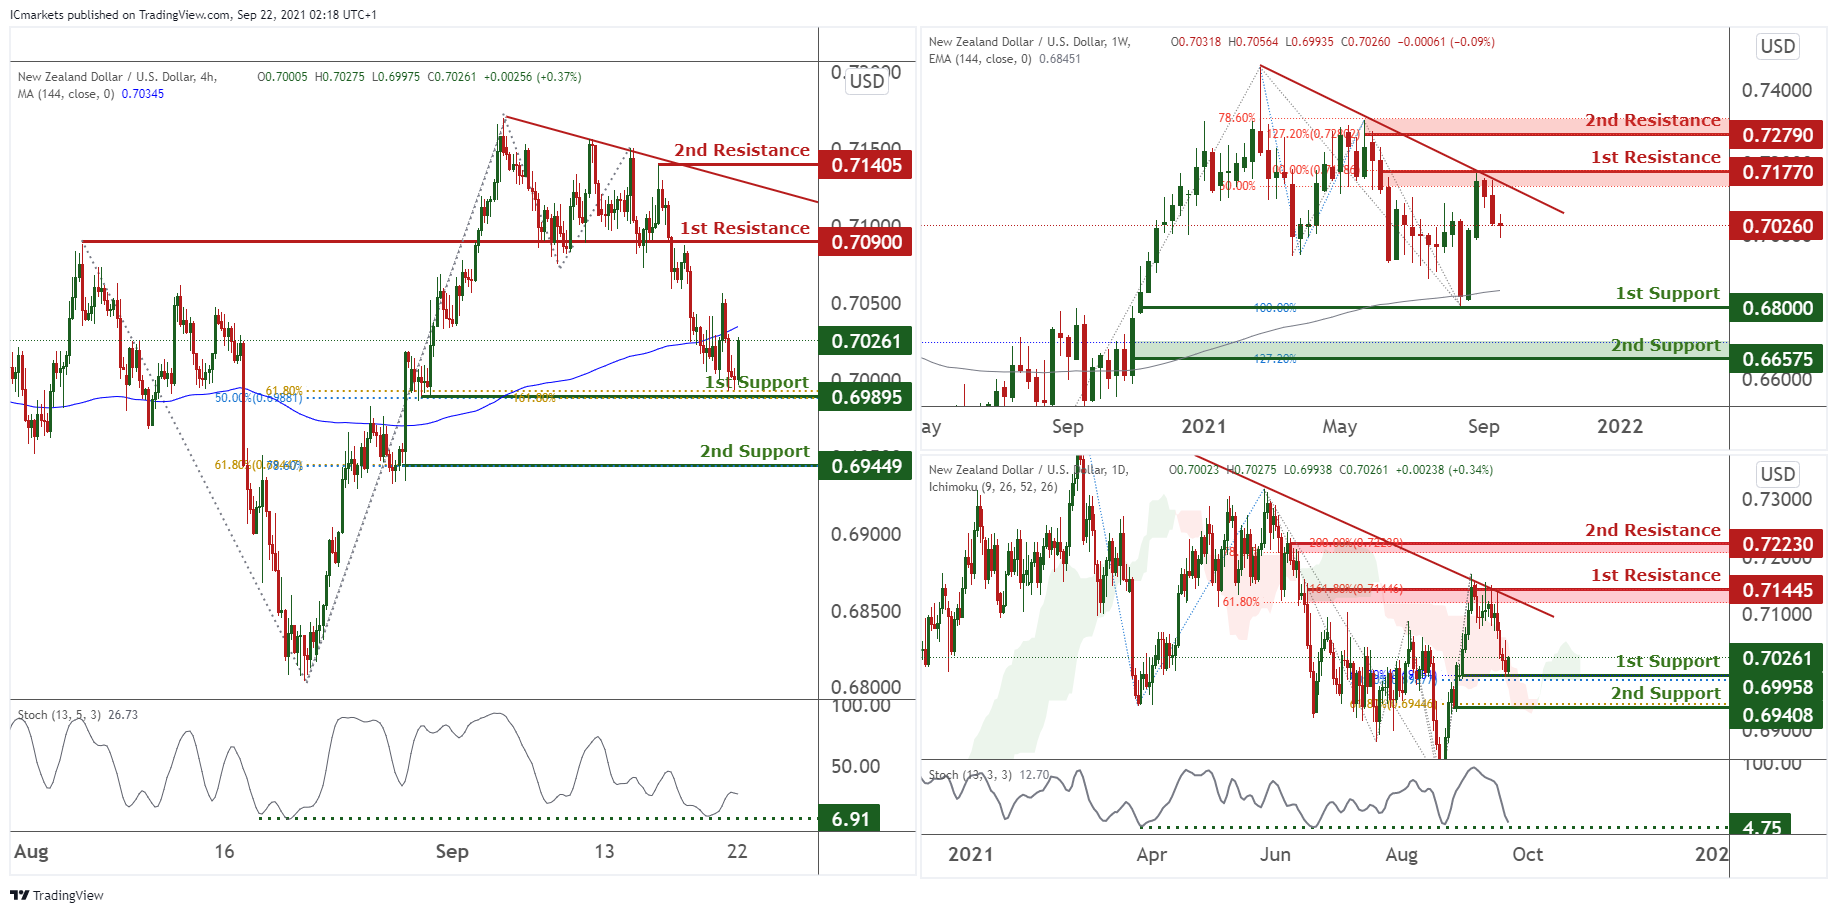
On the weekly, price has recently bounced off 1st resistance at 0.71770, in-line with 50% Fibonacci retracement, 100% Fibonacci extension, and descending trendline and is dipping towards the 1st support at 0.68000. Swing traders may potentially enter with shorts as we see potentially a bearish momentum in line with the descending trendline. Price is also holding above EMA 144 supporting our bearish view.
On the Daily chart, price has recently dipped to touch our 1st support at 0.69958 in line with 61.8% Fibonacci extension and 50% Fibonacci retracement. We foresee a potential bounce from the 1st support towards our bearish trendline. Stochastics are depicting an oversold situation. Ichimoku clouds are also forecasting trend reversal.
On the H4 timeframe, price is on a descending trend. Price is now dipping towards our 1st support at 0.69895 in line with 50% Fibonacci retracement, 61.8% and 161.8% Fibonacci extension. We see a possibility of price rebounce towards our resistance at 0.70900 which is a graphical swing high and in line with our bearish trendline. Stochastics are showing an oversold situation, forecasting potential short term trend reversal. Alternatively, if prices breaks our 1st support, it can potentially dip towards our 2nd support at 61.8% Fibonacci retracement and 78.6% Fibonacci Projection.
Areas of consideration:
- H4 time frame, 1st resistance at 70900
- H4 time frame, 1st support at 0.69895
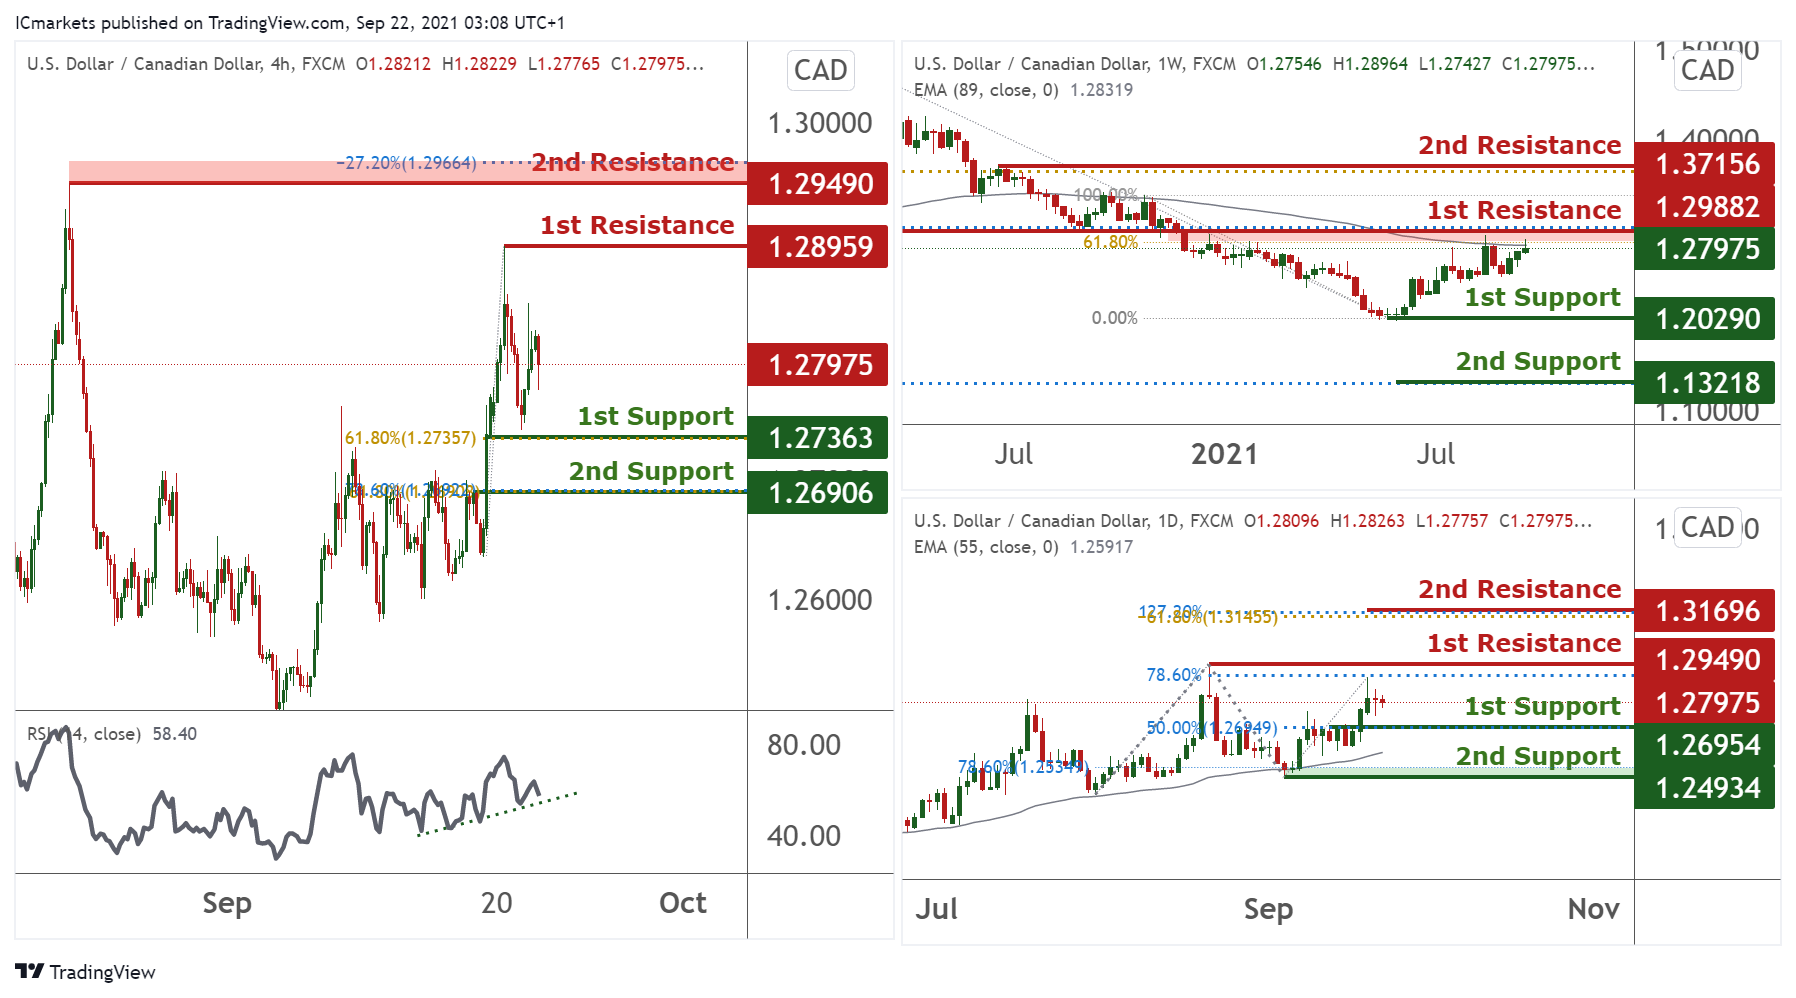
USD/CAD:
On the Weekly timeframe, price tested and reacted below long term moving average and also both 38.2% and 61.8% Fibonacci retracement level at 1.29882. As long as the price is holding below this level, we could potentially see the price facing further bearish pressure in the long term. On the Daily, price bounced higher and is now testing 1st resistance at 1.27620. With price holding above moving average, we a possibility of renewed bullish pressure should price break higher than 1st resistance. Otherwise, price may push lower towards 1st support at 1.24934
On the H4, price bounced off the 1st Support 1.27363, signifying a possible short-term bullish momentum. With RSI abiding the ascending trendline, price looks to continue to face further bullish pressure and buyers may look towards a possible upside target at 1st resistance of 1.28959. Otherwise, breaking below 1st support will see price dropping lower towards 2nd support at 1.26906.
Areas of consideration:
- H4 time frame, support at 1.27363
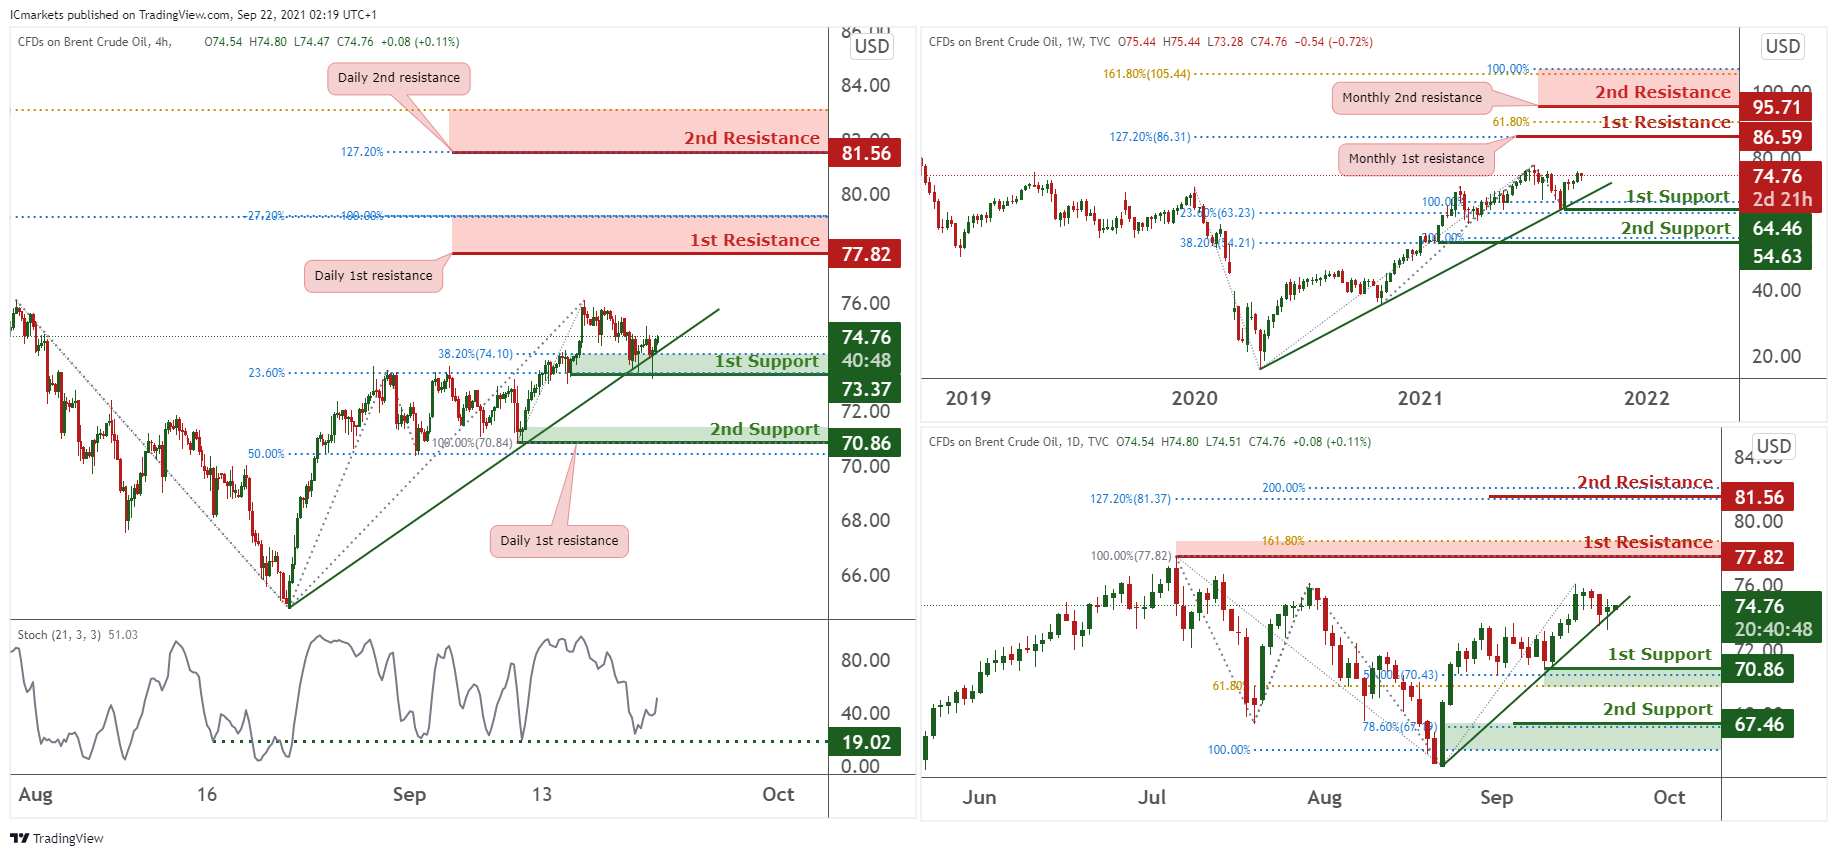
OIL:
On Weekly timeframe, we can see price is above the ascending trendline support and may bullish to 1st resistance at 86.59 in line with 127.2% Fibonacci retracement and 61.8% Fibonacci extension. However, if price breaks below the ascending trendline line support, price may brearish towards the 1st support at 64.46 in line with 23.6% fibonacci retracement and 100% fibonacci extension.
On the Daily timeframe, price is testing the ascending trendline support and above 1st support at 70.86 in line with 50% Fibonacci retracement and 61.8% fibonacci extension. Price may bullish towards 1st resistance at 77.82 in line with horizontal swing high and 161.8% fibonacci extension. Otherwise price may bearish towards the 1st support at 70.86 in line with 50% Fibonacci retracement and 61.86% fibonacci extension.
Lastly, on the H4 timeframe, price is testing ascending trendline support and above 1st support at 73.37 in line 38.2% fibonacci retracement and 23.6% Fibonacci extension and may potentially bullish towards the 1st resistance at 77.82 in line with 127.2% Fibonacci retracement and 100% Fibonacci extension. Our bullish view is further supported by how stochastic testing support where price bounced in the past. Otherwise price may bearish towards the 1st support at 73.37 in line with 38.2% Fibonacci retracement and 23.6% Fibonacci extension.
Areas of consideration:
- H4 time frame, 1st resistance of 77.82
- H4 time frame, 1st support of 73.37
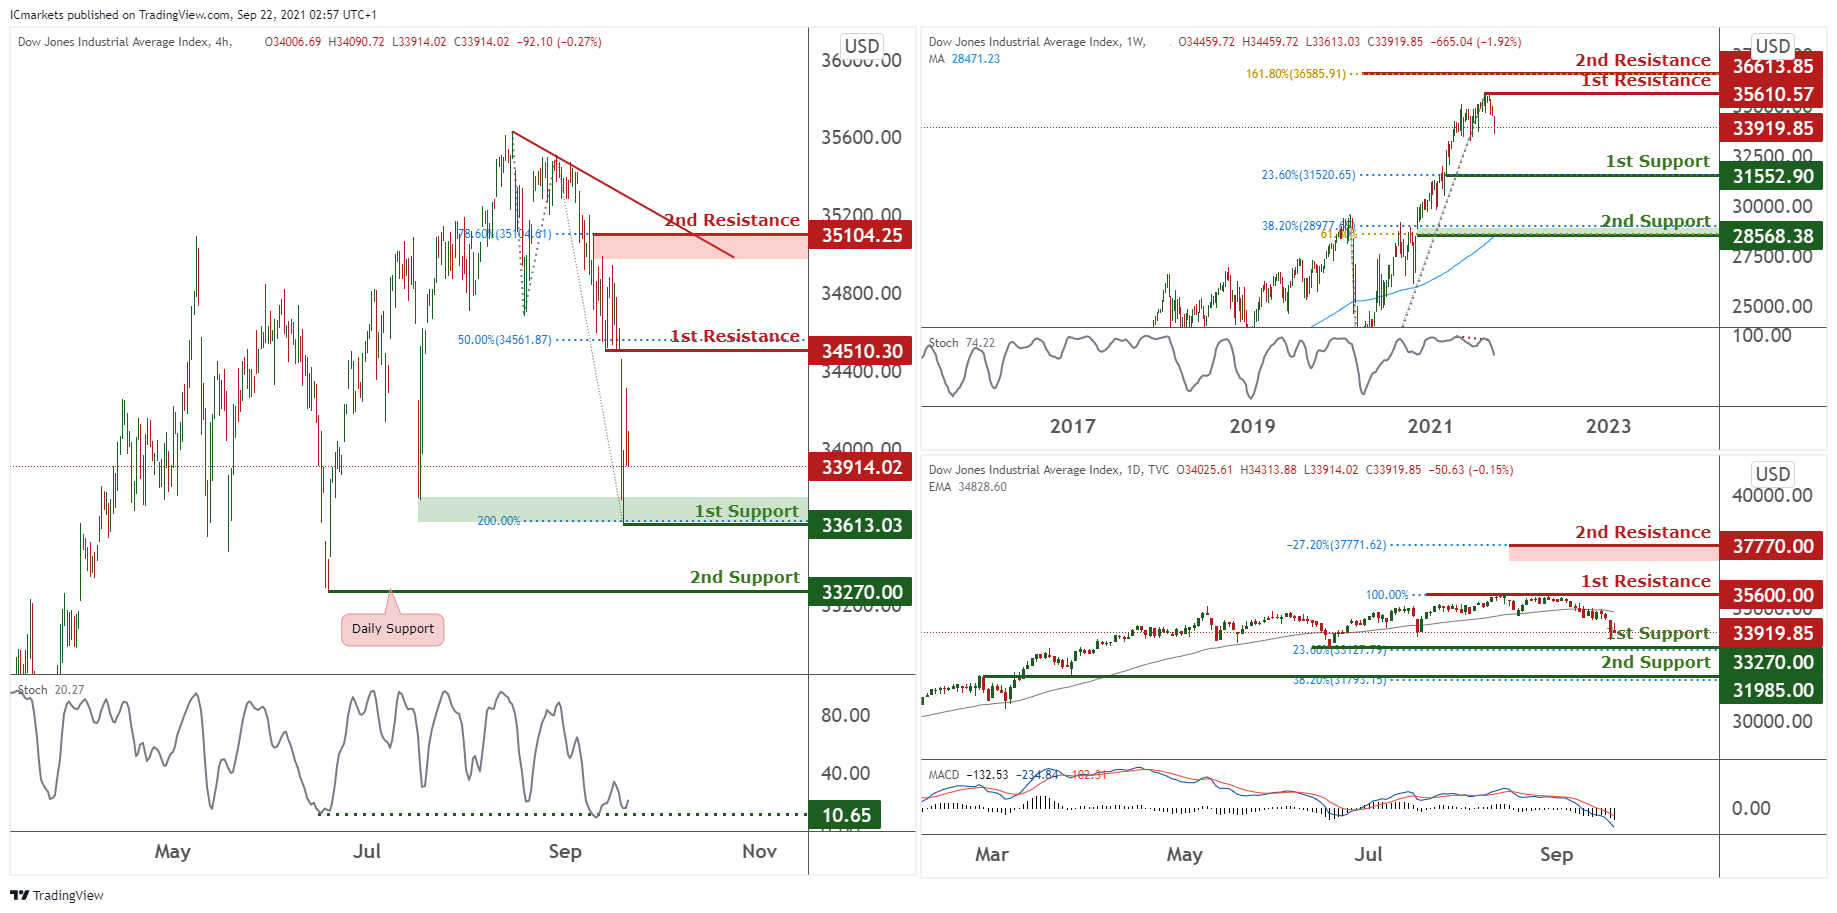
Dow Jones Industrial Average:
On the Weekly, price has recently bounced off our 1st resistance at 35610.57 which is a graphical swing high and is on a bearish momentum. We forecast a potential trend reversal towards our 1st support at 31552.9 in line with 23.6% Fibonacci retracement. Divergence detected in stochastics depicting lower highs, signalling trend reversal. Alternatively, if prices break 1st resistance, the trend reversal could occur at 2nd resistance at 36613.85 in line with 161.8% Fibonacci extension. Our moving average is also forecasting the change in direction.
On the Daily chart, price drifted lower below 1st resistance at 35600. With technical indicators showing room for further bearish momentum, it is possible to see some selling pressure push price lower towards 1st support at 33270. Otherwise, breaking above 1st resistance will see the price swing higher towards 2nd resistance at 37770.
On the H4, price dropped lower breaking previous supports. With price now testing key graphical swing low support at 33613 and stochastic testing support where price bounced in the past, an intraday bounce towards graphical overlap resistance at 34510 could be possible. Otherwise, breaking below 1st support will see price drop lower towards daily support at 33270.
Areas of consideration:
- Daily support at 33270
- 4h resistance at 34510.3
The accuracy, completeness and timeliness of the information contained on this site cannot be guaranteed. IC Markets does not warranty, guarantee or make any representations, or assume any liability regarding financial results based on the use of the information in the site.
News, views, opinions, recommendations and other information obtained from sources outside of www.icmarkets.com.au, used in this site are believed to be reliable, but we cannot guarantee their accuracy or completeness. All such information is subject to change at any time without notice. IC Markets assumes no responsibility for the content of any linked site.
The fact that such links may exist does not indicate approval or endorsement of any material contained on any linked site. IC Markets is not liable for any harm caused by the transmission, through accessing the services or information on this site, of a computer virus, or other computer code or programming device that might be used to access, delete, damage, disable, disrupt or otherwise impede in any manner, the operation of the site or of any user’s software, hardware, data or property.


