
EUR/USD:
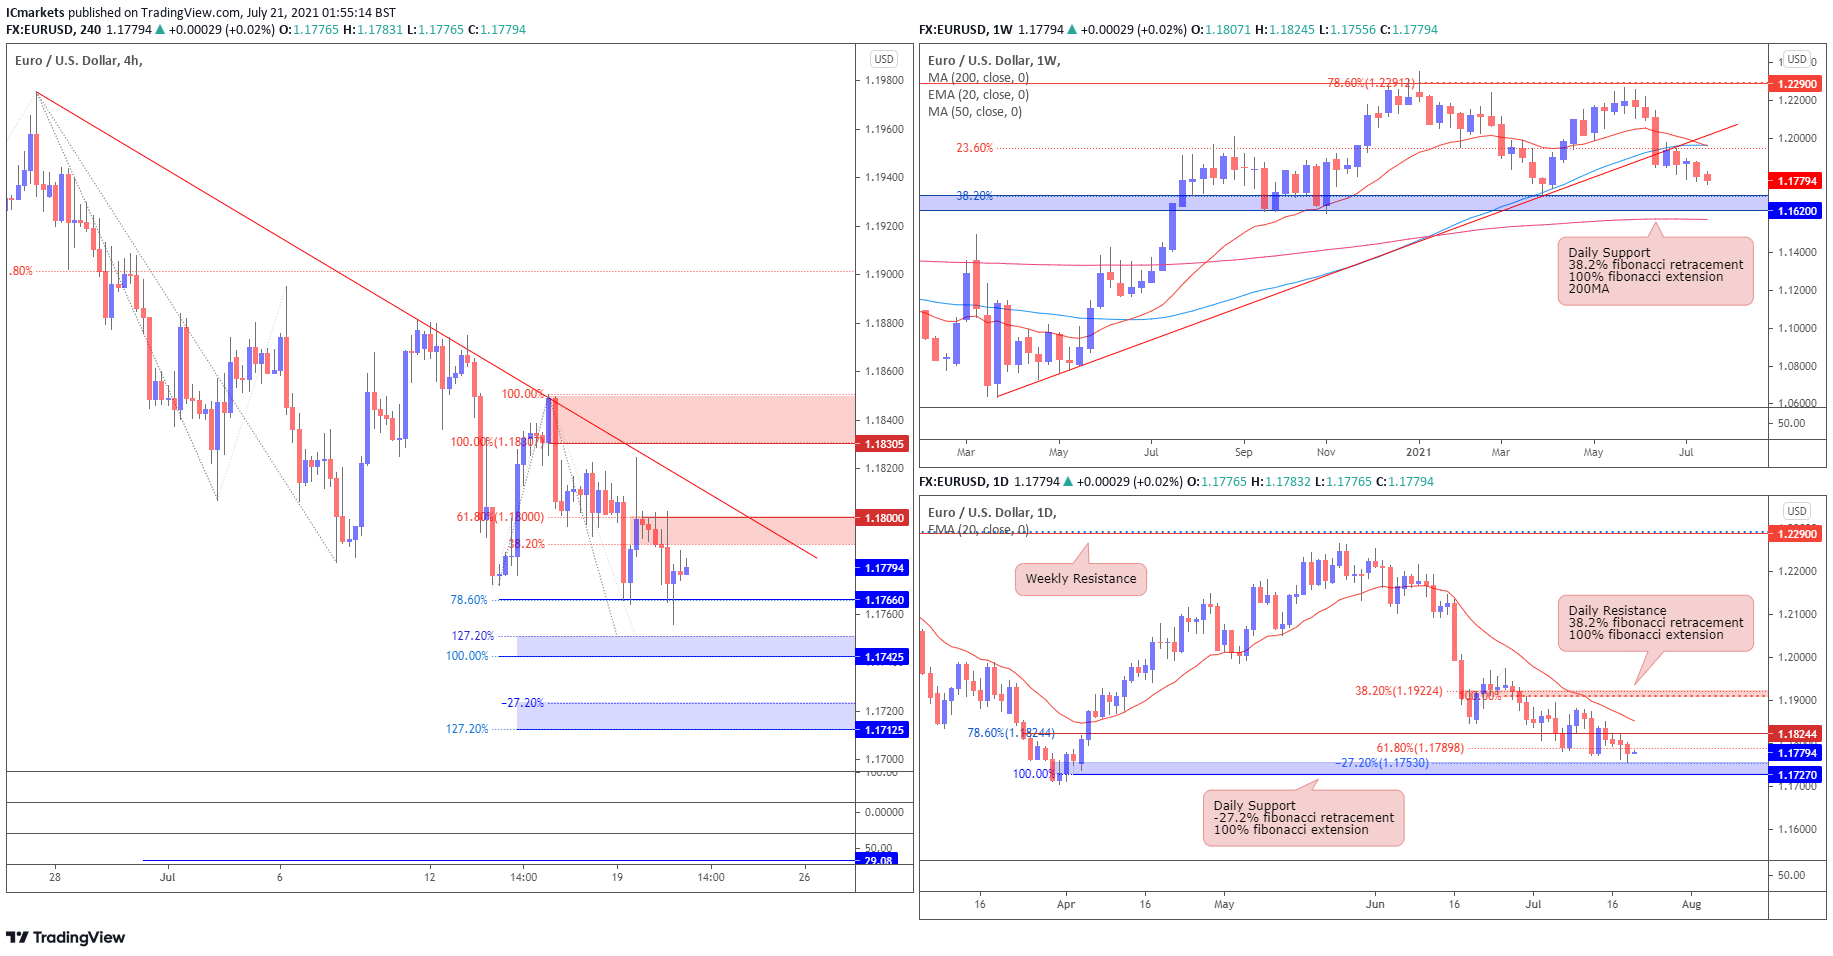
Looking at the weekly chart we can see that prices are facing bearish pressure below 20EMA and 50MA, where we are expecting the price to swing towards support at 1.16200, in-line with 38.2% Fibonacci retracement, 100% Fibonacci extension and 200MA . On the daily chart, prices are facing bearish pressure and we could potentially see it drop to 1.17270, in-line with -27.2% Fibonacci retracement and 100% Fibonacci extension.
On the H4 timeframe, price dropped to support level at 1.17660, in-line 78.6% Fibonacci extension. The price is at a major support level where we expect the price to swing towards first resistance at 1.18000, in-line with 38.2% Fibonacci retracement, 61.8% Fibonacci extension and descending trendline resistance. RSI is also coming into support where previous bounces occur. The next resistance is at 1.18305, in-line with 100% Fibonacci retracement and 100% Fibonacci extension.
If the price drops from this level, it would swing towards first support at 1.17425, in-line with 127.2% Fibonacci retracement and 100% Fibonacci extension. The next support will be at 1.17125, in-line with -27.2% Fibonacci retracement and 127.2% Fibonacci extension. Areas of consideration:
- H4 time frame, support level at 1.17425 and 1.17125
- H4 time frame, resistance level at 1.18000 and 1.18305
GBP/USD:
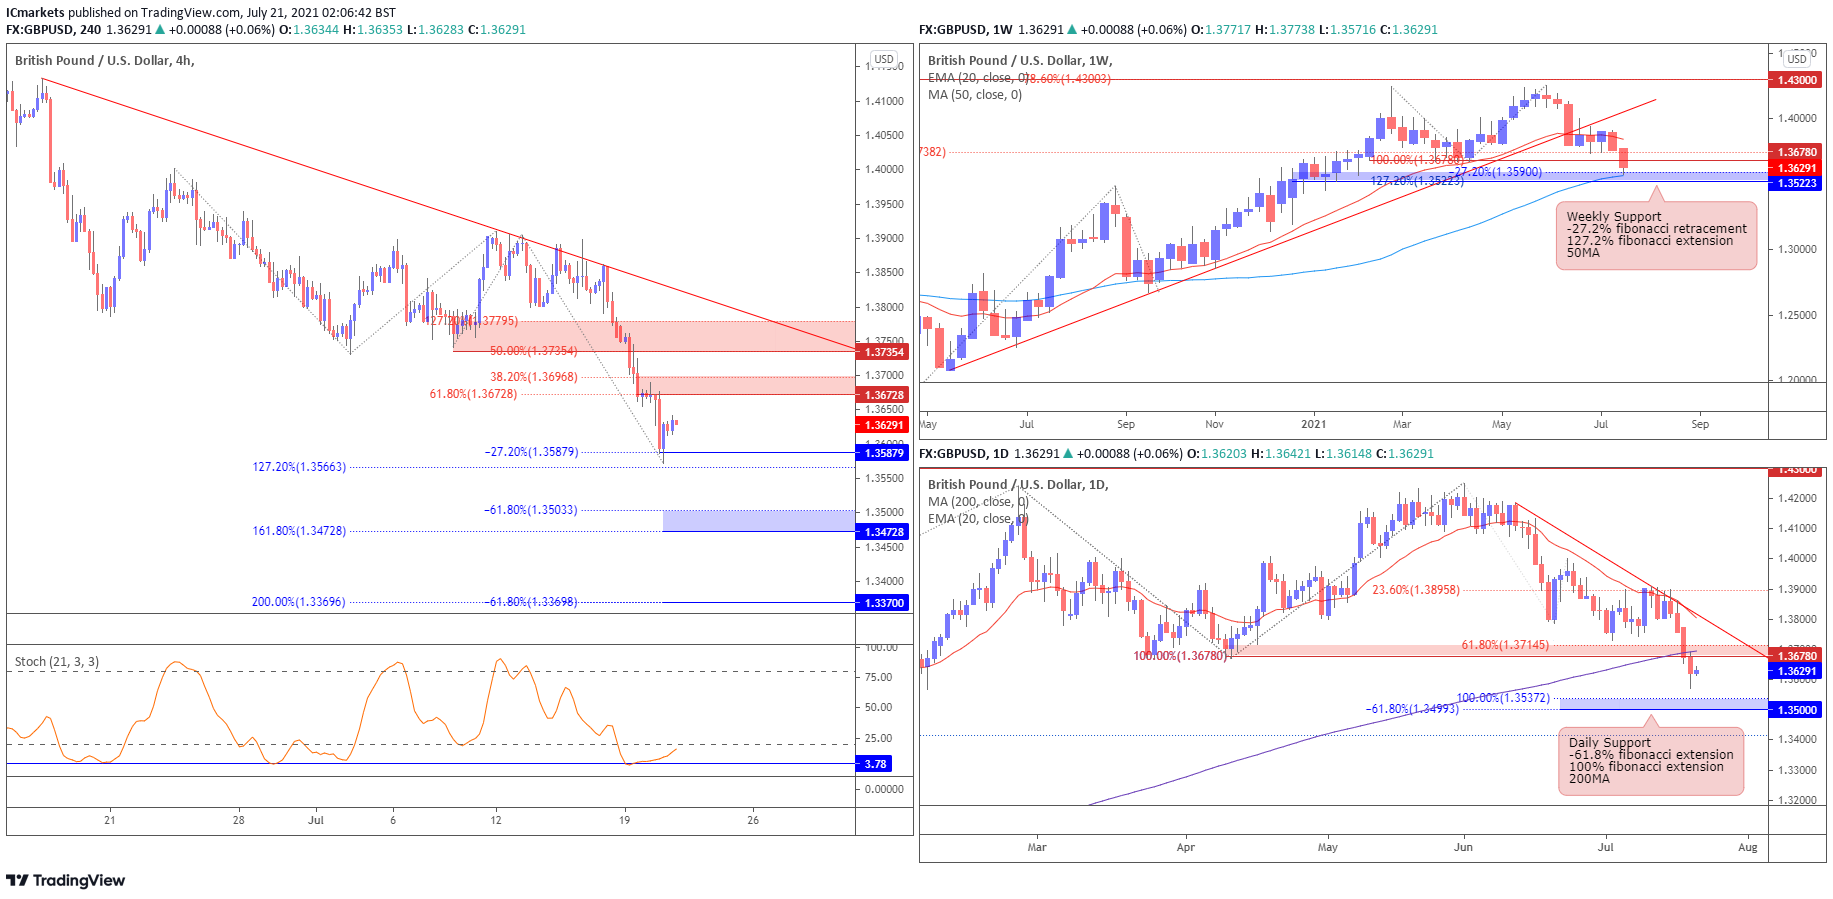
Looking at the weekly chart, prices broke previous support at 1.36780 and is now coming into major support at 1.35223, in-line with -27.2% Fibonacci retracement, 127.2% Fibonacci extension and 50MA. On the daily time frame, prices faced bearish pressure and broke the major support level at 1.36780, in-line with 61.8% and 100% Fibonacci extension and 200MA, the price will face bearish pressure it bounces back to this level.
On the H4 timeframe, prices dropped and found support at 1.35879, in-line with -27.2% Fibonacci retracement and 127.2% Fibonacci extension. The price is now at major support where we expect the price to bounce towards our first resistance at 1.36728, in-line with 38.2% Fibonacci retracement and 61.8% Fibonacci extension. Stochastic is also at the support level where previous bounces occur. The next resistance will be at 1.37354, in-line with 50% Fibonacci retracement and 127.2% Fibonacci extension.
If price drops from this level, it will swing towards first support at 1.34728, in-line with -61.8% Fibonacci retracement and 161.8% Fibonacci extension. The next support level will be at 1.33700, in-line with -61.8% Fibonacci retracement and 200% Fibonacci extension.
Areas of consideration:
- H4 time frame, 34728 and 1.33700 support level
- H4 time frame, 1.36728 and 1.37354 resistance level
AUD/USD:
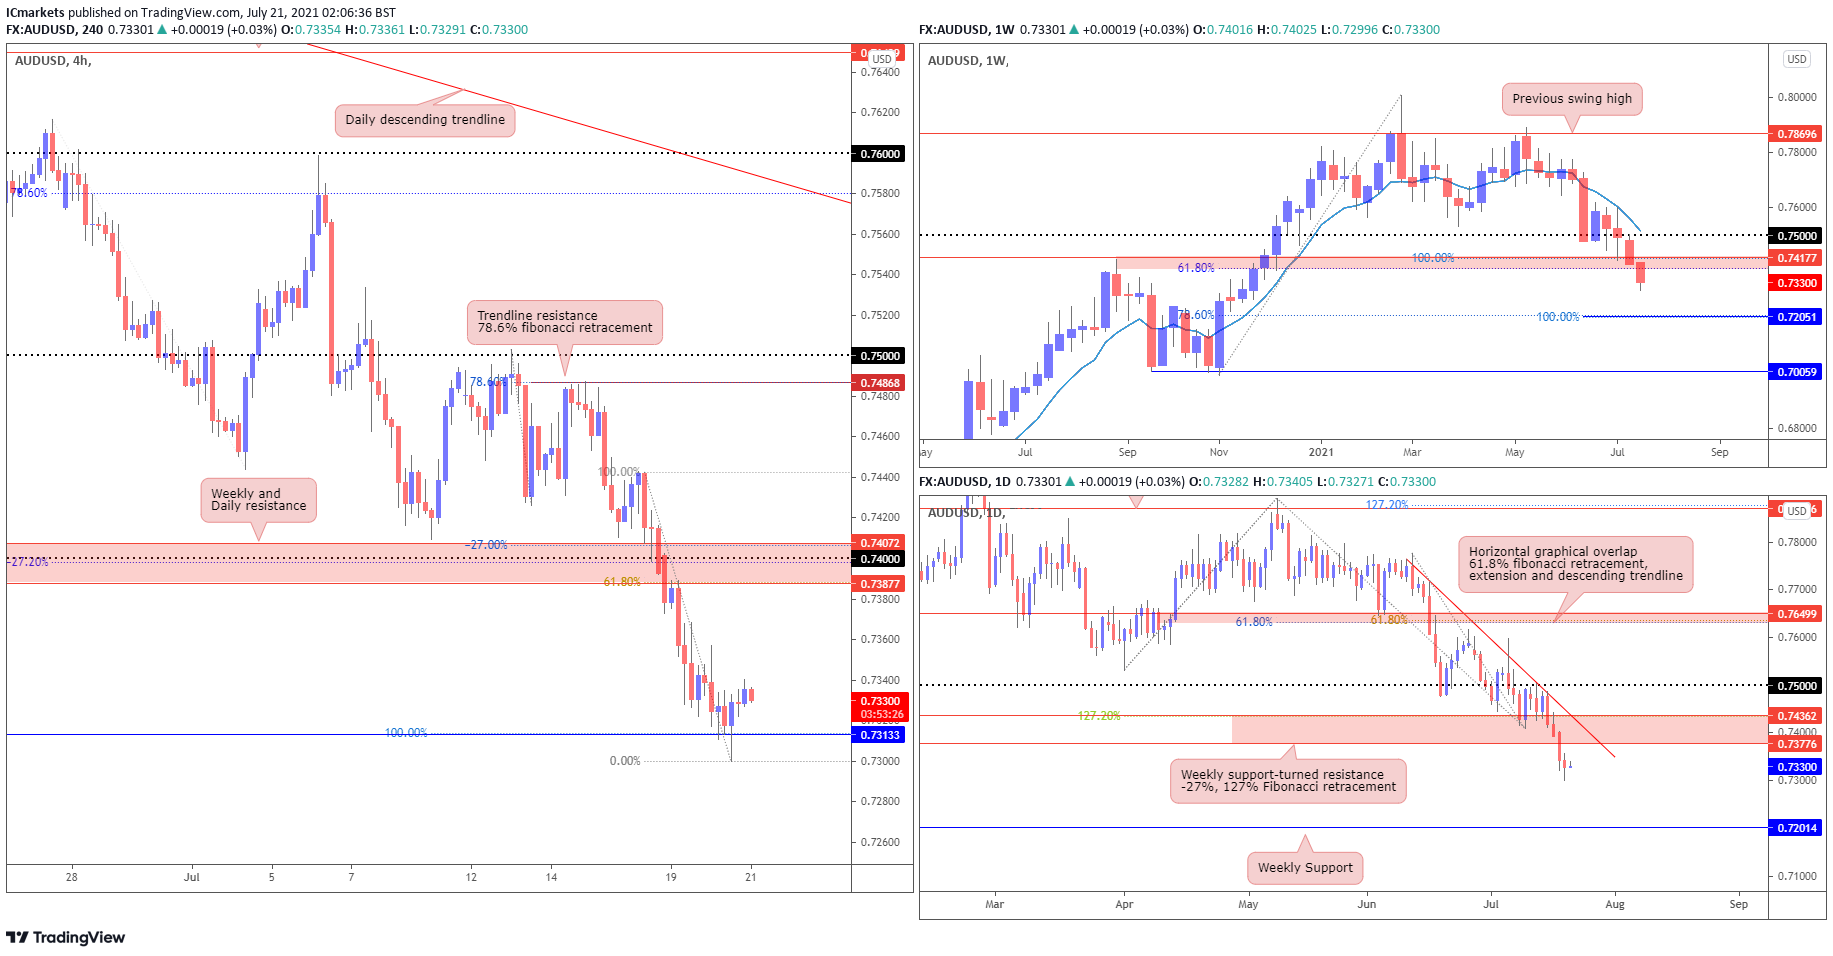
Looking at the weekly chart, we can see that the price broke beneath the support level of 0.74177, in line with 61.8% fibonacci retracement and 100% fibonacci extension. We may see a push down towards 0.72051, in line with 100% fibonacci extension and 78.6% fibonacci retracement. On the daily time frame, we are seeing a similar picture where price may continue pushing further lower.
Lastly, on the H4 timeframe, we are seeing a reversal from the 100% fibonacci extension support level, where price may return towards the Weekly and Daily resistance for a retest, which is also in line with 61.8% fibonacci retracement at 0.73877, before pushing lower.
Areas of consideration:
- H4 time frame, price is showing reversal towards 0.73877
- Weekly and Daily time frame showing bearish momentum
USD/JPY
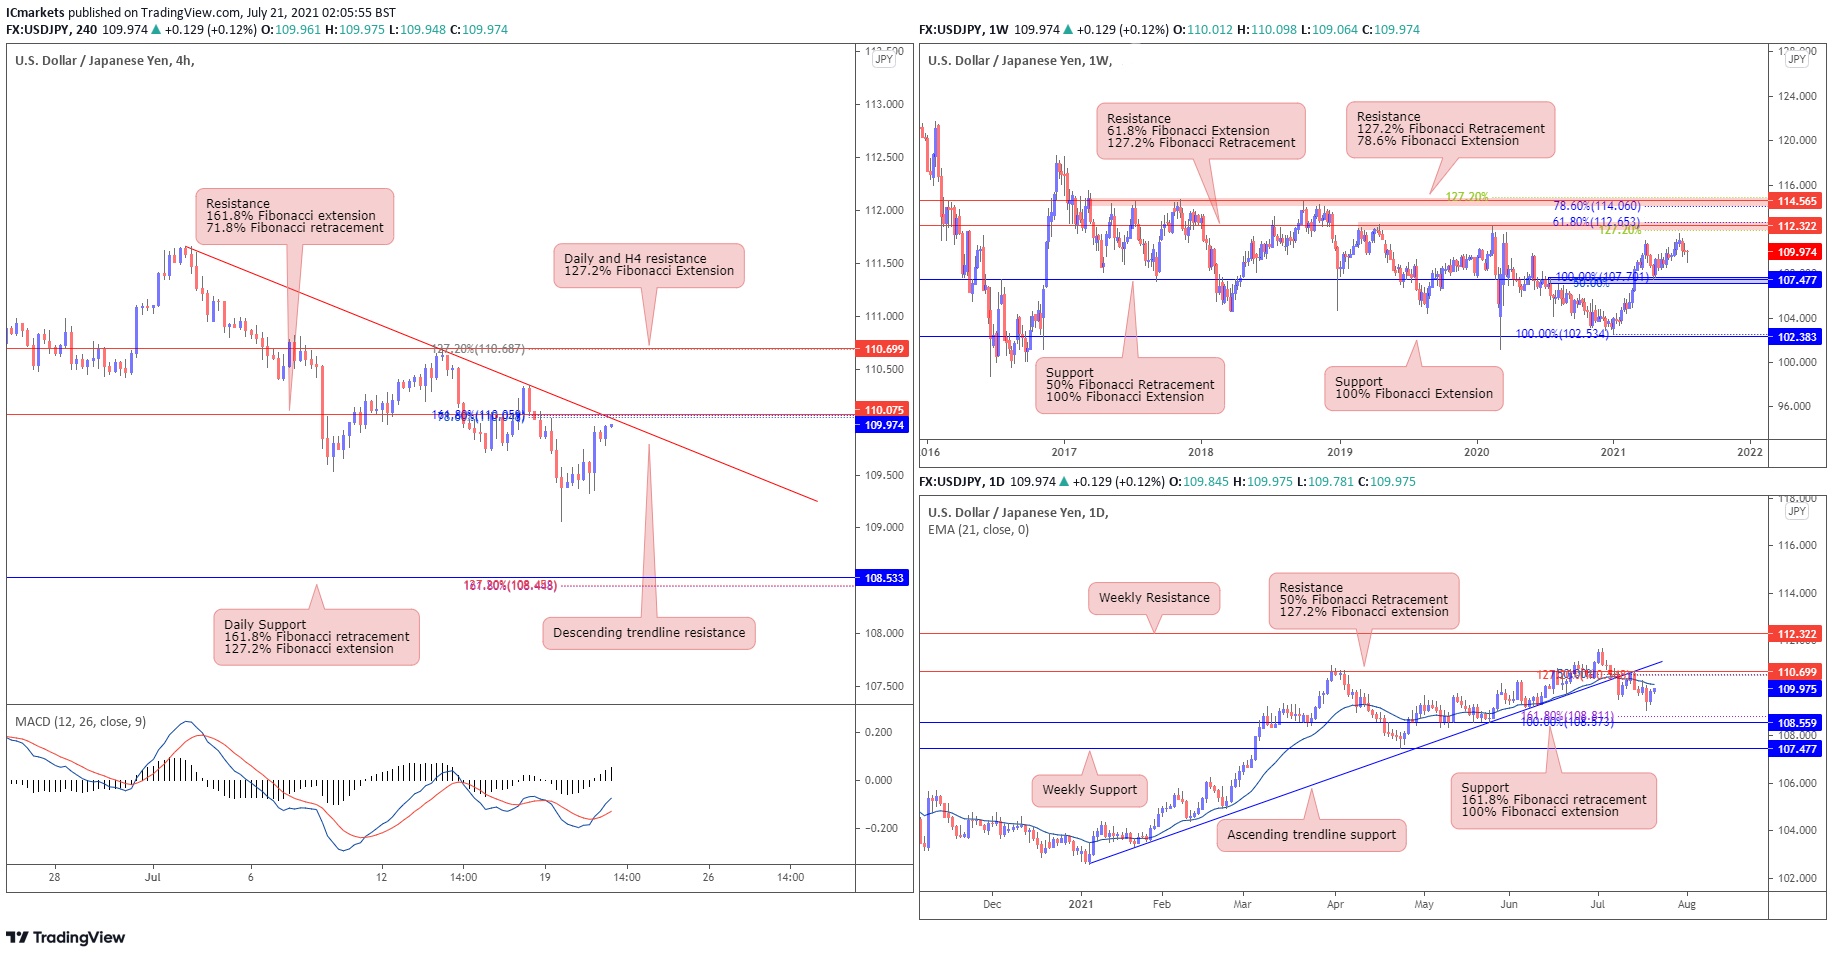
From the weekly timeframe, prices are pushing down towards the horizontal swing low support of 107.477, in line with 50% Fibonacci Retracement and 100% Fibonacci Extension, where we might see a bounce from this level. In the case that price pushes up, prices may face resistance at horizontal swing high resistance of 112.322, in line with 61.8% Fibonacci extension and 127.2% Fibonacci retracement. On the daily timeframe, prices have broken the ascending trendline support, and resisted the 110.699 level, which is in line with 50% Fibonacci retracement and 127.2% Fibonacci extension. Prices might push down towards 108.559, in line with 161.8% Fibonacci retracement and 100% Fibonacci extension. A break above the 110.699 level may see prices push up towards the112.322 level.
On the H4 timeframe, prices are forming lower highs and are looking to reverse off the horizontal swing high resistance of 110.075, in line with 161.8% Fibonacci extension and 71.8% Fibonacci retracement. Prices are expected to take support at the horizontal swing low support of 108.533, in line with the 161.8% Fibonacci retracement and 127.2% Fibonacci extension. If prices push up, prices may face resistance from 110.699 daily resistance, in line with 127.2% Fibonacci extension. Moreover, the signal line of MACD is below 0.
Areas of consideration:
- 075 resistance level on the H4 and daily timeframe
- 533 support level on the H4 and daily timeframes
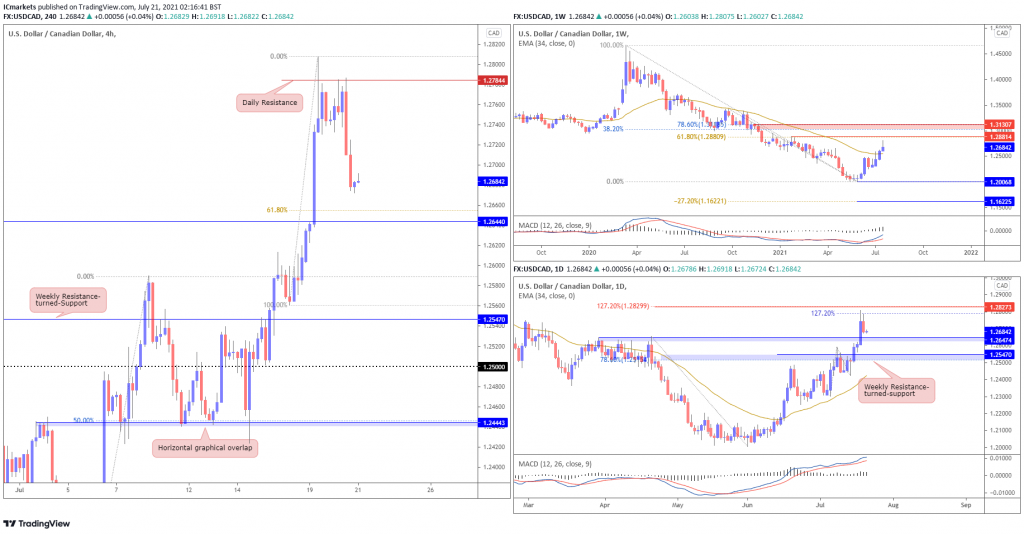
USD/CAD:
On the Weekly timeframe, price is currently trending above the moving average showing bullish momentum, however MACD is still holding under the 0-line. Price is currently holding between long term resistance at 1.28814 and long term support at 1.20068. On the Daily timeframe, we see that price showed a bearish reversal from the 127% fibonacci extension level near 1.28273 and is heading towards 1.26474 support level. Lastly on the H4 timeframe, we are seeing a short-term bearish movement towards the 1.26440 level in line with 61.8% fibonacci retracement, from here we can look for signs of bullish momentum.
Areas of consideration:
- H4 shows short-term bearish pullback towards 1.26440.
- Weekly and Daily time frame shows bullish momentum
USD/CHF:
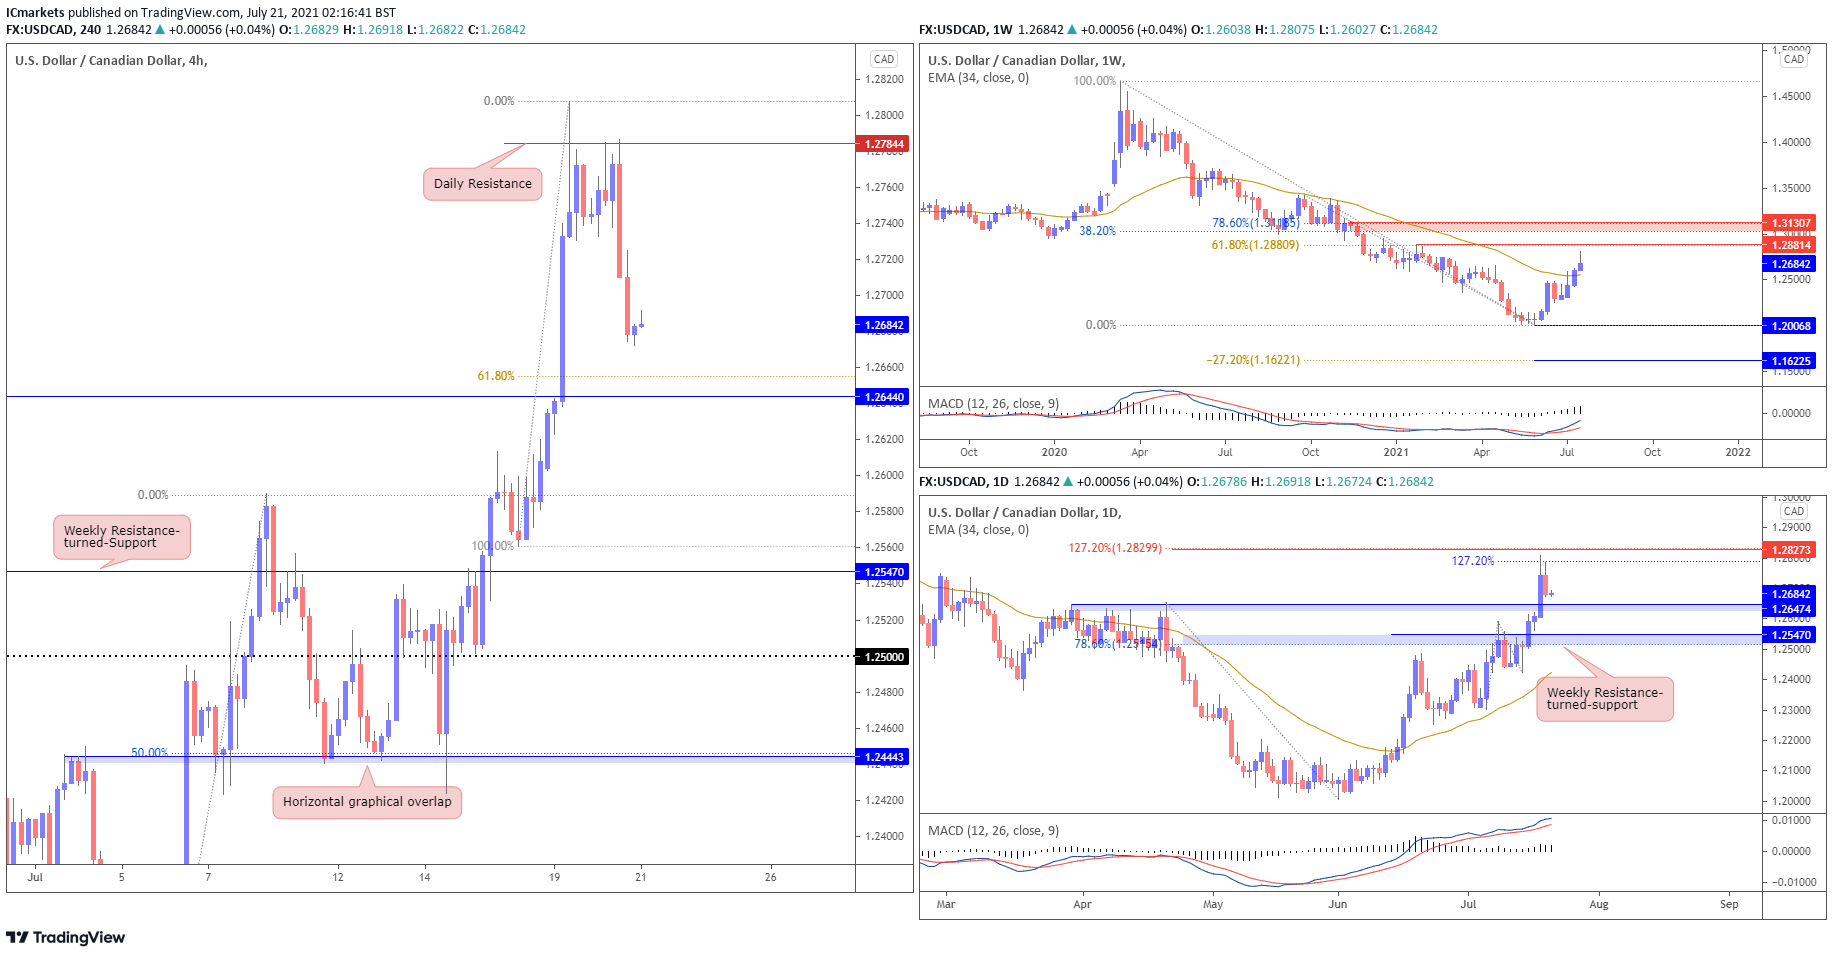
USD/CHF has shown a strong bounce from the weekly 0.89146 support, in line with 78.6% Fibonacci retracement, and price is now holding below the descending trendline resistance. The daily chart shows that price is now reversing below the key daily resistance of 0.92735. We could potentially see further downside towards the 0.90462 support.
On the H4 chart, we can see that price is now testing the 1st resistance level at 0.92017 resistance and it could potentially push up to the second resistance level at 0.92735 following a successful breakthrough. The second resistance is in line with 127.2% Fibonacci extension level. Alternatively, price can also resist off its current level and take support at 0.91176 which is in line with 161.8% Fibonacci extension, 127.2% Fibonacci extension and graphical swing low. We note that price is holding above the EMA which serves to further strengthen our bullish bias.
Areas of consideration:
- Price could potentially reverse at our current price level
- We could see price drop further towards the next 0.91176 support level.
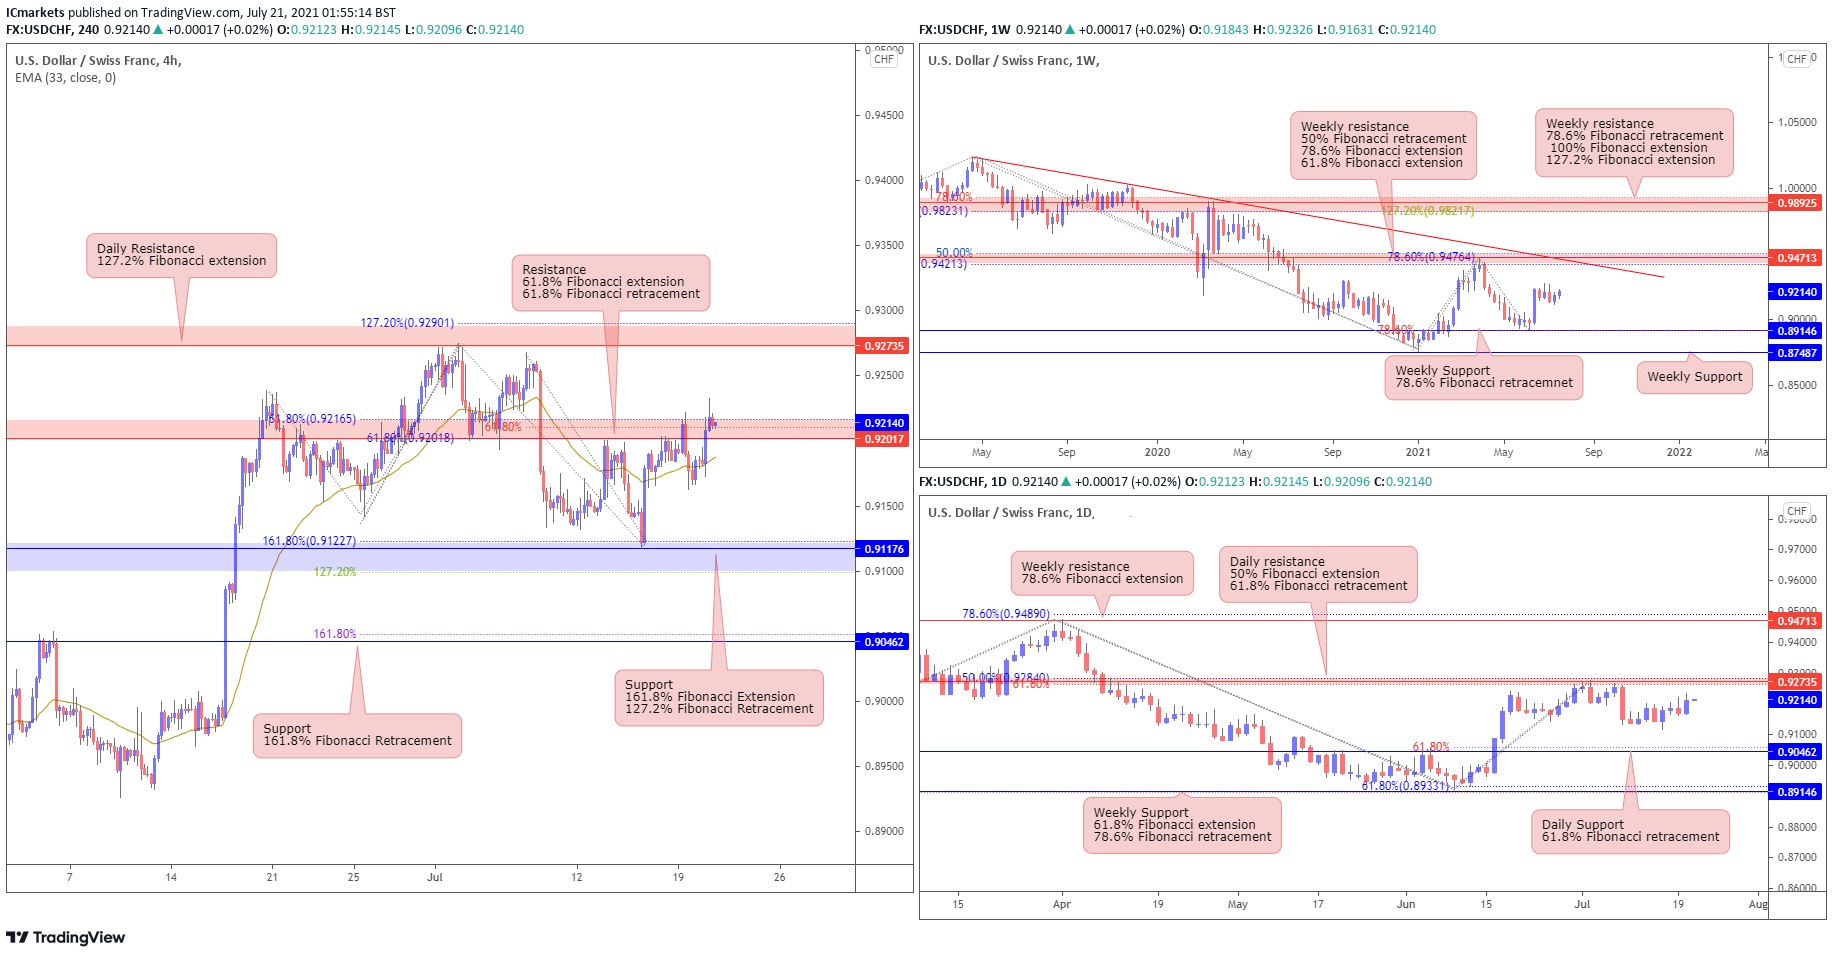
Dow Jones Industrial Average:
On the weekly chart, price is trading sideways holding between 32765 support and 37525 resistance. With price holding above long term moving average, we see price facing further bullish pressure. On the daily chart, price is currently trading sideways and holding below resistance at 35090. With stochastic reacting below resistance where price dropped in the past, we see price facing possible bearish pressure.
On the H4, price is testing and holding below 34621 resistance. With price now below moving average, we see a low probability scenario where sellers might add to their shorts to push price lower towards 33741 support. Otherwise failure to hold below 34621 resistance should see price swing the other way towards 35090 resistance instead.
Areas of consideration:
- 35090 daily resistance is key level to watch
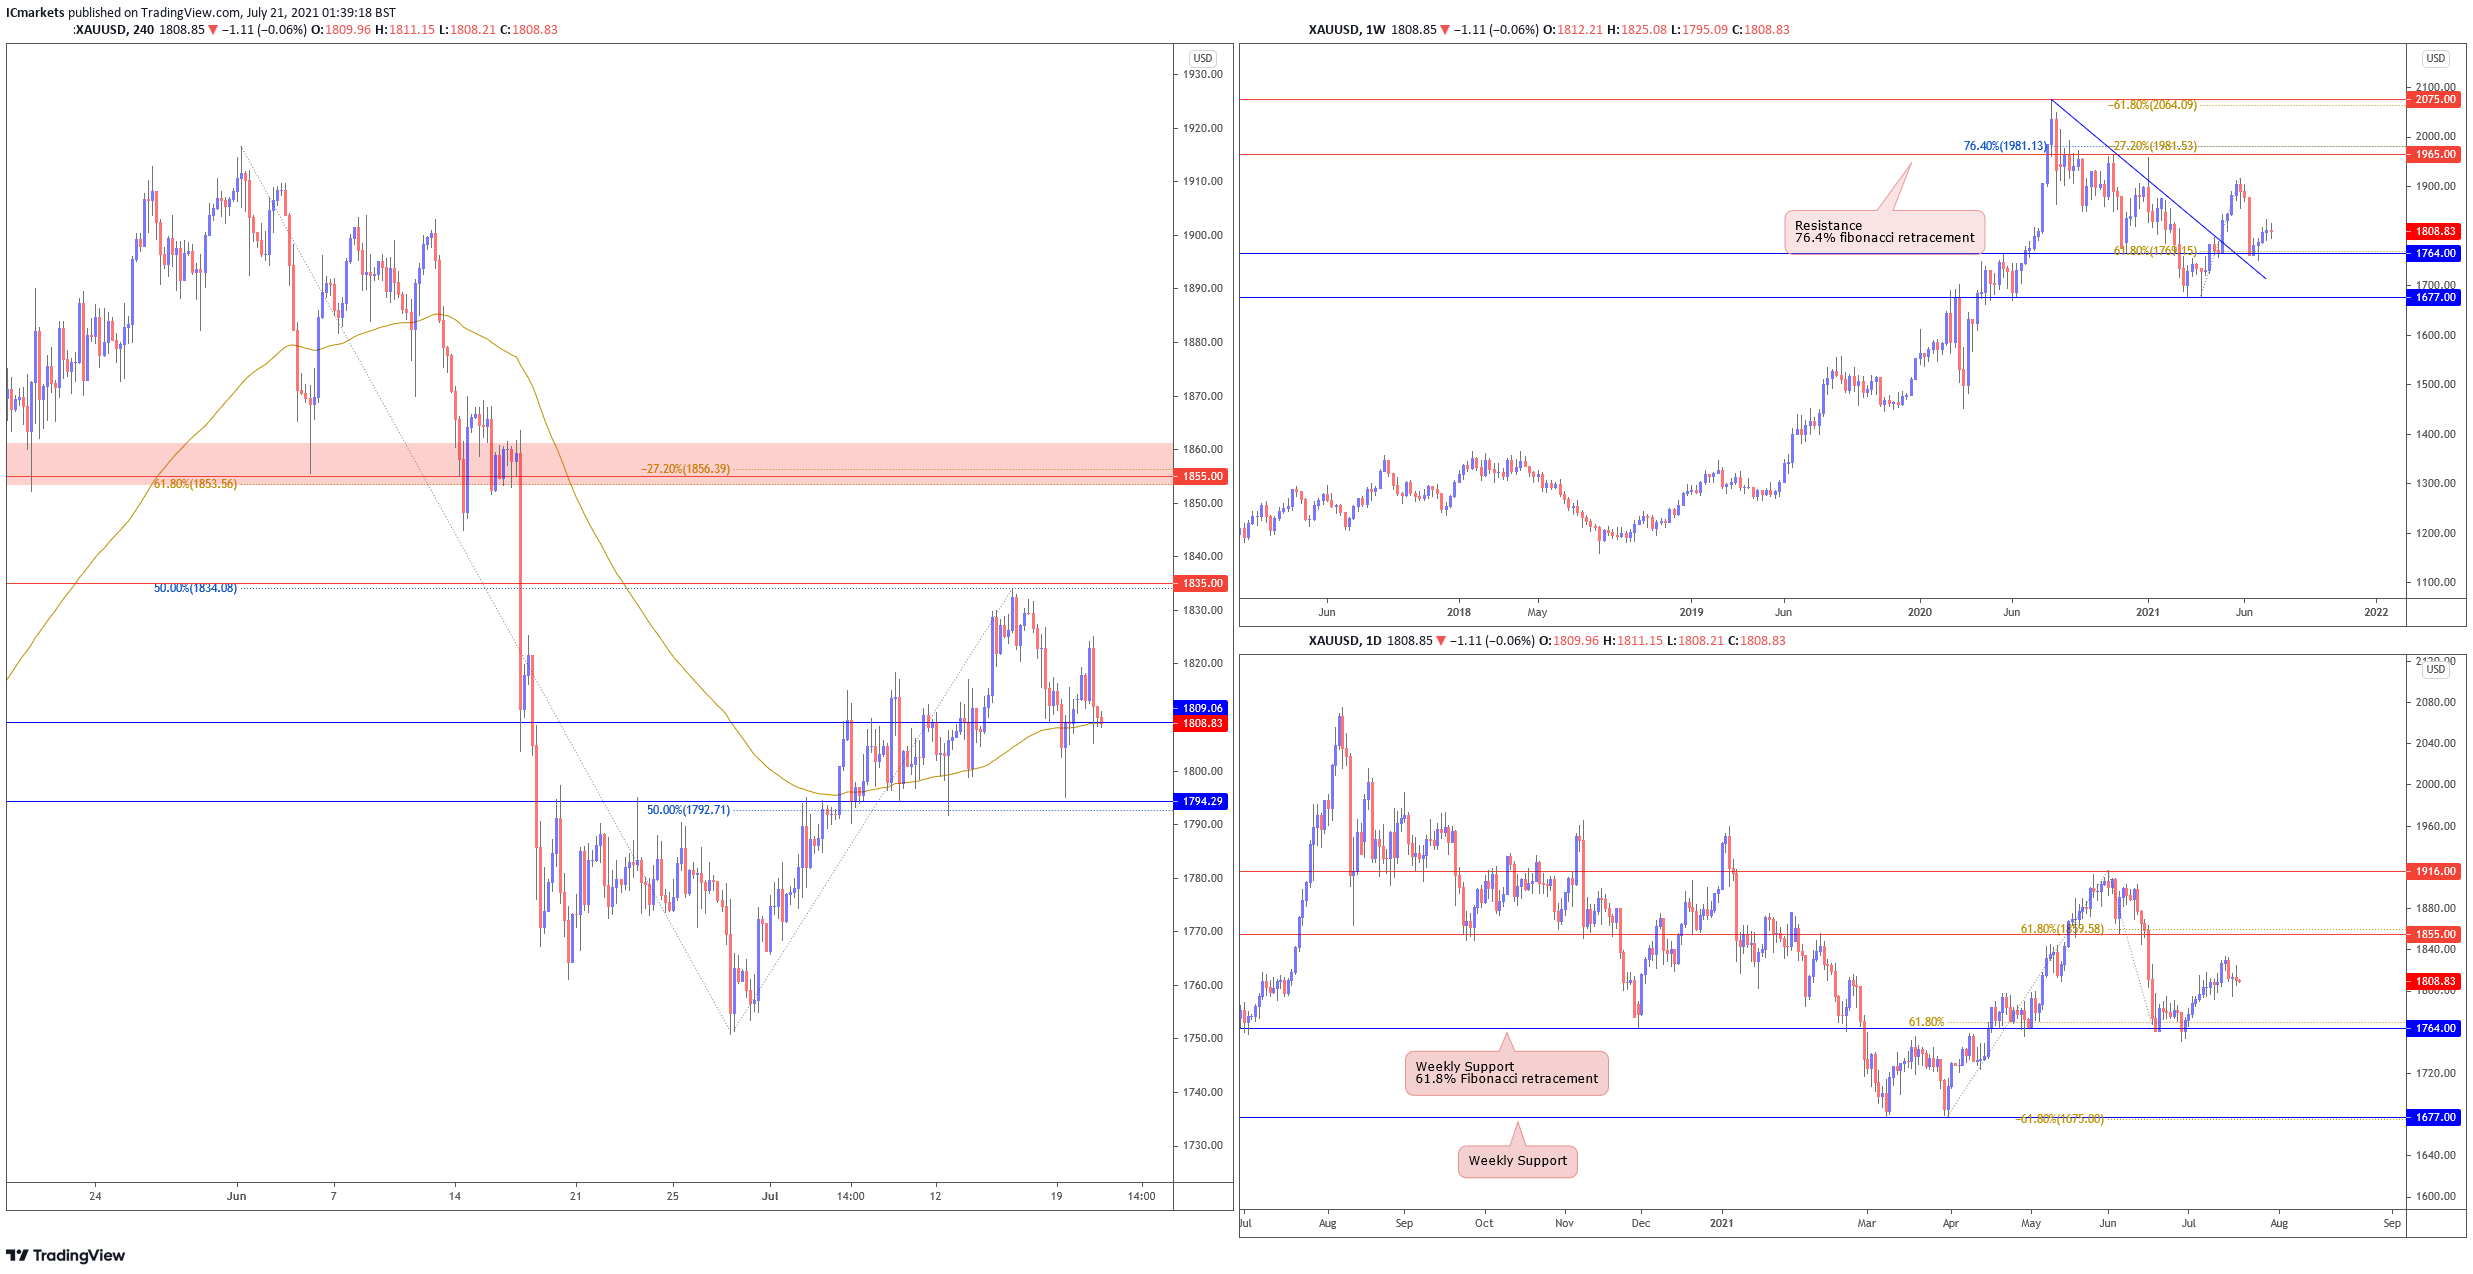
XAU/USD (GOLD):
On the weekly timeframe, price tested and bounced above key trendline pullback support at 1764. On the daily, price is now trading sideways, holding between 1855 resistance and 1764 weekly support. With no clear levels for entry that provides a good risk to reward ratio, we prefer to keep a neutral stance for now. Breaking above resistance at 1855 will see price push higher towards 1916 resistance. Otherwise, a break below 1764 support will see price drop lower towards 1677 support instead.
On the H4, price dropped lower and is currently graphical overlap support zone at 1809. With price still holding above moving average, we might see buyers enter and push price higher towards 1835 resistance. Otherwise, failure to hold above 1809 will see price drop towards 50% Fibonacci retracement at 1794 support instead.
Areas of consideration:
- 1835 H4 resistance level is the key level to watch.
The accuracy, completeness and timeliness of the information contained on this site cannot be guaranteed. IC Markets does not warranty, guarantee or make any representations, or assume any liability regarding financial results based on the use of the information in the site.
News, views, opinions, recommendations and other information obtained from sources outside of www.icmarkets.com.au, used in this site are believed to be reliable, but we cannot guarantee their accuracy or completeness. All such information is subject to change at any time without notice. IC Markets assumes no responsibility for the content of any linked site.
The fact that such links may exist does not indicate approval or endorsement of any material contained on any linked site. IC Markets is not liable for any harm caused by the transmission, through accessing the services or information on this site, of a computer virus, or other computer code or programming device that might be used to access, delete, damage, disable, disrupt or otherwise impede in any manner, the operation of the site or of any user’s software, hardware, data or property.


