
Key risk events today:
Canada CPI m/m, Common CPI y/y, Median CPI y/y, Trimmed CPI y/y; Crude Oil Inventories; FOMC Meeting Minutes.
Market news (Tuesday):
- Reserve Bank of Australia (RBA): Minutes from the RBA’s November meeting revealed the board is prepared to ease policy further, if needed, and agreed a case could be made for a rate cut at the meeting – https://www.rba.gov.au/monetary-policy/rba-board-minutes/2019/2019-11-05.html.
- Statistics Canada reported manufacturing sales edged down 0.2% in September to $57.4 billion, following a 0.8% increase in August (expected -0.5%).
- The US Census Bureau announced Privately‐owned housing units authorized by building permits in October were at a seasonally adjusted annual rate of 1,461,000. This is 5.0% (±1.7%) above the revised September rate of 1,391,000.
- Prime Minister Boris Johnson doubled down on his Brexit promises on Tuesday, saying only he could take Britain out of the European Union quickly in a testy leadership debate with opposition Labour’s Jeremy Corbyn – Reuters.
- The US Federal Reserve has interest rates at the appropriate level for the U. economy but risks to the economic outlook are still tilted downwards, New York Federal Reserve President John Williams said on Tuesday – Reuters.
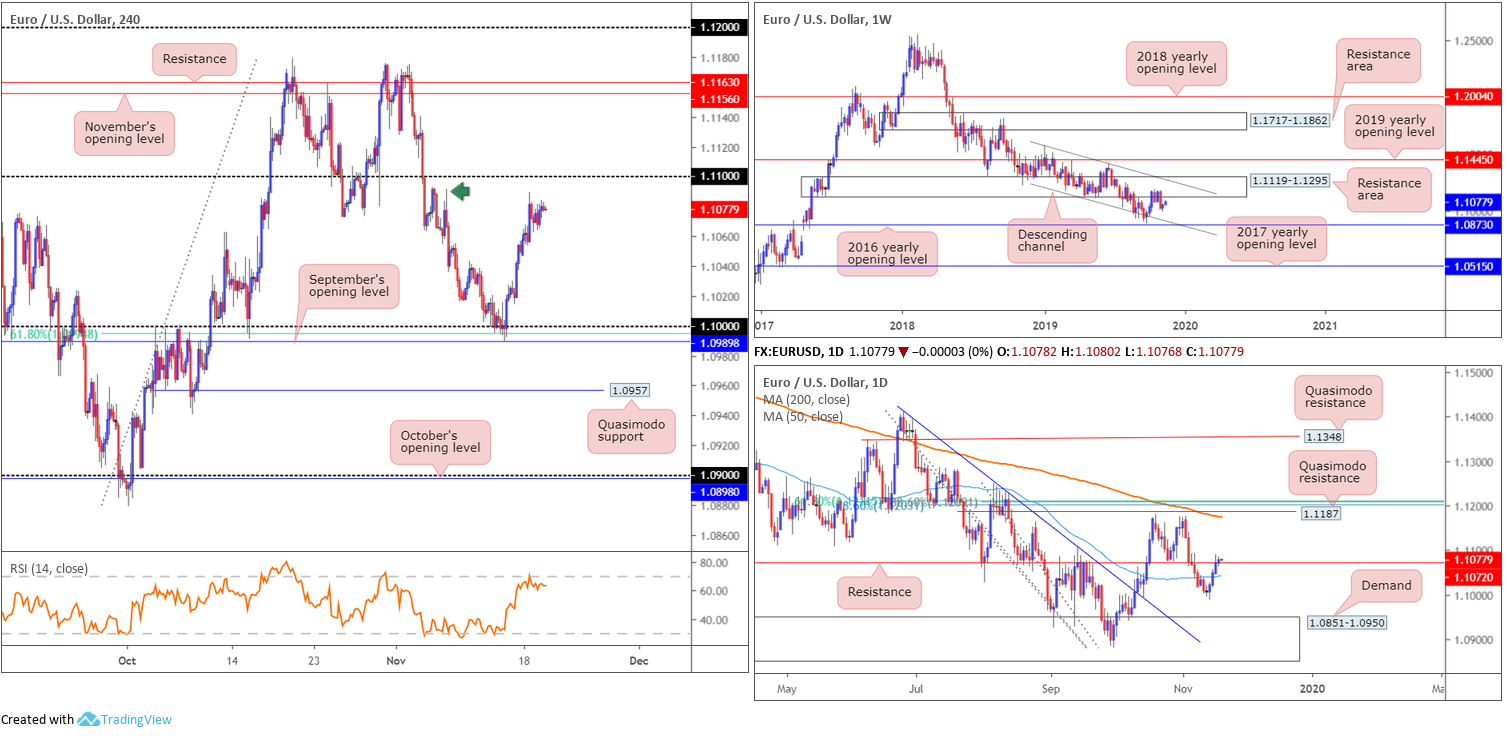
EUR/USD:
EUR/USD wrapped up Tuesday mostly unmoved, confined to a 20-point range. Consequent to yesterday’s uninspiring performance, much of the following analysis echoes thoughts put forward in recent reports.
The pair kicked off the week (Monday) in reasonably robust fashion, gliding to highs of 1.1090 before mildly paring gains into the close. Tops (green arrow) around the 1.1090 neighbourhood on the H4 timeframe are likely viewed as resistance in this market, as is the 1.11 handle. Beyond this point, resistance at 1.1163 and November’s opening level at 1.1156 remains the next upside objective. Indicator-based traders may also wish to acknowledge the relative strength index (RSI) recently shook hands with overbought territory.
On a broader perspective, weekly flow continues to hold south of a long-standing resistance area at 1.1119-1.1295. Further selling has the lower boundary of a descending channel to target (extended from the low 1.1109), set a few points north of the 2016 yearly opening level at 1.0873. Concerning trend direction, the primary downtrend has been in motion since topping in early 2018 at 1.2555.
A closer reading of higher-timeframe action on the daily timeframe places the market at notable resistance formed at 1.1072 (price is marginally testing above this region as we write). A decisive close north of the said resistance demonstrates seller weakness out the weekly resistance area mentioned above at 1.1119-1.1295, while a rejection potentially confirms the downside bias. Another area to keep an eye on is demand at 1.0851-1.0950 – houses the 2016 yearly opening level at 1.0873.
Areas of consideration:
Outlook unchanged.
From a technical standpoint, daily resistance at 1.1072 is key. Should price action remain beneath this base, further downside is likely in store for EUR/USD, while an upside violation could prompt a retest at the weekly resistance area 1.1119-1.1295.
With the primary downtrend facing south, and price recently exiting a notable weekly resistance area, a rejection off the said daily resistance level by way of a bearish candlestick formation (either H4 or daily scale) will likely be regarded as a strong bearish indicator, with the option of calculating entry/risk levels based off the candle pattern for possible shorts.
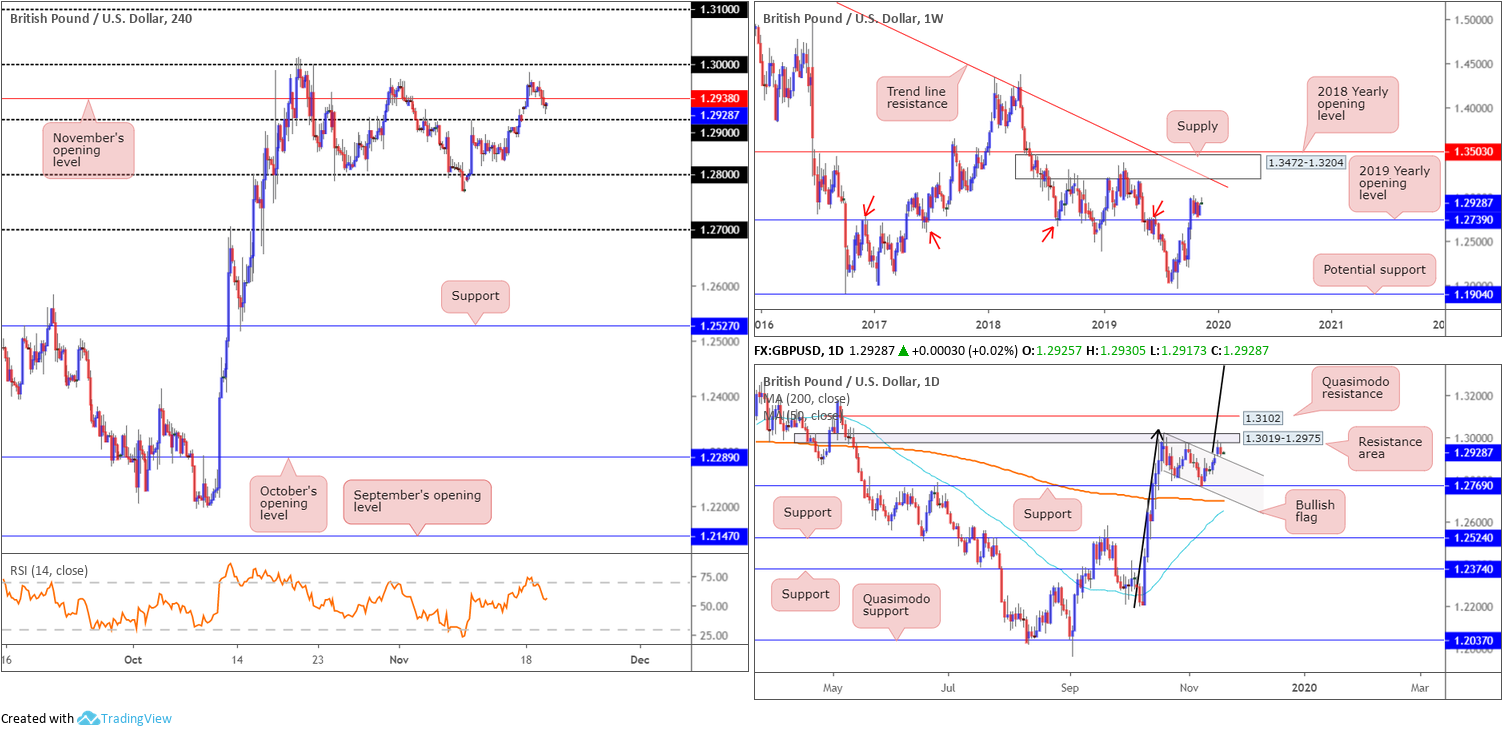
GBP/USD:
Sterling pared a large share of Monday’s gains Tuesday, as traders processed the UK General Election debate between UK Prime Minister Boris Johnson and Labour Leader Jeremy Corbyn.
Leaving the key figure 1.30 unchallenged, the H4 candles shuffled back beneath November’s opening level at 1.2938 and tested lows just shy of the 1.29 handle. As of writing, 1.29 stands as the next obvious support target on the H4 timeframe, with 1.2938 perhaps offering intraday resistance.
Technical research on the daily timeframe, as underscored in Tuesday’s report, reveals a bullish flag pattern (1.3012/1.2804), which has been developing since price broke through resistance at 1.2769 (now a serving support), saw its upper boundary violated Monday in the shape of an opening gap. Upside, however, is capped on this timeframe by a resistance area plotted at 1.3019-1.2975, followed closely by Quasimodo resistance sited just above at 1.3102.
Interestingly, the view on the weekly timeframe exhibits scope to extend north, at least until crossing swords with
supply at 1.3472-1.3204 and long-term trend line resistance etched from the high 1.5930. The immediate trend, however, faces a downward trajectory from 1.4376, with a break of the 1.1904 low (labelled potential support) confirming the larger downtrend from 1.7191.
Areas of consideration:
Outlook mostly unchanged.
Longer-term traders are likely long the upside break of the daily bullish flag, with protective stop-loss orders either positioned beneath the breakout candle’s lower shadow (1.2908 – aggressive approach), below support at 1.2769 or even beneath the flag’s lower limit (conservative approach).
The bullish flag’s take-profit target is huge, coming in at 1.3780 (black arrows – measured from the preceding move and added to the breakout point).
Ultimately, short-term opportunities are limited, according to our chart studies. If 1.29 is tested, nevertheless, traders may look to long from here, with 1.2938, 1.2975 (underside of daily resistance area) and 1.30 set as upside targets.
An upside violation of 1.30 this week, nevertheless, adds confidence to further buying out of the daily bullish flag, given limited resistance is visible until 1.31. In fact, this could serve as an additional entry point: a retest at 1.30 as support, following a decisive close higher.
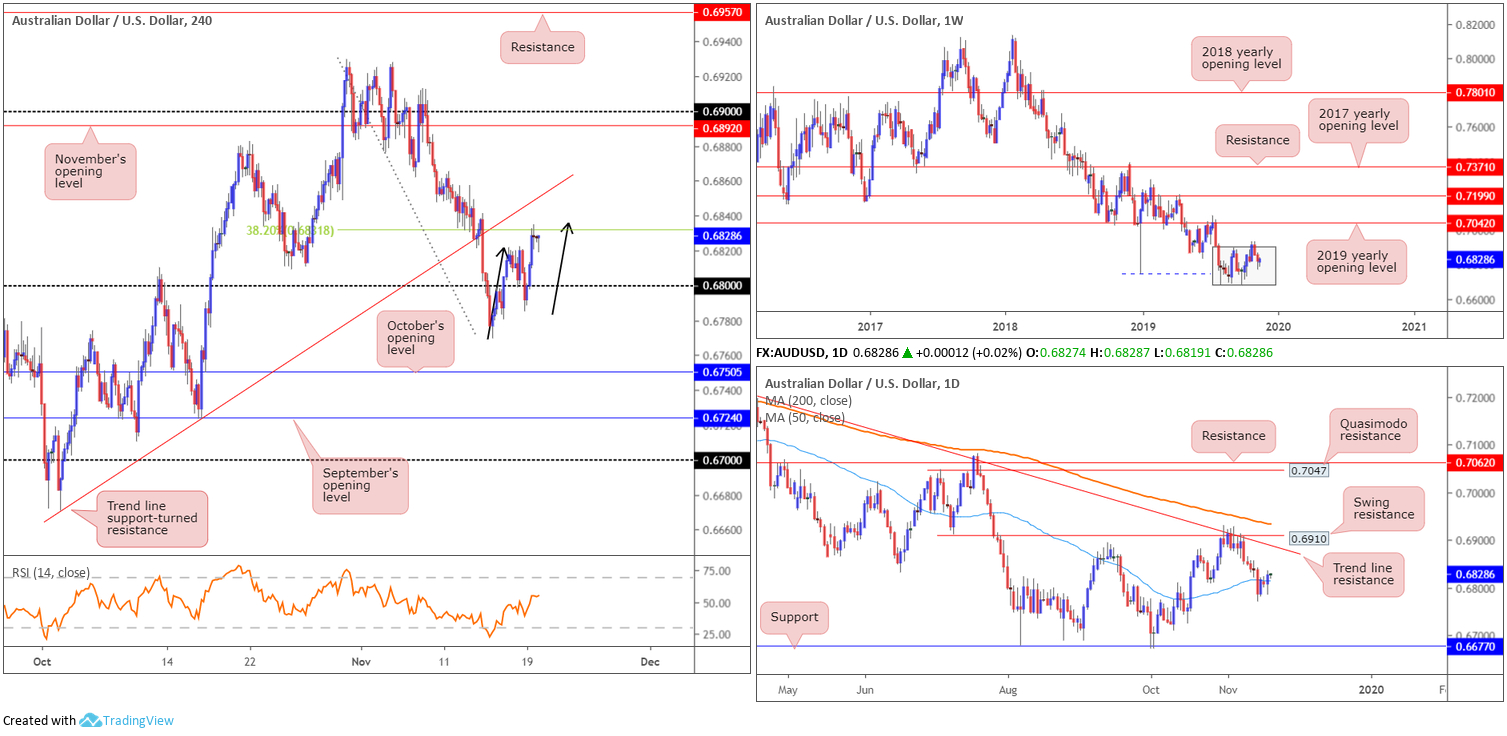
AUD/USD:
Despite a knee-jerk response to dovish RBA minutes in early hours Tuesday, consequently drawing AUD/USD sub 0.68, the pair concluded the session in positive territory, up 0.29%.
Reclaiming 0.68+ status in early London, price reached highs of 0.6834 and shaped a H4 AB=CD bearish pattern (black arrows). Having seen this correction pattern align with a 38.2% Fibonacci retracement ratio at 0.6831, a pullback to 0.68 is certainly a possibility today.
Elsewhere, daily price chalked up a standout bullish outside day pattern yesterday, not only engulfing its prior candle but also overthrowing the 50-day SMA (blue – 0.6814). According to the daily scale, this may entice additional buying towards trend line resistance taken from the high 0.7393, closely followed by swing resistance plotted at 0.6910 and the 200-day SMA (orange – 0.6934).
Higher on the curve, weekly price is meandering within its current 3-month long consolidation zone between 0.6894/0.6677 (light grey). This follows a recent two-candle fakeout at the top edge of the said range.
Areas of consideration:
Based on current analysis, selling the H4 AB=CD correction is possible, though entails possibly competing with buyers on the daily timeframe following yesterday’s bullish engulfing candle. Therefore, shorts may opt to wait and see if H4 pencils in a bearish candlestick configuration, before pulling the trigger. A logical first take-profit target sits around the 0.68 region.
A continuation to the upside, as suggested on the daily timeframe, however, will likely draw in nearby trend line support-turned resistance taken from the low 0.6670.
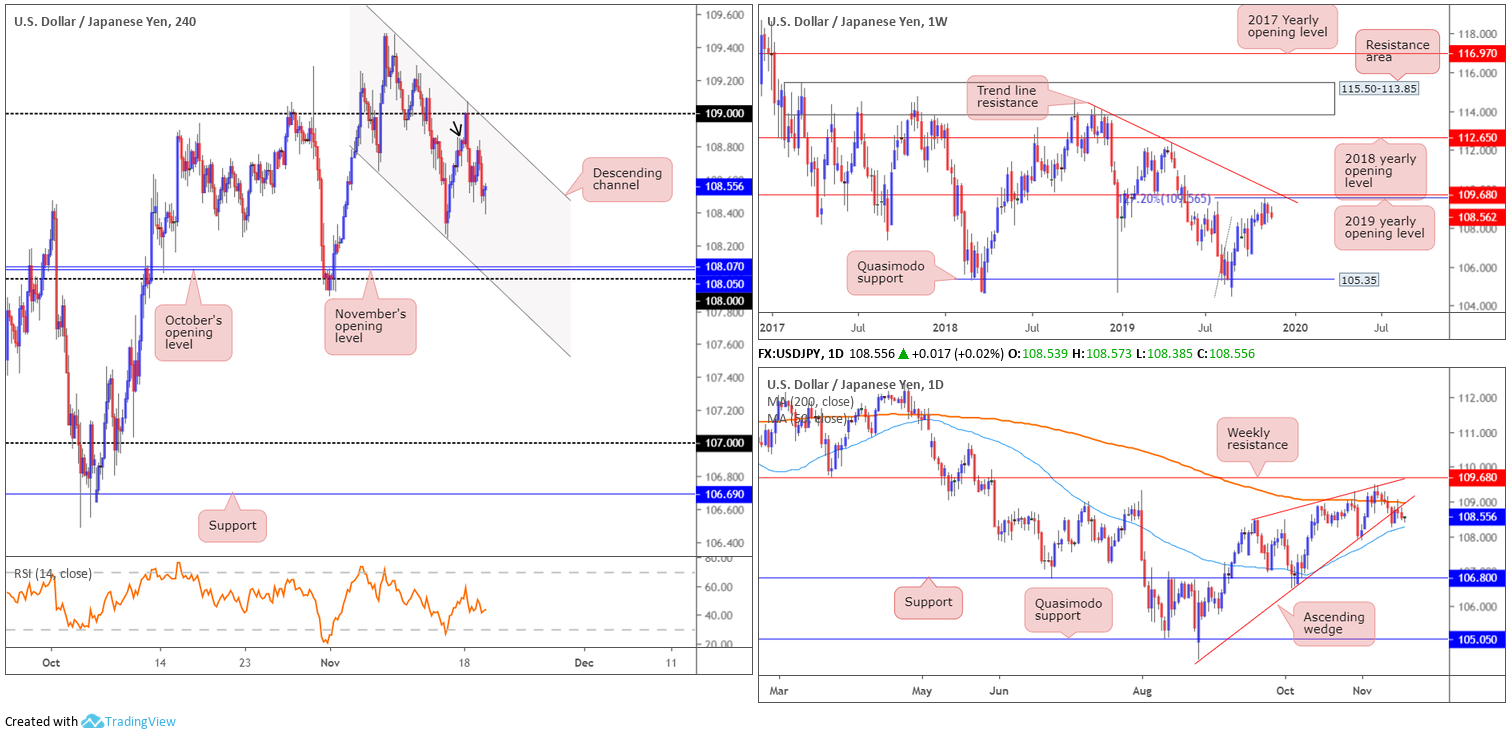
USD/JPY:
USD/JPY maintained a bearish presence Tuesday, largely bolstered by waning US Treasury yields – 10-year yield declined 1.89% and closed at 1.784% – though the benchmark US dollar index, or DXY, traded subdued.
As underlined in Tuesday’s technical briefing, H4 price is currently chalking up a descending channel formation (109.47/108.64), with last Thursday’s low priced in as the next support at 108.24, closely shadowed by the 108 handle, along with November and October’s opening levels at 108.05 and 108.07, respectively.
Supporting the market’s downbeat tone is the 200-day SMA (orange – 108.96) and the lower edge of an ascending wedge formation (104.44), which has been unfolding since early September. Last week ended with the unit retesting the underside of the broken wedge.
Technical research based on the weekly timeframe, as highlighted in Monday’s report, had the USD/JPY contained within the prior week’s range (109.48/108.18) last week. Structurally, resistance is seen close by in the form of the 2019 yearly opening level at 109.68 and a 127.2% Fibonacci ext. point at 109.56 (taken from the low 104.44). Also sited nearby is trend line resistance extended from the high 114.23. In regards to the market’s primary trend, the pair has been entrenched within a range since March 2017, spanning 115.50/105.35.
Areas of consideration:
Monday’s report had the following to say:
Although H4 price may look to revisit the underside of 109 this week, the fact we’re retesting the underside of a long-standing daily wedge (see above) in the form of a H4 shooting star candlestick pattern (black arrow) is likely enough to entice sellers into the market this week. Conservative stop-loss placement is seen around 109.16, which not only clears 109 but also the 200-day SMA on the daily timeframe (orange – 108.98).
Irrespective of whether one entered short on the back of the H4 bearish candlestick pattern, or at the underside of 109, protective stop-loss placement remained the same, with both setups currently trading in profit. In terms of downside targets, see above in bold.
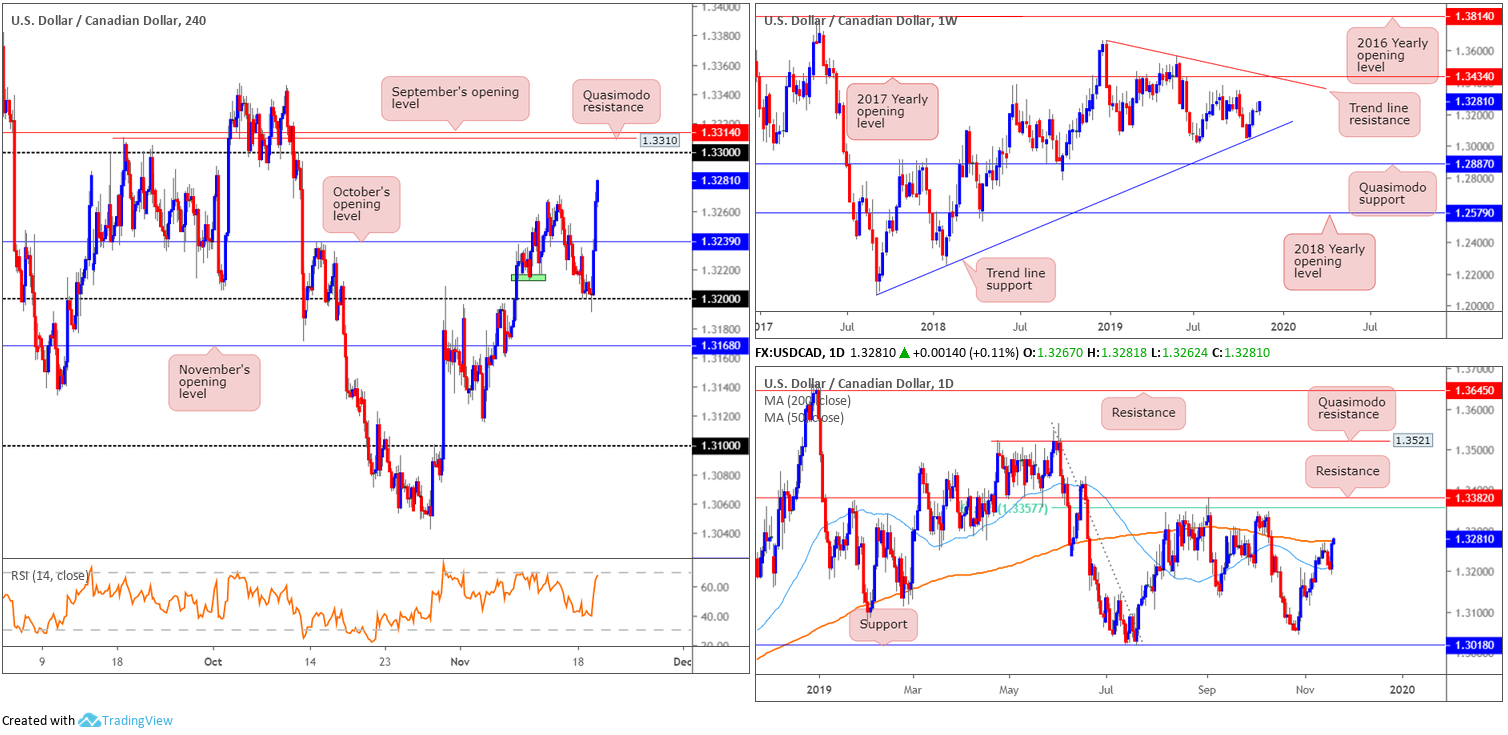
USD/CAD:
A combination of weak crude oil prices, manufacturing sales out of Canada, US housing data and comments from BoC’s Council Member Wilkins, sparked an energised lift in USD/CAD prices Tuesday from the 1.32 handle.
Traders who read Tuesday’s technical briefing may recall the following piece (italics):
Recent reports stated price will likely dive through 1.3212 (green zone), trip lower-timeframe sell stops, and test 1.32 for a bounce higher on the H4 timeframe. 1.32 is supported by the current 50-day SMA (1.3212) on the daily timeframe. As evident from the chart, price did indeed test 1.32 yesterday and is currently holding ground. Traders long 1.32 have an initial upside target set around October’s opening level at 1.3239.
As we head into Wednesday, those long from 1.32 finished Tuesday in strong profits, with price easily cutting through 1.3239 and reaching highs of 1.3272. In terms of the weekly timeframe, additional upside remains a possibility, targeting tops around 1.3342, closely followed by the 2017 yearly opening level at 1.3434 and trend line resistance taken from the peak at 1.3661. Daily movement, however, is seen crossing swords with the 200-day SMA (1.3275), with a break of this barrier opening upside to resistance around the 1.3382 neighbourhood/61.8% Fibonacci retracement ratio at 1.3357.
Areas of consideration:
The 1.33 handle on the H4 timeframe is likely to enter the fold sometime today and possibly entice selling. 1.33, a widely watched level by and of itself, boasts additional resistance in the form of Quasimodo resistance at 1.3310 and September’s opening level at 1.3314. This, therefore, marks an ideal second take-profit target for longs.
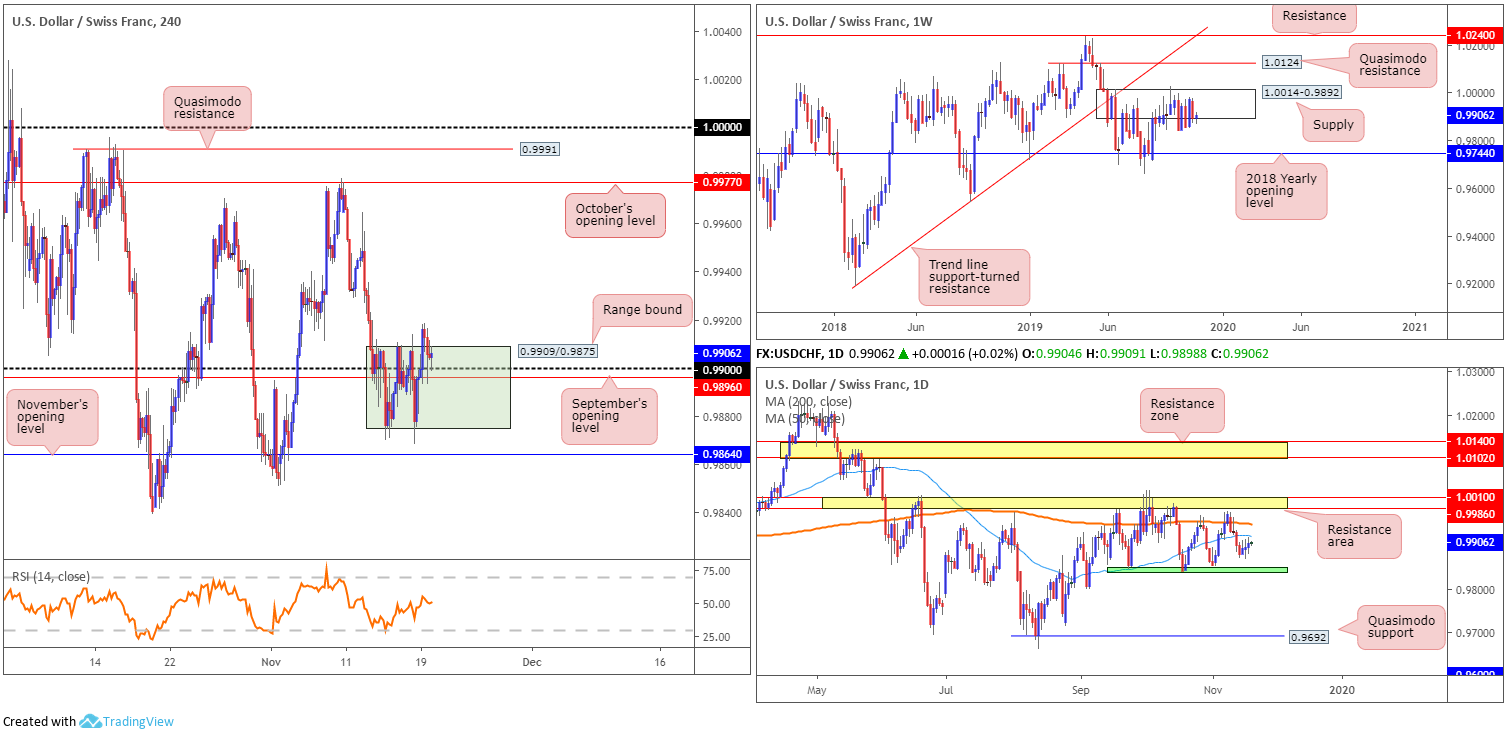
USD/CHF:
The US dollar concluded Tuesday a touch higher against the Swiss franc, consequently piercing the top edge of a H4 range between 0.9909/0.9875. Price clocked a session high at 0.9918 and retreated to the 0.99 handle/September’s opening level at 0.9896 (levels encased within the current H4 range).
A few points south of this range lies an additional layer of support at 0.9864: November’s opening level, while a decisive push to the upside may unlock the door to October’s opening level coming in at 0.9977.
Against the back drop of short-term flows, higher-timeframe activity reveals weekly price remains nestled around the underside of supply at 1.0014-0.9892. As highlighted in previous reports, the beginning of October witnessed a penetration to the outer edge of the supply area’s limit, possibly tripping a portion of buy stops and weakening sellers. An upside move out of the said supply may draw in Quasimodo resistance at 1.0124, while downside has the 2018 yearly opening level at 0.9744 in sight. According to the primary trend, price also reflects a slightly bullish tone; however, do remain aware we have been rangebound since the later part of 2015 (0.9444/1.0240).
Since mid-September, daily action has been busy carving out a consolidation between support around the 0.9845ish region (green) and a resistance area coming in at 1.0010/0.9986. Interestingly, between the said range, the 200-day and 50-day SMAs are seen closing in on each other (orange – 0.9948/blue – 0.9921).
Areas of consideration:
This market remains an incredibly difficult read, in terms of locating high-probability trading opportunities.
Longs above the current H4 range, particularly at the retest of 0.99, are likely eyed by many traders this morning. Appealing as it may be, buyers must contend with the 50-day SMA at 0.9921 on the daily scale. This is not to say a long from 0.99 is invalid, it is more to highlight potential nearby resistance that could hamper upside.
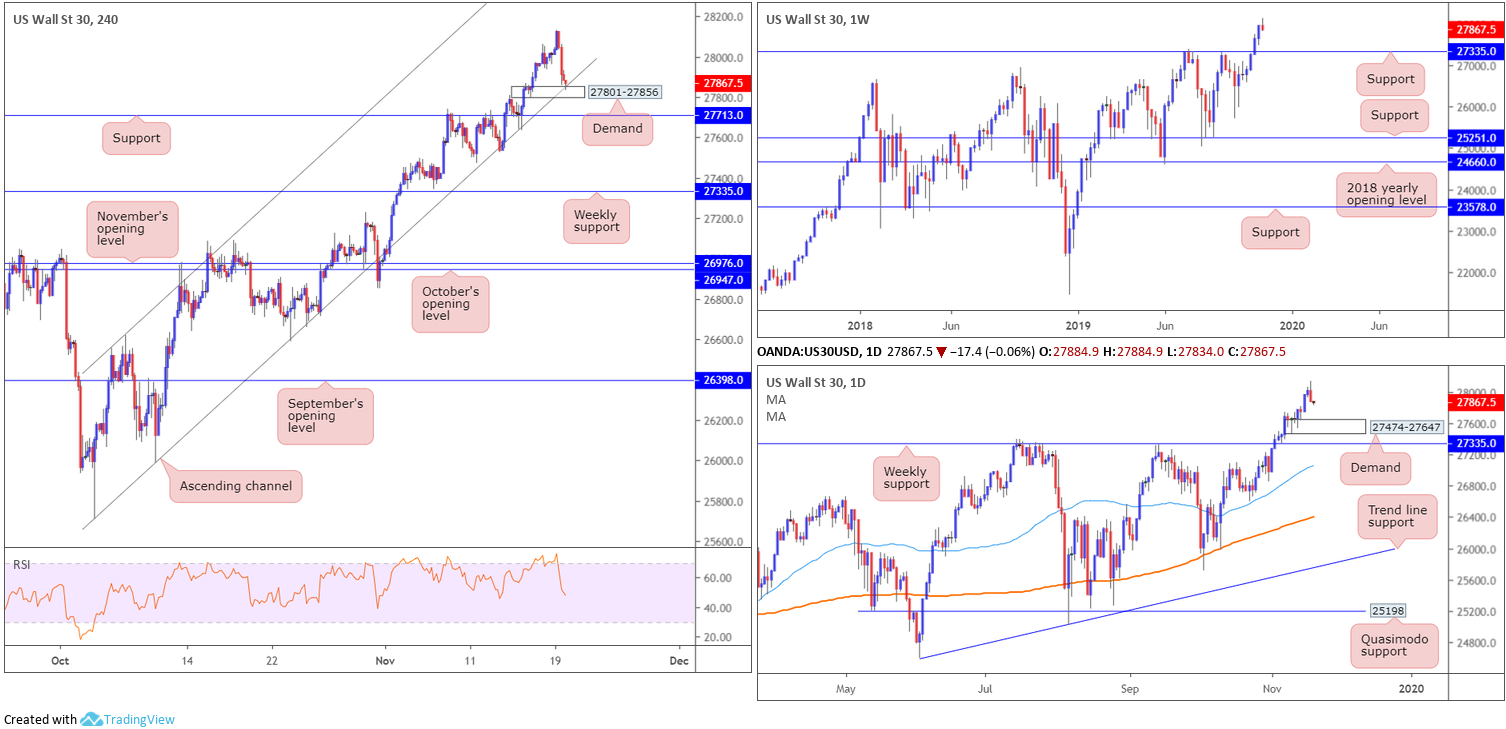
Dow Jones Industrial Average:
Major US benchmarks wrapped up Tuesday mostly lower amid second-rate earnings results and doubts concerning a US/China trade deal. The Dow Jones Industrial Average erased 102.20 points, or 0.36%; the S&P 500 lost 1.85 points, or 0.06% and the tech-heavy Nasdaq 100 rallied 10.26 points, or 0.12%.
Tuesday’s report highlighted the following (italics):
From the weekly timeframe, resistance at 27335 gave way in past trade and allowed the index to clock record highs. On account of this, a pullback to 27335 could be in store over the coming weeks for potential long opportunities.
Technically speaking, there’s little difference between the weekly and daily timeframes. Weekly support is also set as a central floor on this scale at 27335, though local demand coming in at 27474-27647 may also hinder downside.
For traders who remain long Thursday’s H4 hammer candlestick formation (considered a bullish signal at troughs) off channel support extended from the low 25710, ended the week in strong profits. Moving the protective stop-loss order to beneath 27801 (the lower edge of demand) is now an option, should you wish to trail profits.
A pullback to H4 demand at 27801-27856, given the strength of the uptrend right now, is certainly a potential scenario this week, particularly at the point it merges with the current H4 channel support.
Areas of consideration:
As evident from the H4 chart this morning, H4 action shook hands with H4 demand mentioned above at 27801-27856 and the current H4 channel support. Therefore, potential long scenarios are possible from here today. Traders wishing to add a little more confirmation to the mix may wait and see if H4 price chalks up an additional candlestick pattern before pulling the trigger; entry and risk can then be calculated based on this structure.
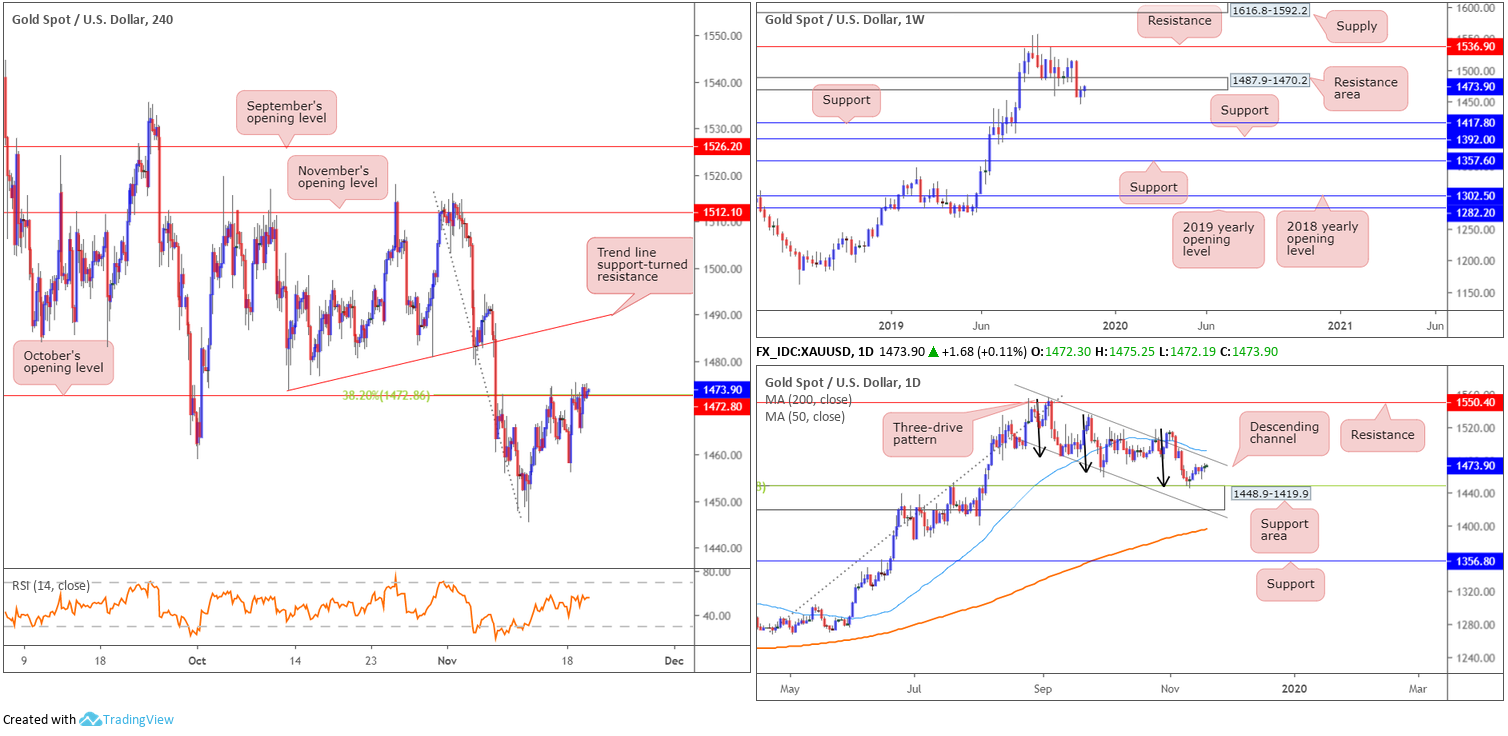
XAU/USD (GOLD):
XAU/USD prices finished Tuesday mostly unchanged, as buyers and sellers continue to square off around H4 resistance in the form of October’s opening level at 1472.8, which aligns with a 38.2% Fibonacci retracement ratio. Although price trades a shade above this level, likely concerning sellers from this point, additional resistance is seen by way of a weekly resistance area at 1487.9-1470.2. Rejection off the underside of this base could set the long-term stage for a move towards two layers of weekly support at 1392.0 and 1417.8.
A decisive move above 1472.8 today potentially unlocks the door for a move towards H4 trend line support-turned resistance extended from the low 1473.8, while a rejection could eventually guide the metal to the top edge of a daily support area coming in at 1448.9-1419.9.
Higher-timeframe flow shows the current daily support area aligns closely with a 38.2% Fibonacci retracement ratio at 1448.5. What’s also interesting here is the completion of a three-drive pattern around the top edge of the said support zone (black arrows). Upside targets lie at the upper daily channel taken from the high 1557.1 and 50-day SMA (blue – 1491.7).
Areas of consideration:
Outlook essentially unchanged.
Traders who remain short based on Thursday’s price action (see report here: https://www.icmarkets.com/blog/friday-15th-november-us-retail-sales-eyed-as-the-dollar-recedes-lower/), with protective stop-loss orders above the current weekly resistance area at 1487.9, are still likely holding ground as the top edge of the daily support area at 1448.9-1419.9 remains the initial downside target.
Those who entered long from the current daily support area, however, may feel the sting of weekly sellers this week, therefore close attention to any long positions in this market is recommended.
The accuracy, completeness and timeliness of the information contained on this site cannot be guaranteed. IC Markets does not warranty, guarantee or make any representations, or assume any liability regarding financial results based on the use of the information in the site.
News, views, opinions, recommendations and other information obtained from sources outside of www.icmarkets.com.au, used in this site are believed to be reliable, but we cannot guarantee their accuracy or completeness. All such information is subject to change at any time without notice. IC Markets assumes no responsibility for the content of any linked site.
The fact that such links may exist does not indicate approval or endorsement of any material contained on any linked site. IC Markets is not liable for any harm caused by the transmission, through accessing the services or information on this site, of a computer virus, or other computer code or programming device that might be used to access, delete, damage, disable, disrupt or otherwise impede in any manner, the operation of the site or of any user’s software, hardware, data or property.


