
Key risk events today:
Canada Inflation (CPI m/m); BoC Monetary Policy Report, Rate Statement, Overnight Rate and Press Conference; US Presidential Inauguration Day.
(Previous analysis as well as outside sources – italics).
EUR/USD:
Areas of consideration:
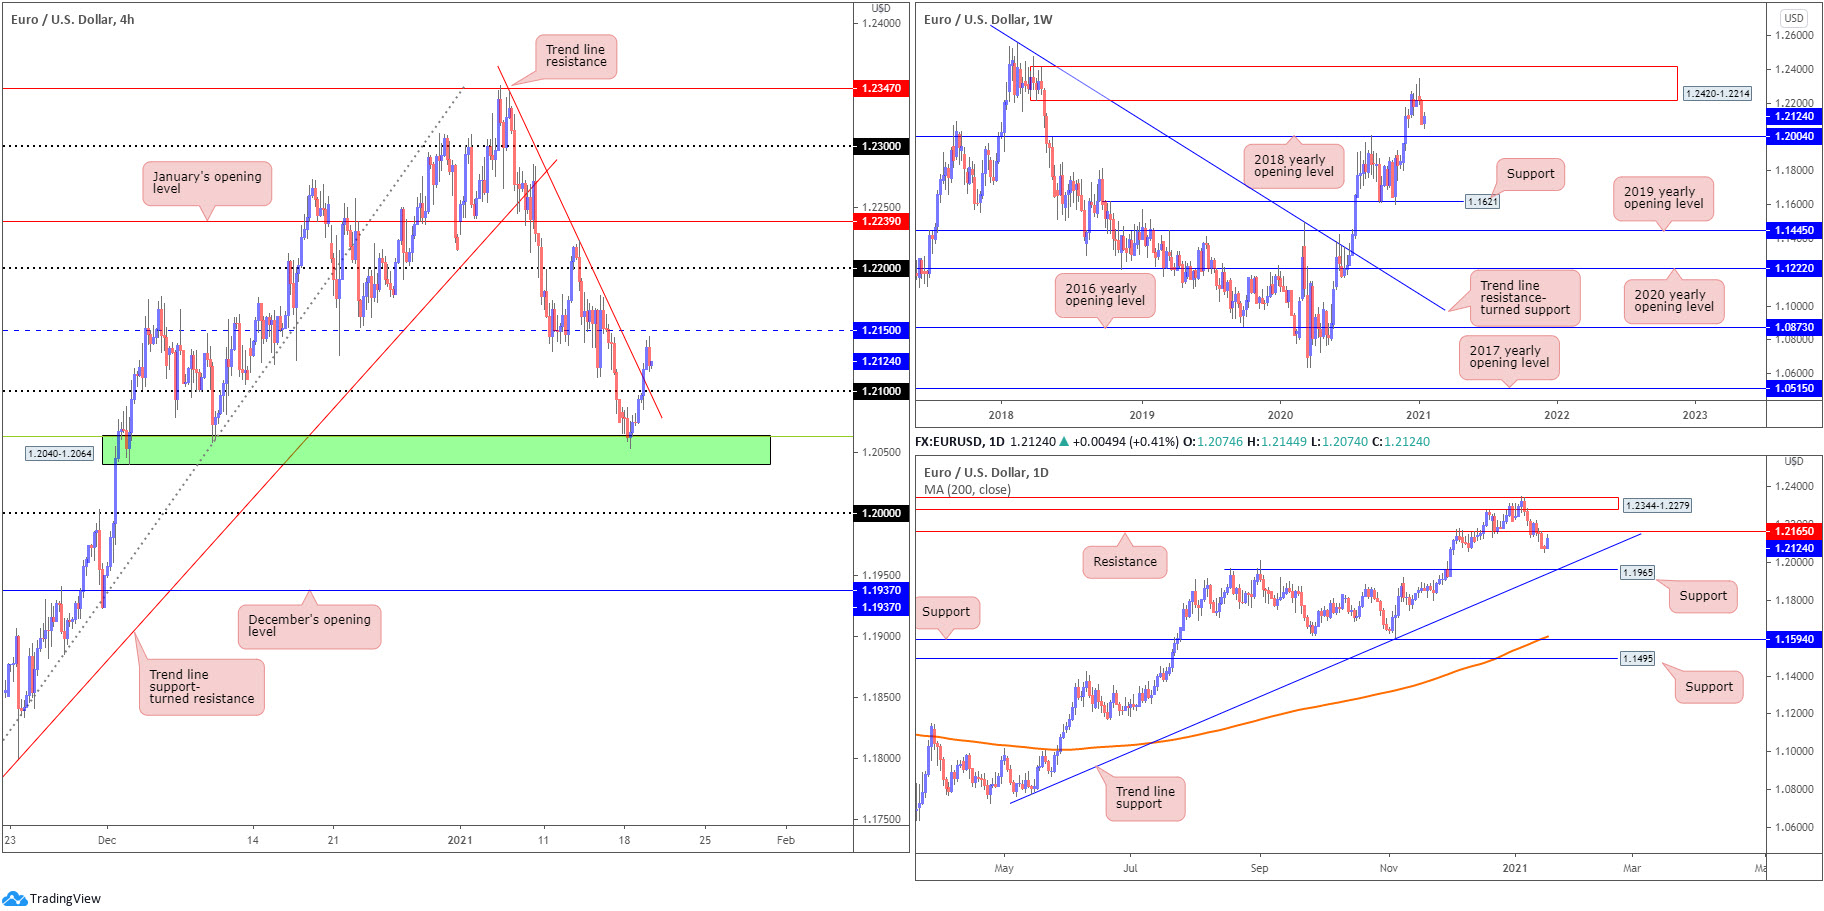
- The break of H4 trend line resistance, taken from the high 1.2344, on Tuesday has likely excited short-term buyers, particularly as the move also took out the 1.21 figure. A retest of the latter may also stimulate a bullish theme.
- While H4 overthrowing resistance at 1.2150 helps confirm a short-term upside bias, traders are urged to pencil in daily resistance at 1.2165.
- The 2018 yearly opening value at 1.2004 plotted on the weekly scale is a level to be mindful of, given the barrier converges with the key figure 1.20 on the H4. Weekly supply is another nearby zone worth keeping an eye on at 1.2420-1.2214. The 1.22 figure on the H4, therefore, may serve as interesting resistance.
- Daily support at 1.1965 and merging trend line support, extended from the low 1.0774, are levels that will likely call for attention should 1.20 on the H4 give way. Traders may also acknowledge December’s opening value at 1.1937 (H4) is seen nearby.
GBP/USD:
Areas of consideration:
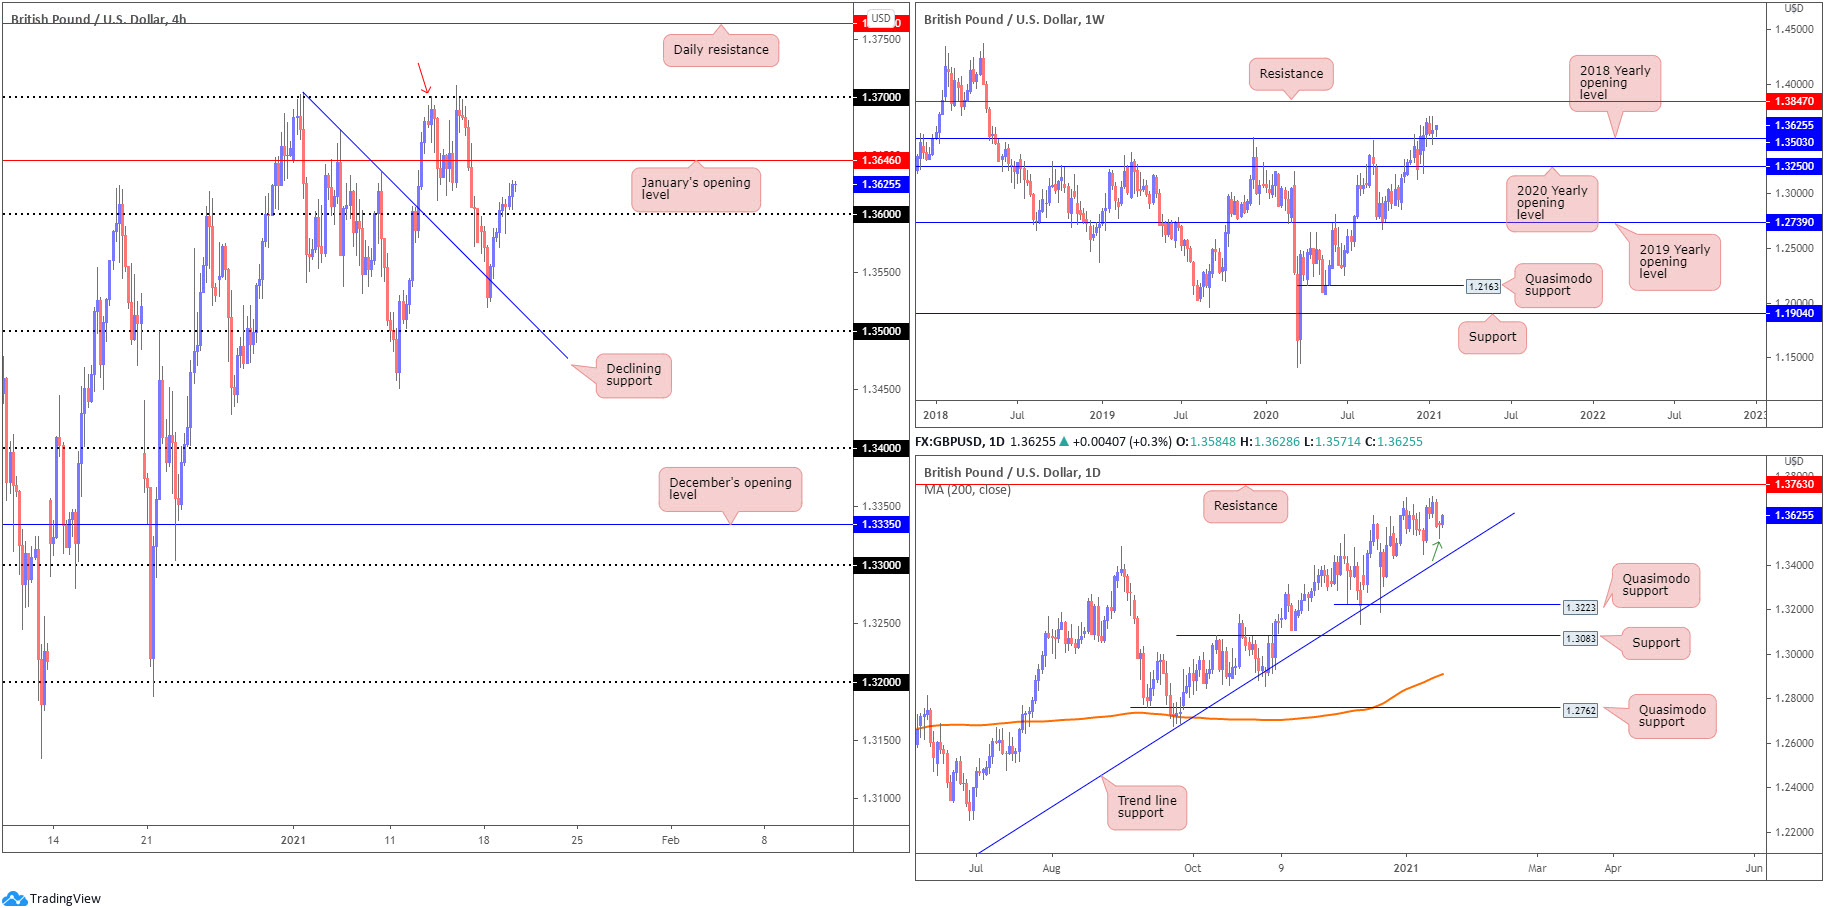
- Weekly support at 1.3503 holding, in a market trending higher, places long-term buyers in a favourable position. In terms of resistance on the weekly timeframe, buyers could take aim at 1.3847.
- Price action on the daily timeframe recently fashioned a bullish pivot reversal formation (green arrow), ahead of trend line support, taken from the low 1409. Assuming additional bullish movement, 2021 tops at 1.3711, along with resistance at 1.3763, could be next on tap.
- Early trading on Tuesday retested 1.36 as support on the H4, with buyers now facing resistance from January’s opening value at 1.3646. Climbing this level throws 1.37 in the mix as possible resistance, along with a Quasimodo resistance (red arrow).
- All three timeframes suggest an upside bias. This, of course, would be heightened should H4 cross above January’s opening value at 1.3646, with buyers perhaps then targeting 1.37.
AUD/USD:
Areas of consideration:
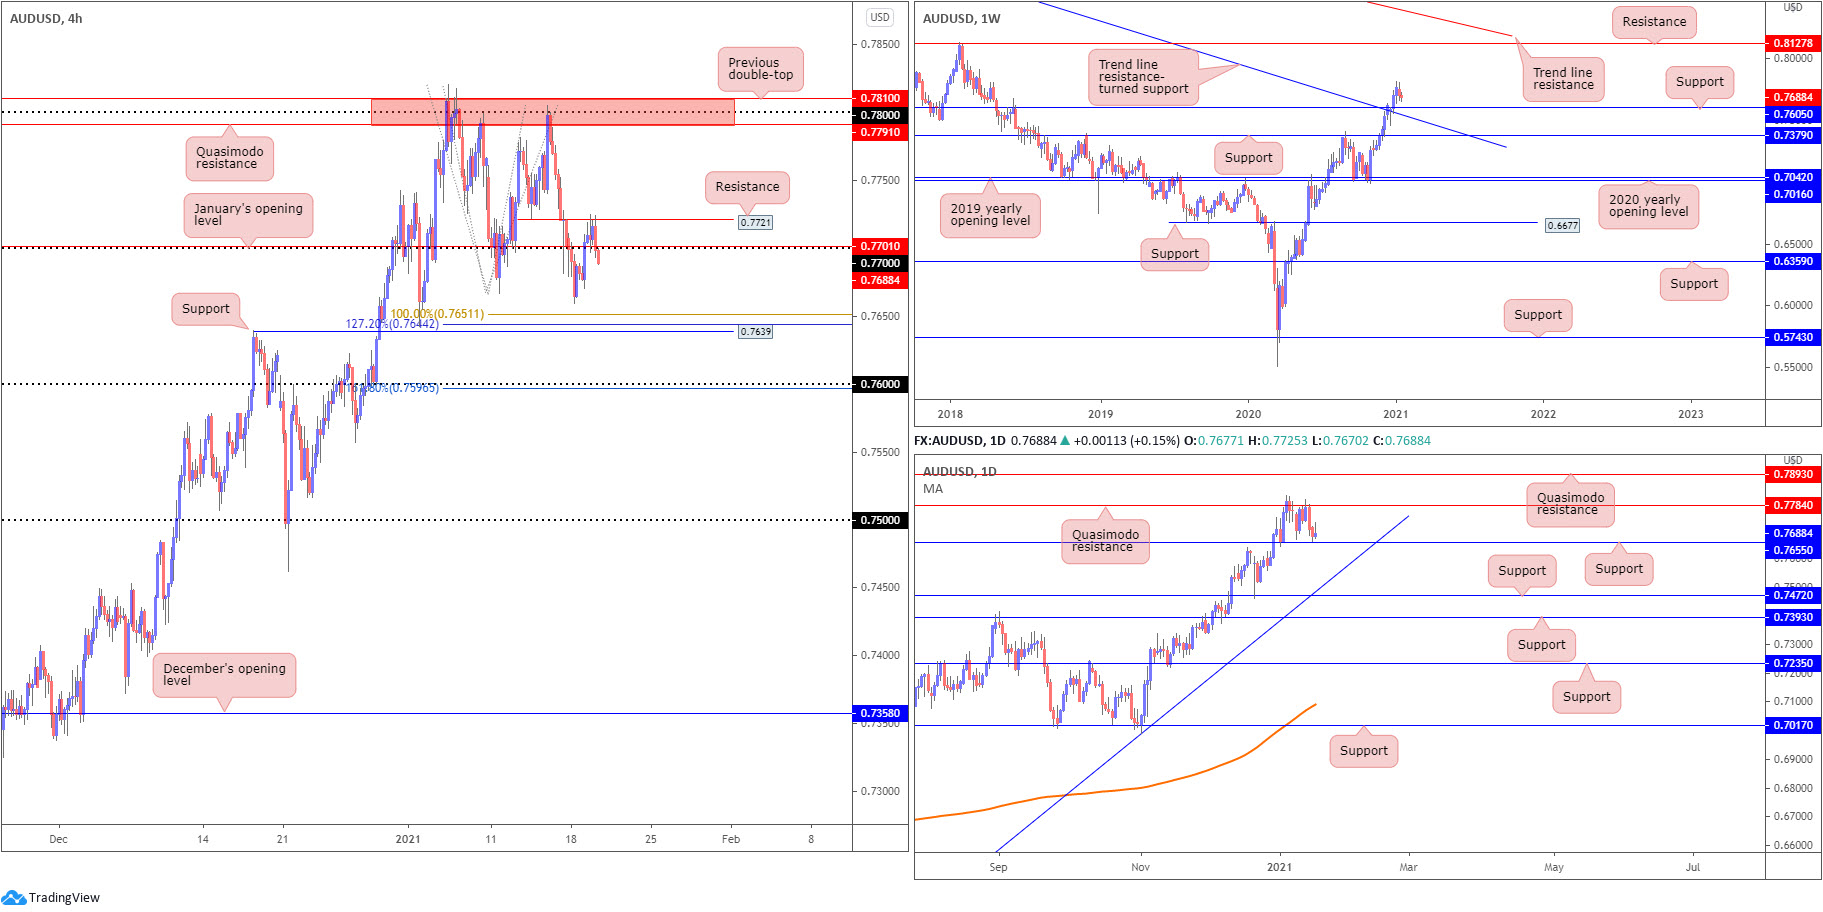
- Trend has remained firmly to the upside since early 2020. In addition to this, the weekly timeframe shows price has room to reach as far north as resistance at 0.8127. Though before pushing higher, a retest at support drawn from 0.7605 (previous Quasimodo resistance) could take shape. Therefore, 0.76 on the H4 scale is interesting, a level not only mingling with the weekly level, but also converging with a 161.8% H4 Fibonacci extension point at 0.7596.
- With H4 resistance hindering upside on Tuesday at 0.7721, and price crossing south of 0.77 (and January’s opening value at 0.7701), H4 support at 0.7639 may interest today, given its close connection with a H4 2% Fibonacci extension point at 0.7644, a 100% Fibonacci extension at 0.7651 and daily support coming in at 0.7655.
- H4 resistance between 0.7810 and 0.7791 remains a noteworthy base, joining closely with daily Quasimodo resistance at 0.7784.
USD/JPY:
Areas of consideration:
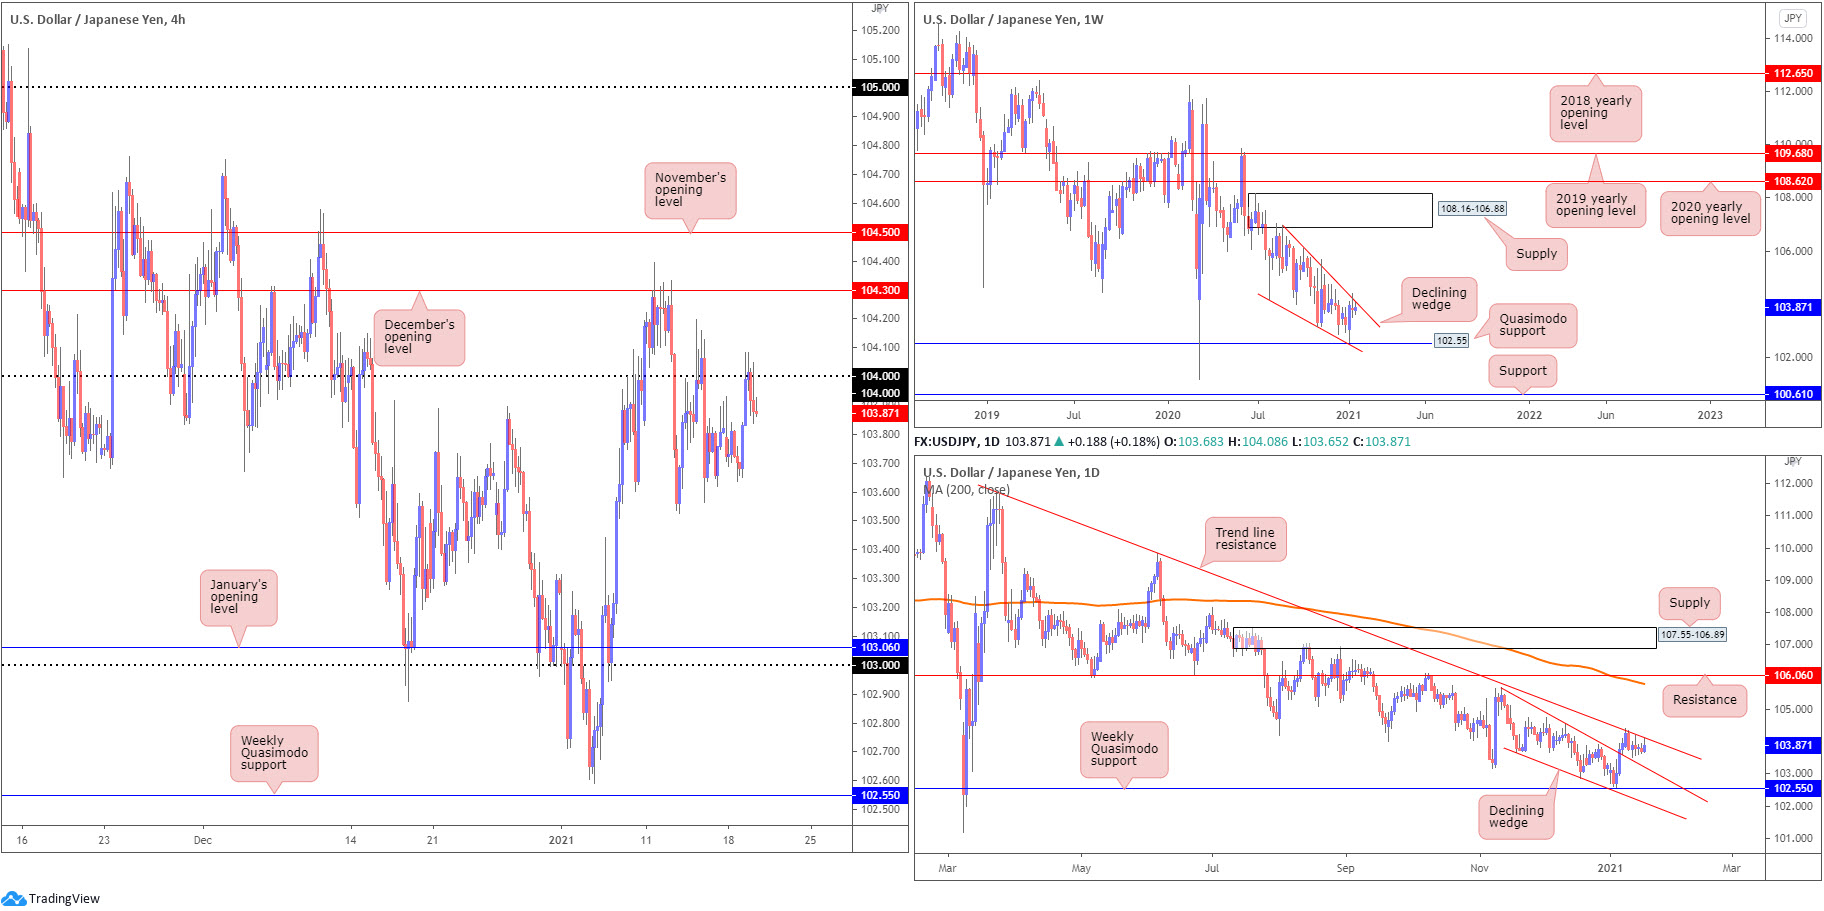
- Since connecting with the underside of weekly supply at 108.16-106.88 in August (2020), price has gradually shifted lower and developed a weekly declining wedge (106.94/104.18). Notably, the upper edge of this pattern also fuses with daily trend line resistance, extended from the high 111.71.
- (H4) 104 welcoming another retest as resistance on Tuesday is likely to interest sellers, given the bigger picture holding off trend line resistances. However, the fact sellers have yet been unable to breach last Wednesday’s low at 103.52 signals sellers may lack drive.
- Breaching 103.52 (on the H4) may induce further selling, targeting the upper boundary of the penetrated declining wedge on the daily timeframe (taken from the high 105.67), followed by January’s opening value at 103.06 and the 103 figure (H4).
USD/CAD:
Areas of consideration:
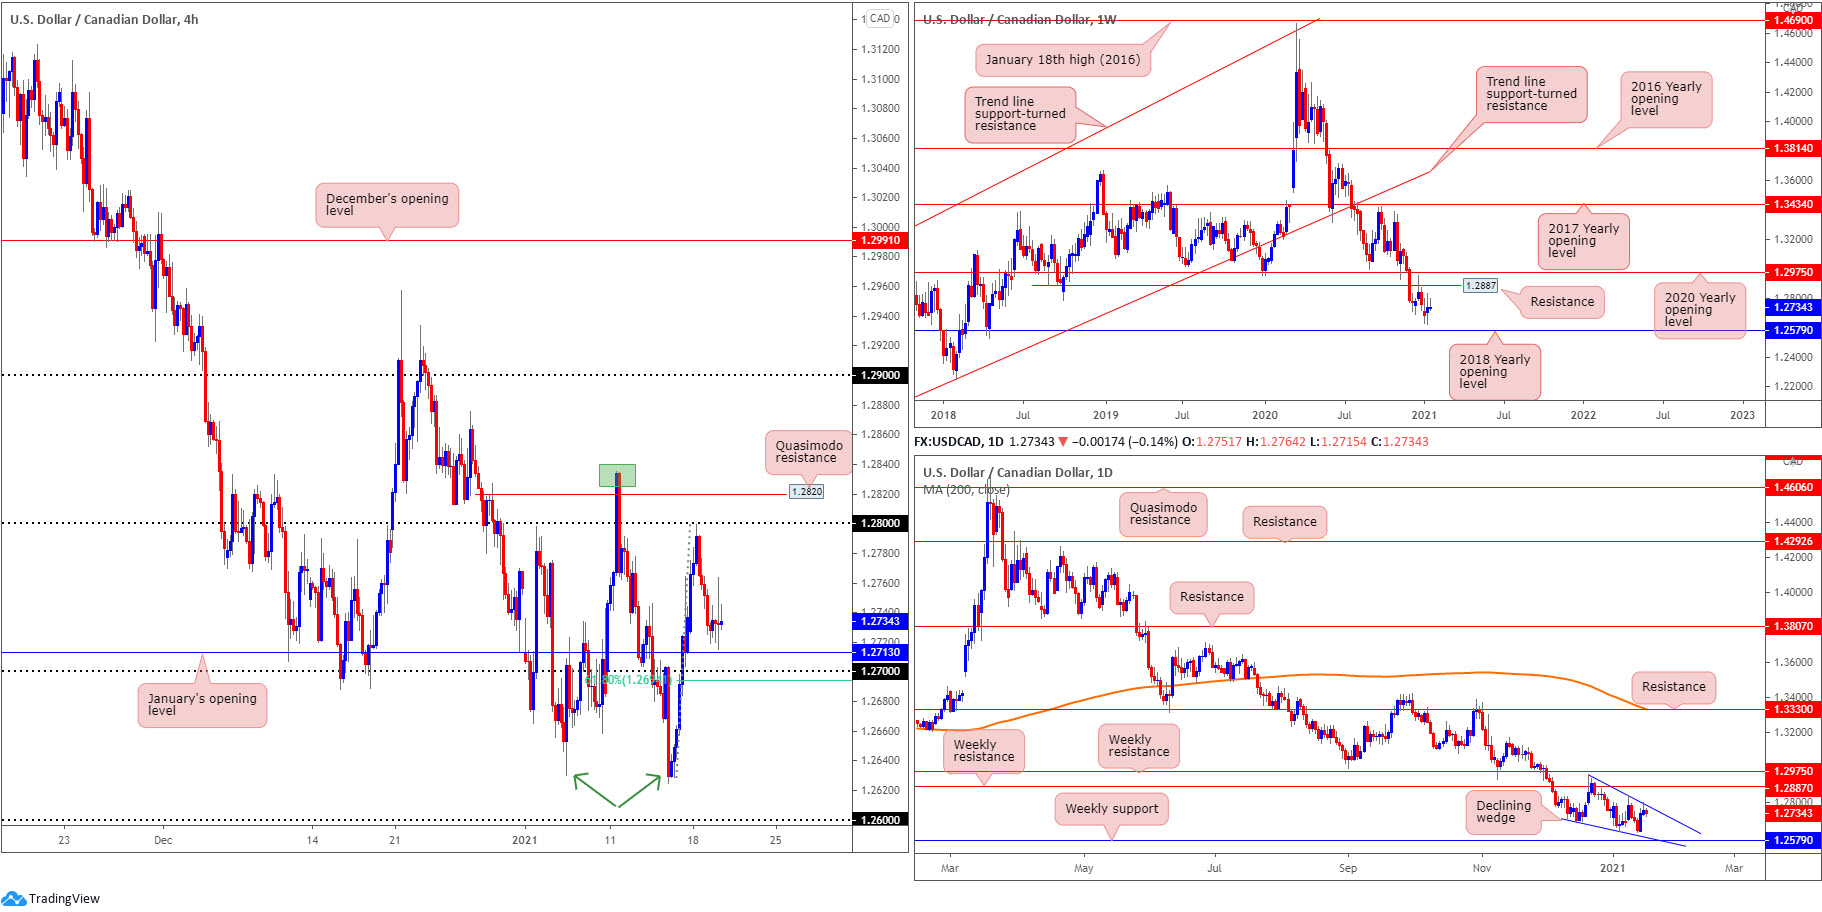
- January’s opening value at 1.2713 on the H4, fused together with the 1.27 figure and a 61.8% Fibonacci retracement ratio at 1.2694, provides short-term traders an area of support to work with. Below this area, a bearish scenario could emerge, targeting multi-month lows at 1.2624, followed by 1.26 and then weekly support at 1.2579 (the 2018 yearly opening value).
- Buying from 1.2694-1.2713 could be short-lived in view of daily price testing the upper edge of a declining wedge (1.2957/1.2688). It is also worth noting the pair has been in a decline since topping in March (2020).
- The declining wedge is a pattern that is worth monitoring. A breakout to the upside—a reversal signal—could have buyers test weekly resistance at 1.2887, a previous Quasimodo support level.
USD/CHF:
Areas of consideration:
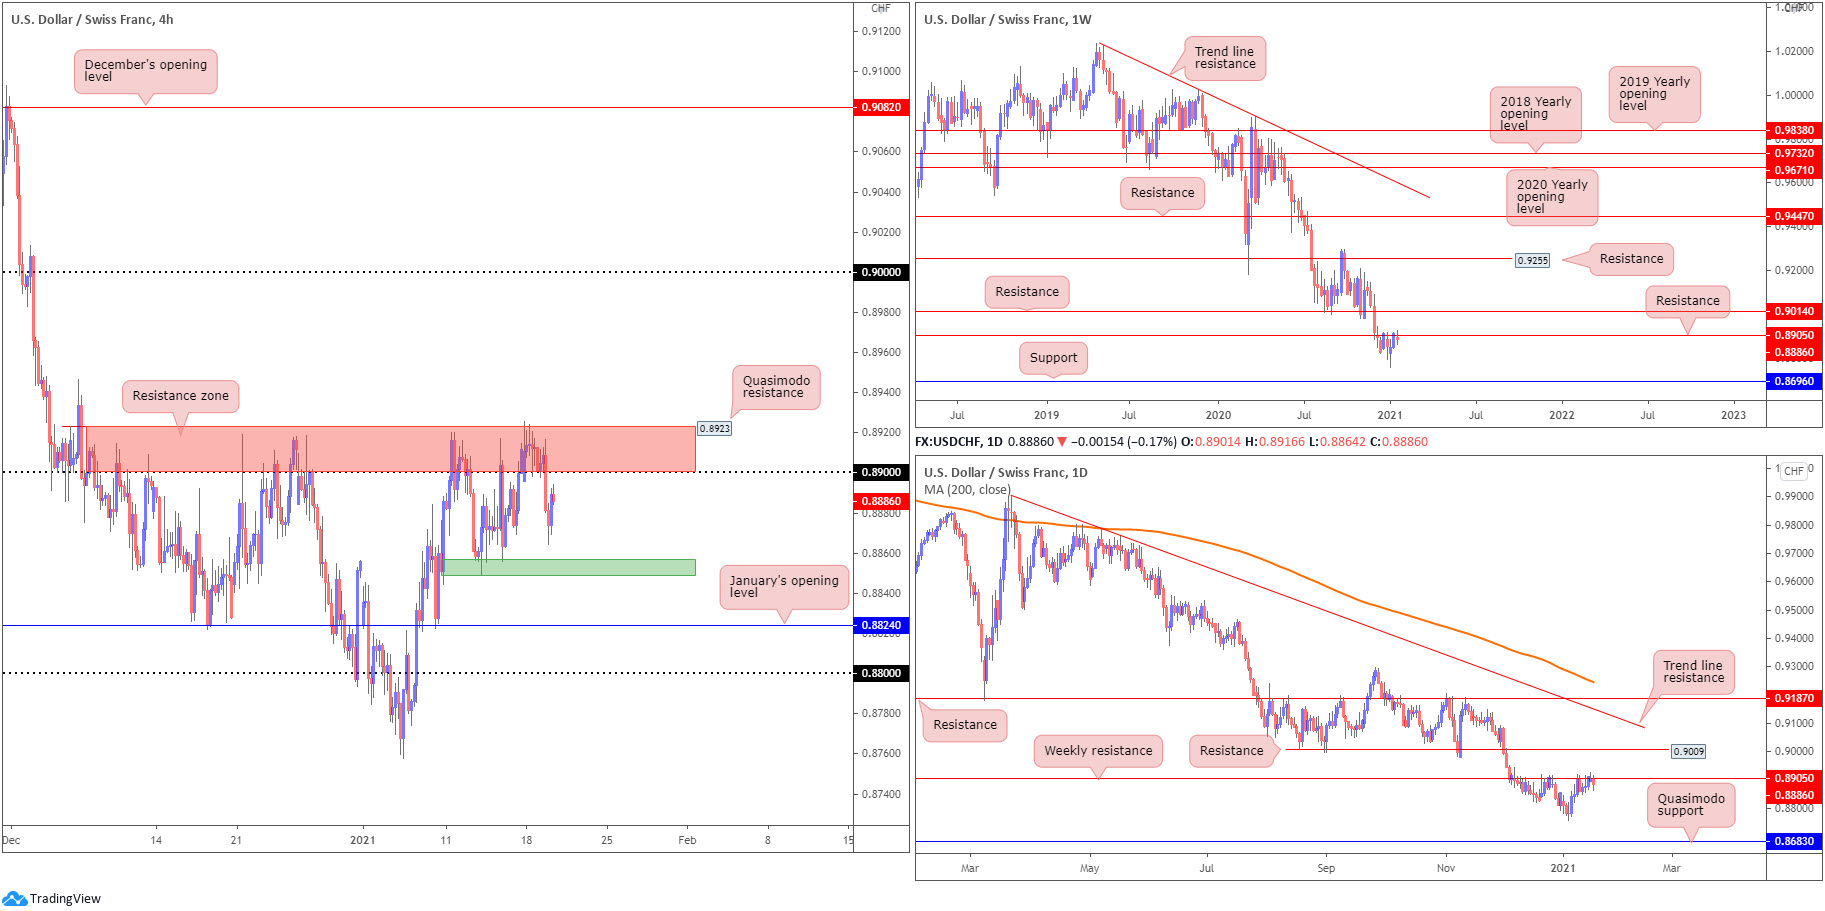
- H4 resistance at 0.8923-0.89, made up of a Quasimodo resistance and the 0.89 figure, is a key base due to its connection with weekly resistance at 0.8905. This—coupled with the clear downtrend since April 2019—emphasises a technically bearish vibe. Downside targets on the H4 are seen at the 0.8850ish range (green), closely followed by January’s opening value at 0.8824 and the 0.88 figure.
- Should H4 buyers form a decisive close above 0.8923, on the other hand, a breakout theme could emerge, targeting the 0.90 figure, which happens to intersect with weekly resistance at 0.9014 and daily resistance placed at 0.9009. Conservative buyers north of 0.8923 are likely to seek at least a retest at 0.89-0.8923 before pulling the trigger.
Dow Jones Industrial Average:
The Dow Jones Industrial Average climbed 116.26 points, or 0.38%; the S&P 500 rallied 30.66 points, or 0.81% and the Nasdaq advanced 198.68 points, or 1.53%.
Areas of consideration:
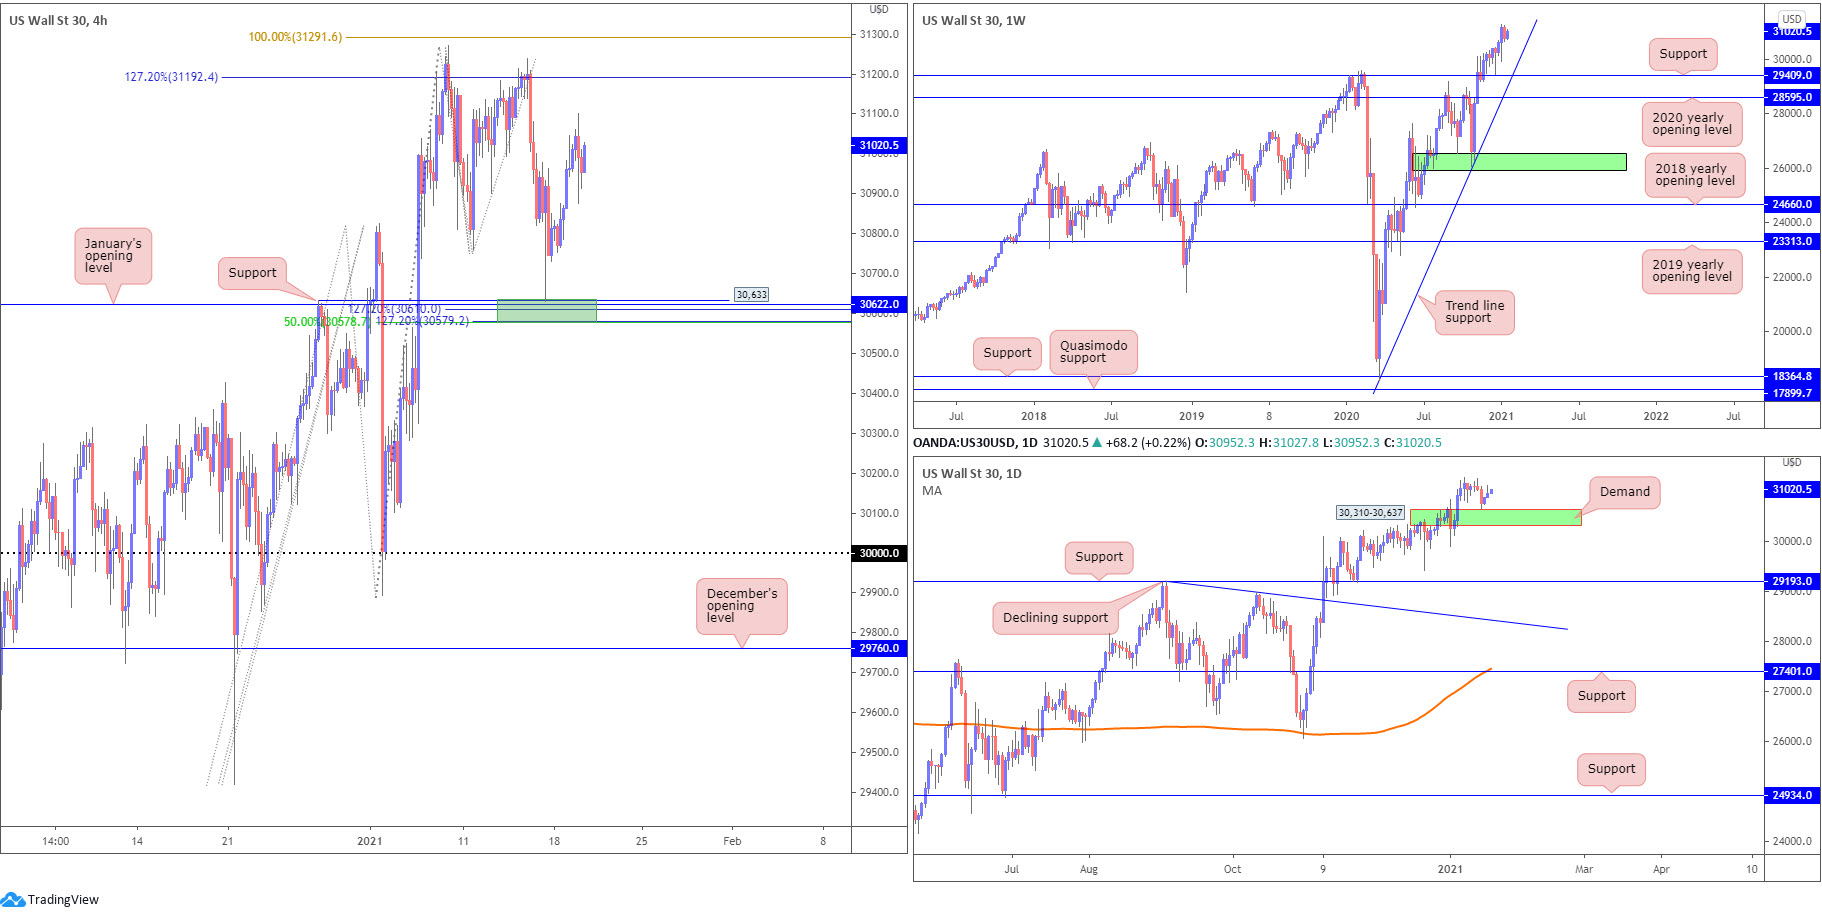
- The technical position on the weekly timeframe shows price action hovering just ahead of 2021 highs at 31,271. As noted in previous analysis, the research team sees limited support in sight until trend line support, extended from the low 18,213. Another nearby support to be aware of is 29,409, a previous Quasimodo resistance.
- H4 support at 30,633, along with January’s opening value at 30,622 and Fibonacci support around 30,578-30,610, offers robust confluence. What’s also interesting is this H4 technical support area converges with daily demand at 30,310-30,637.
- H4 Fibonacci resistance is clearly an area sellers welcomed in the past (127.2% Fibonacci projection point at 31,192/100% Fibonacci extension point at 31,291).
- A H4 breakout above 31,291 potentially fuels a bullish breakout theme to refresh all-time peaks.
XAU/USD (GOLD):
Areas of consideration:
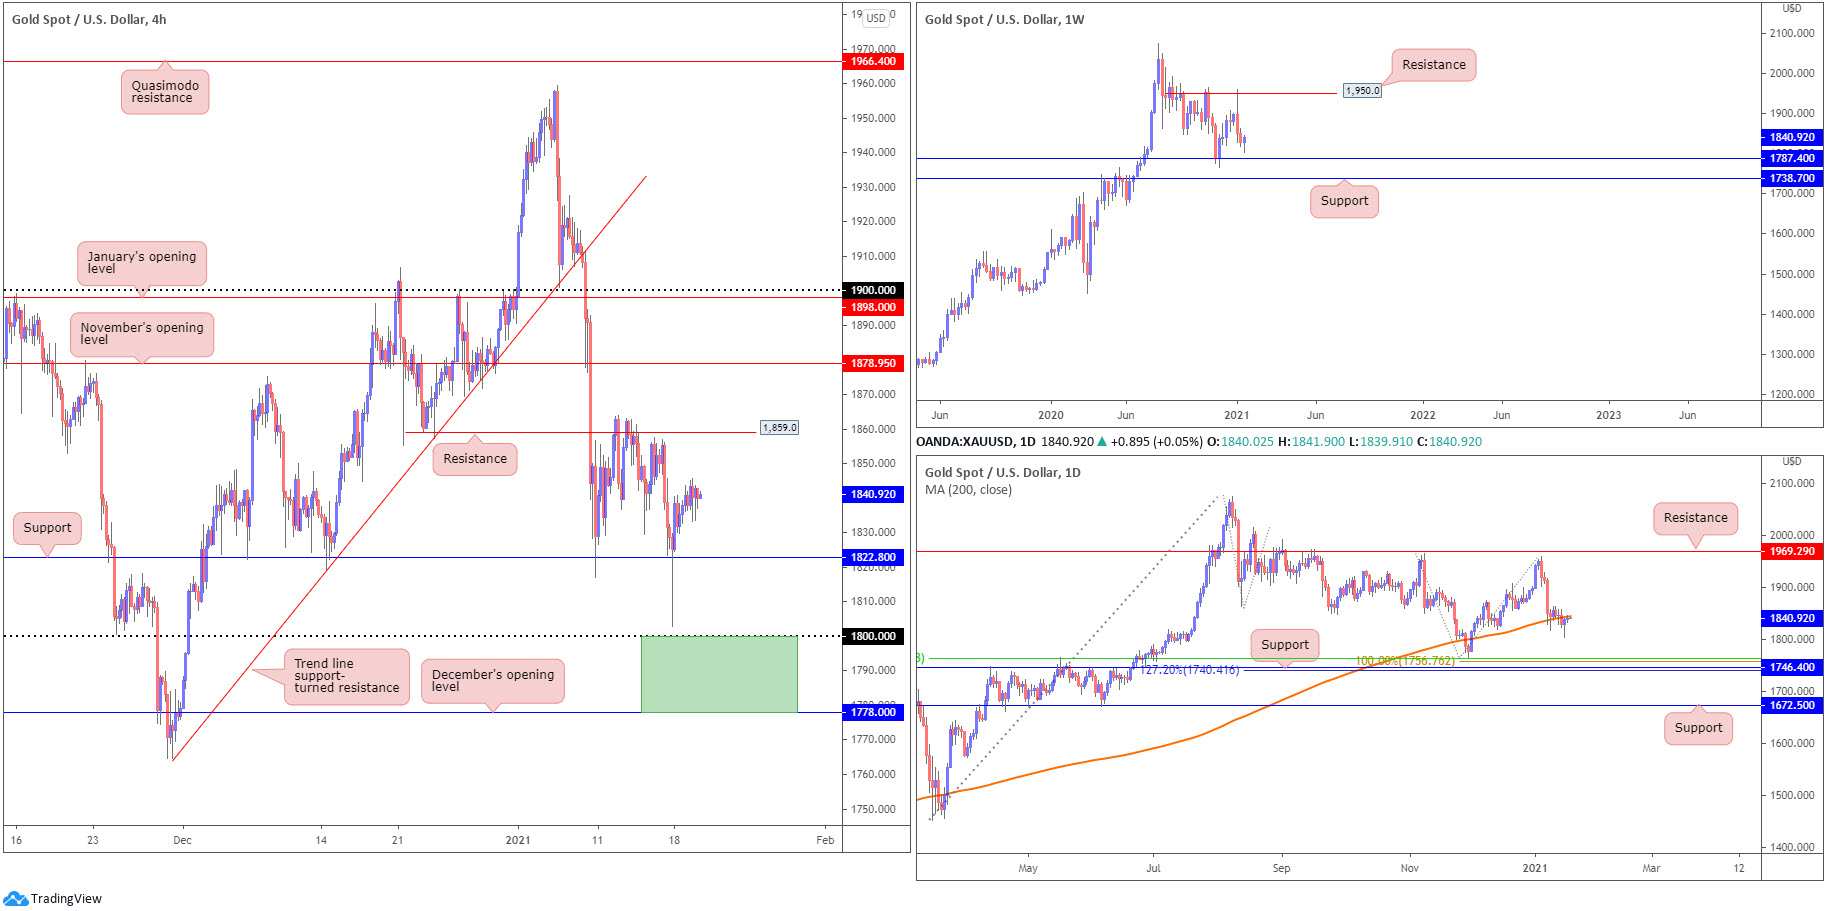
- Following the enthusiastic hammer pattern formed on the H4 timeframe earlier in the week, movement that pierced through support at $1,822, buyers have since failed to find much acceptance. Technical factors behind the lack of bullish drive are the 200-day SMA (orange – $1,843) currently serving as resistance and the absence of support on the weekly timeframe until $1,787 (set just north of another support at $1,738).
- H4 resistance at $1,859 is a level to remain aware of, having seen the base cap upside since early last week.
- H4 support at $1,822, given its history since December.
- Weekly support mentioned above at $1,787 resides between $1,800 and December’s opening value at $1,778 on the H4 scale. Therefore, the area marked on the H4 timeframe (green) between $1,778 and $1,800 is a location to be mindful of.
BTC/USD:
Areas of consideration:
- The weekly timeframe continues to circle just south of all-time peaks at $41,969, establishing a mild bearish defence from $40,000. Given the aggressive climb throughout December, support is limited until $19,891—the 2017 swing high.
- Despite weekly action finding $40,000 troublesome, the trend in this market is firmly to the upside, with daily candles in the process of establishing a clear-cut bullish pennant pattern ($30,635/$41,969)—a pattern that appears about ready to POP. Demand is also seen bolstering buyers at $28,499-$31,934.
- The H4 timeframe reveals price action is bounded between resistance at $37,977 and support at $33,878 (additional support seen in the shape of a 61.8% Fibonacci retracement ratio at $34,196). H4 Quasimodo support may also interest some traders at $30,459, having seen the level reside within daily demand mentioned above at $28,499-$31,934.

The accuracy, completeness and timeliness of the information contained on this site cannot be guaranteed. IC Markets does not warranty, guarantee or make any representations, or assume any liability regarding financial results based on the use of the information in the site.
News, views, opinions, recommendations and other information obtained from sources outside of www.icmarkets.com.au, used in this site are believed to be reliable, but we cannot guarantee their accuracy or completeness. All such information is subject to change at any time without notice. IC Markets assumes no responsibility for the content of any linked site.
The fact that such links may exist does not indicate approval or endorsement of any material contained on any linked site. IC Markets is not liable for any harm caused by the transmission, through accessing the services or information on this site, of a computer virus, or other computer code or programming device that might be used to access, delete, damage, disable, disrupt or otherwise impede in any manner, the operation of the site or of any user’s software, hardware, data or property.


