
A note on lower timeframe confirming price action…
Waiting for lower timeframe confirmation is our main tool to confirm strength within higher timeframe zones, and has really been the key to our trading success. It takes a little time to understand the subtle nuances, however, as each trade is never the same, but once you master the rhythm so to speak, you will be saved from countless unnecessary losing trades. The following is a list of what we look for:
- A break/retest of supply or demand dependent on which way you’re trading.
- A trendline break/retest.
- Buying/selling tails – essentially we look for a cluster of very obvious spikes off of lower timeframe support and resistance levels within the higher timeframe zone.
- Candlestick patterns. We tend to only stick with pin bars and engulfing bars as these have proven to be the most effective.
For us, lower timeframe confirmation starts on the M15 and finishes up on the H1, since most of our higher timeframe areas begin with the H4.
EUR/USD:
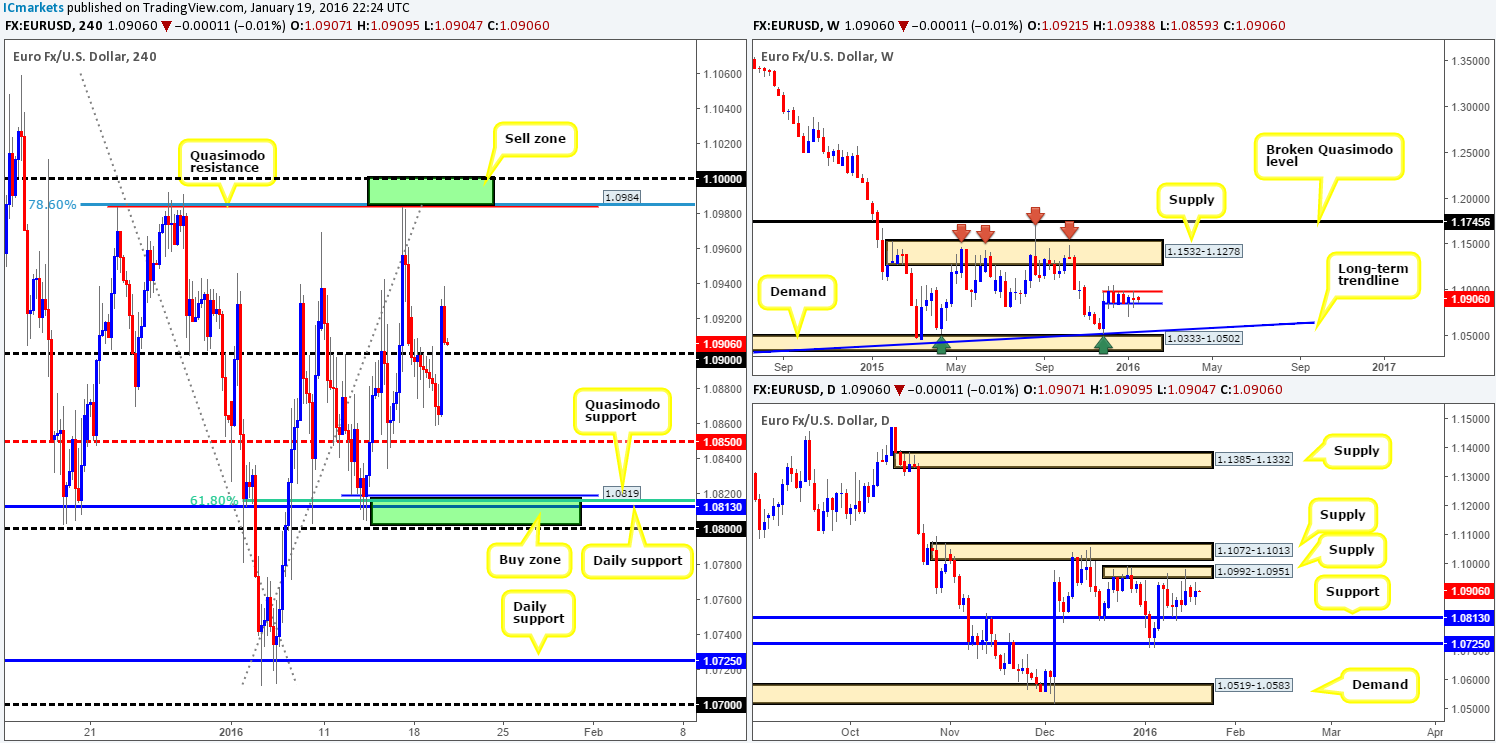
Looking from the weekly chart right down to the H4 this morning, it’s quite clear to see that the EUR has collectively entered into a phase of consolidation. The weekly range sits between 1.0983/1.0851 (blue/red lines) which has been the case since Dec 7th 2015. Down on the daily timeframe, however, trade has been confined to a supply seen at 1.0992-1.0951 and a support level drawn from 1.0813 since Jan 8th 2016.
Moving down one more level to the H4, the current consolidation is effectively the same as the daily chart, only with a few more added structures. The upper extreme of the H4 range consists of a H4 Quasimodo resistance level at 1.0984, a Fibonacci level at 1.0985, a psychological resistance barrier at 1.1000 and of course the daily supply just mentioned above at 1.0992-1.0951. The lower extreme, however, is molded by a H4 a Quasimodo support at 1.0819, a psychological support at 1.0800, a 61.8% Fibonacci support at 1.0815 and the daily support we spoke about above at 1.0813.
For those who read our analysis regularly, you may recall that we took a short on Friday from 1.0983. With the stop still at breakeven and 70% of our position already banked, we’re looking at riding the remaining 30% down to 1.0819. In yesterday’s report (http://www.icmarkets.com/blog/tuesday-19th-january-daily-technical-outlook-and-review/), we mentioned that we would consider adding to our current short position should we spot lower timeframe selling confirmation around the underside of 1.0900. There was a signal to sell around 2.45 am GMT time, which moved into nice profit before reversing. Unfortunately though, we were not around for this.
In regards to today’s trade, there’s a truck-load of data on the docket which is likely going to cause big moves. Should price hit 1.0819, nevertheless, we plan on liquidating the short position and we may, dependent on how the lower timeframes react and time of day, look to buy from this lower range extreme once again.
Levels to watch/live orders:
- Buys: 1.0819/1.0800 [Tentative – confirmation required] (Stop loss: dependent on where one confirms this area).
- Sells: 1.0983 [LIVE] (Stop loss: breakeven).
GBP/USD:
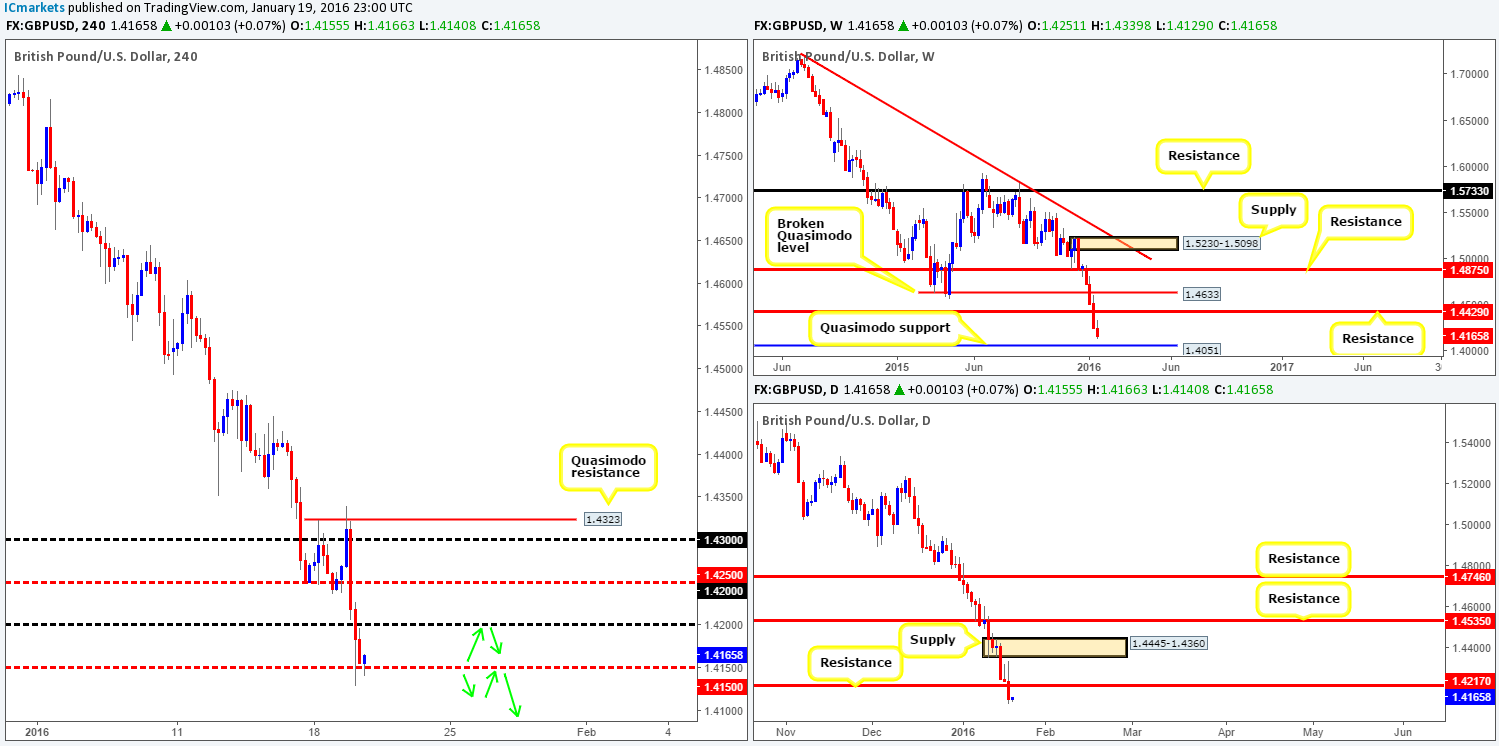
Yesterday’s trade saw Cable take yet another blow to the mid-section, losing close to 90 pips on the day (open/close). Coming from the weekly chart, this sell-off is not really surprising since (as we already noted in previous reports) there’s room for further downside to at least Quasimodo support drawn from 1.4051.
Daily action, on the other hand, recently closed below support (now resistance) coming in at 1.4217. We really hate to say it, but we see very little active support on the daily chart now until way down around the 1.3742 mark, followed closely by 1.3617. In addition to this, there is a rather large demand consumption tail that formed on the 18th March 2009 at 1.3843 – this could also suggest bid strength may be weak here!
Turning our attention to the H4, we can see that the recent sell-off came after BoE Governor Carney’s speech at around midday yesterday. This, as can be seen from the chart, saw price slice through multiple psychological supports until connecting with the mid-level number 1.4150.
Given the clear direction seen on the higher timeframe structures right now (see above in bold), buying from 1.4150 is out of the question for us. What we are interested in, however, is shorting either a retest of 1.4200 or on a break below/retest of 1.4150 as per the green arrows (lower timeframe confirmation required in both instances).
Levels to watch/live orders:
- Buys: Flat (Stop loss: N/A).
- Sells: 1.4200 [Tentative – confirmation required] (Stop loss: dependent on where one confirms this level). Watch for bids to be consumed around 1.4150 and then look to trade any retest seen thereafter (lower timeframe confirmation required).
AUD/USD:
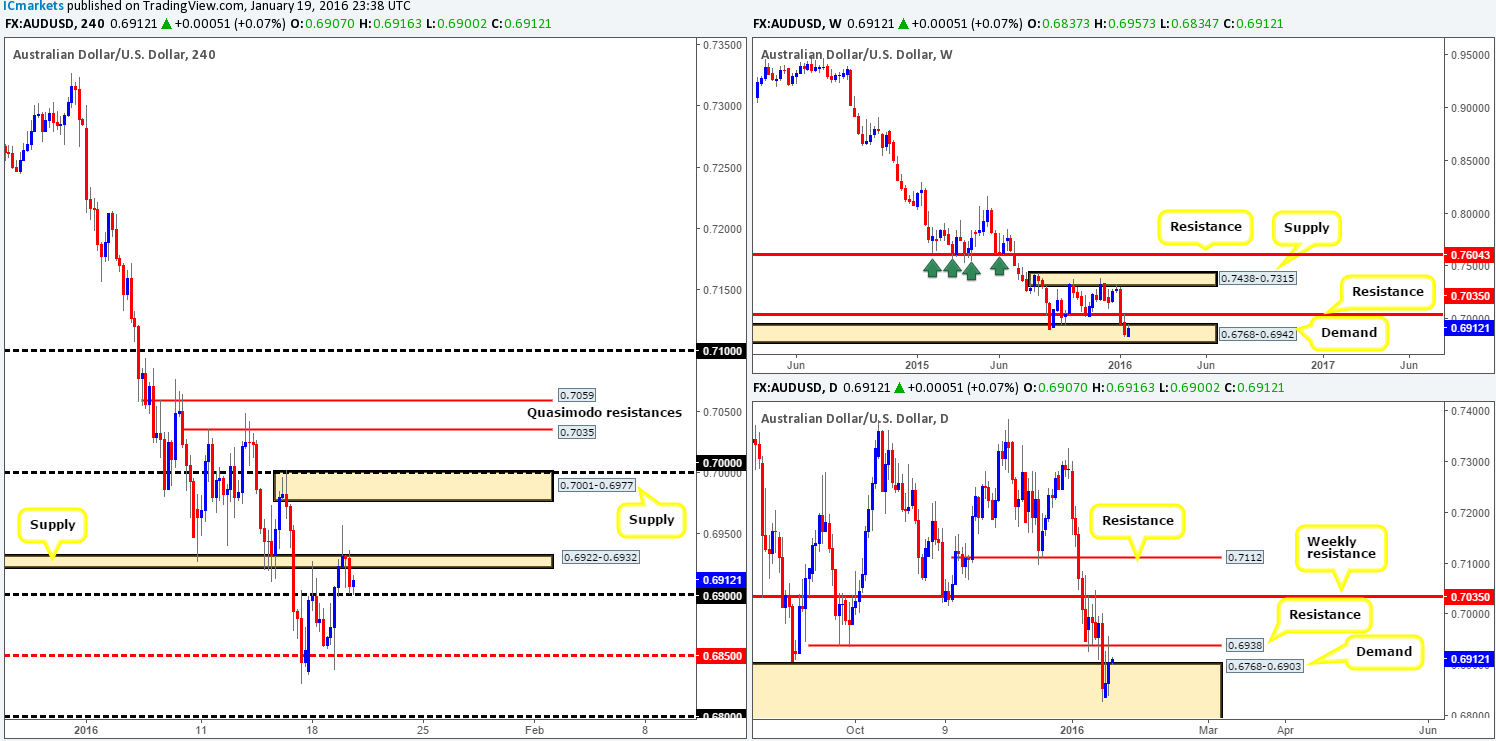
In our previous report (http://www.icmarkets.com/blog/tuesday-19th-january-daily-technical-outlook-and-review/), we mentioned that owning to price currently residing within both weekly/daily demands (0.6768-0.6942/ 0.6768-0.6903) at the moment, mid-level support 0.6850 could be a potential buy zone. As shown on the H4 chart the Aussie bounced beautifully from this number, pushing this pair above psychological resistance 0.6900 and supply at 0.6922-0.6932, reaching highs of 0.6957 on the day. Well done to any of our readers who managed to lock in some green pips from this move!
With the current H4 supply likely out of the picture and price seen successfully holding ground at 0.6900, is it time to begin loading up on longs again? Well, looking at the weekly chart, longs are possible since resistance does not come into effect until around the 0.7035 region. Down on the daily chart, nevertheless, price recently bounced from the underside of resistance at 0.6938. Therefore, to long this market, we’d need to see a convincing close above the current H4 supply, which, as you can probably see, would also close price above the aforementioned daily resistance at the same time.
Following a close higher, we’d need to see a retrace back to either the H4 supply (which would be demand at that point) or 0.6900 to enter long with a target objective seen at H4 supply drawn from 0.7001-0.6977. Buying at these areas without waiting for confirmation is a little too risky for our liking since fakeouts are common occurrence around psychological boundaries. As such, buying strength would need to formulate from the lower timeframes before capital is committed to this idea.
Levels to watch/live orders:
- Buys: Watch for a close above H4 supply at 0.6922-0.6932 and look to trade any retest seen thereafter (lower timeframe confirmation required).
- Sells: Flat (Stop loss: N/A).
USD/JPY:
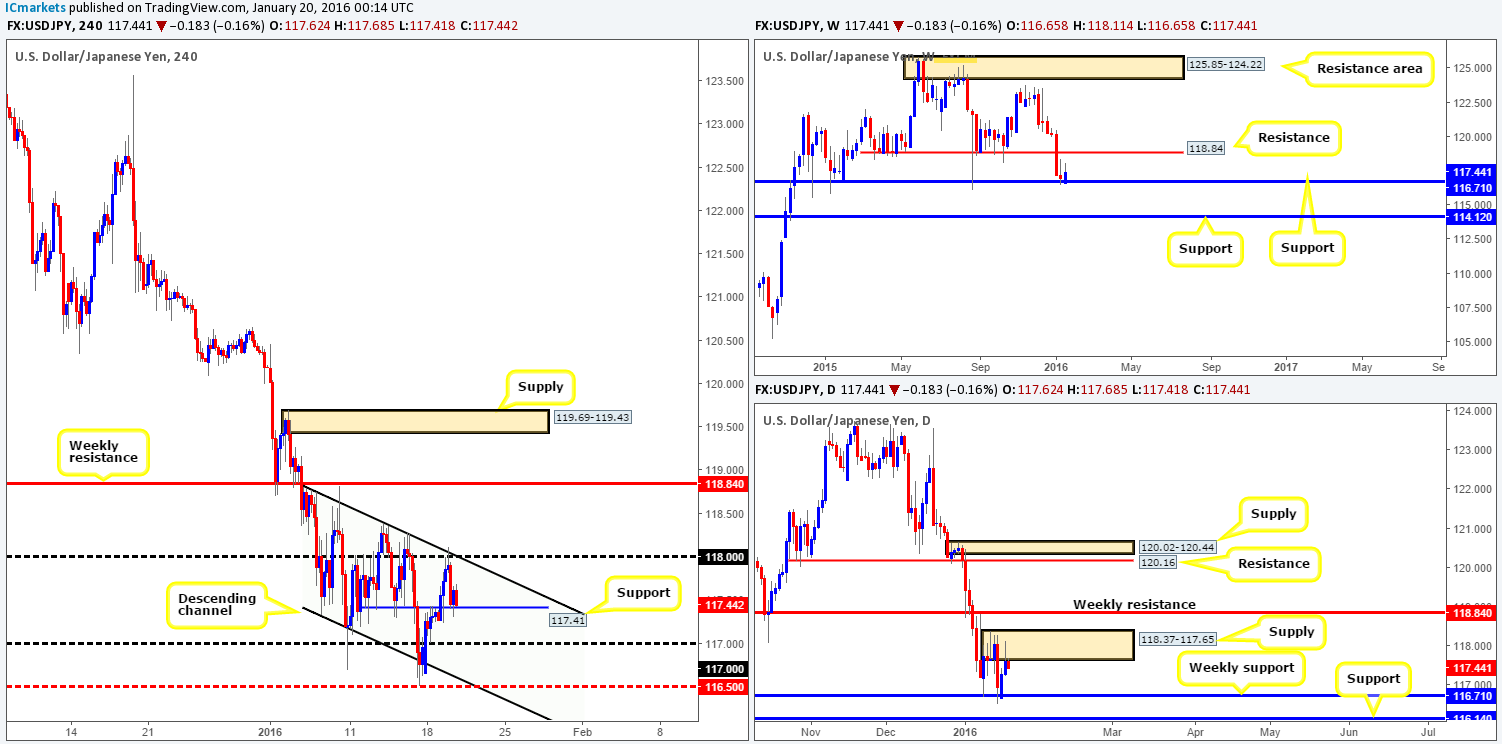
Mid-way through yesterday’s London session, the USD/JPY rebounded beautifully from the psychological resistance level 118.00. This was a noted sell zone in our previous report due to it fusing with both a H4 channel resistance line extended from the high 118.81 and daily supply at 118.37-117.65. The sell-off from this number drove price into H4 support at 117.41 which can be seen holding firm for the time being.
Given the above points, buying from the current H4 support, even with the weekly chart showing price trading from support at 116.71, is too risky with daily supply looming above. To that end, today’s plan of attack will consist of waiting to see if price can break above and retest 118.00 as support. This would, as far as we see, consume the majority of offers residing within the current daily supply and open up the gates for prices to challenge the weekly resistance level, since there’s little active supply seen on the H4 timeframe above 118.00.
Should this come to fruition and lower timeframe buying confirmation is seen following the retest, we would look to jump in long here targeting the weekly resistance.
Levels to watch/live orders:
- Buys: Watch for offers to be consumed around 118.00 and look to trade the any retest seen thereafter (lower timeframe confirmation required).
- Sells: Flat (Stop loss: N/A).
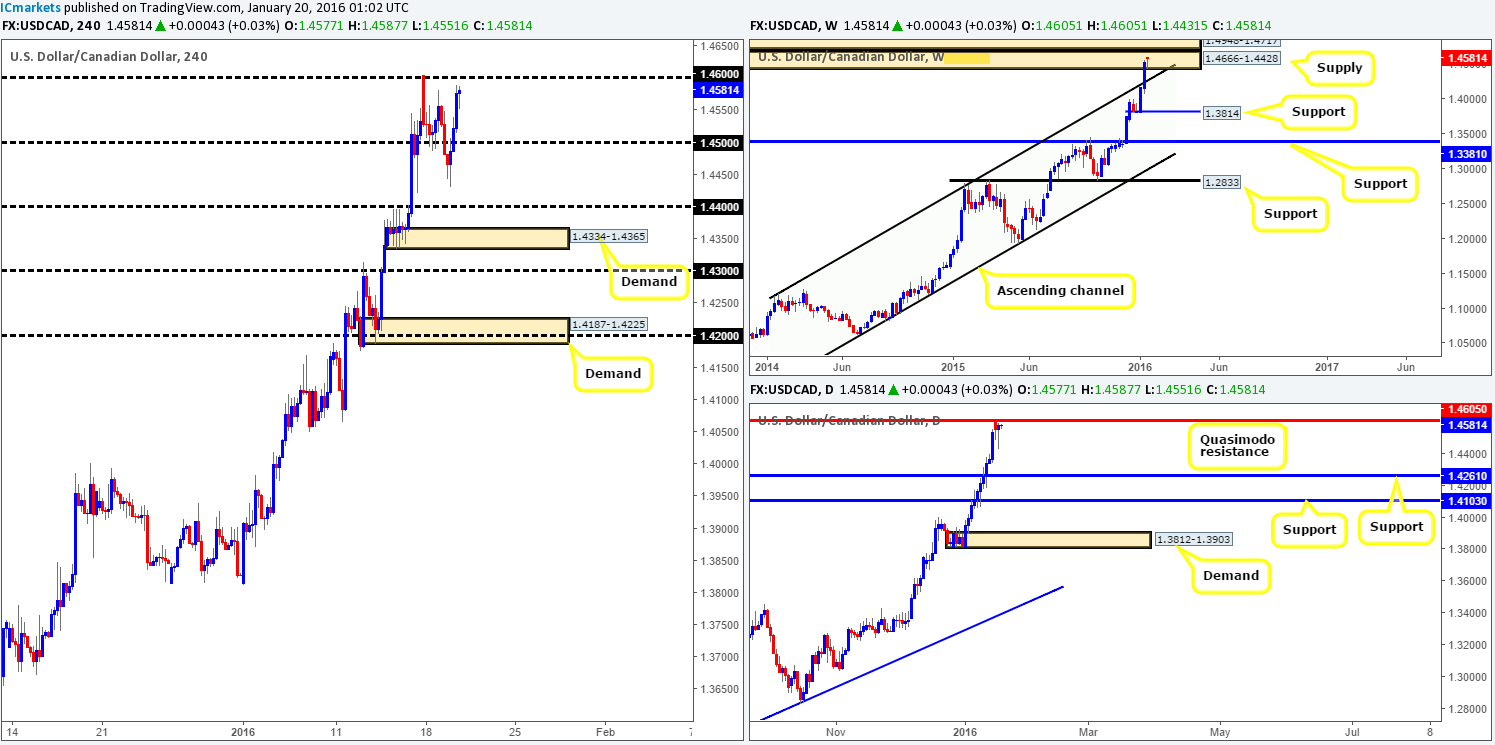
USD/CAD:
Starting from the top this morning, weekly action shows that the sellers have been struggling to find their footing within supply seen at 1.4666-1.4428. In the event that this continues, we may see prices break above and connect with supply drawn from 1.4948-1.4717. Although it appears the current weekly supply zone is weakening, the daily chart reveals that the Quasimodo resistance level at 1.4605 remains in place for the time being.
From the H4 timeframe, however, we can see that the Loonie jumped back into buy mode yesterday from lows of 1.4431, following a pullback from psychological resistance 1.4600 at the beginning of the week. This will likely be an interesting day for this pair as the Bank of Canada takes center stage at 3pm GMT to discuss bank rates.
Technically, however, 1.4600 will be a key level for us going into today’s trade. A rejection of this number could once again send prices back down to the 1.4500 mark, whereas a break above could be early signs that the current weekly supply and daily Quasimodo resistance is out for the count. With the trend on the USD/CAD still riding strong, selling from 1.4600 does not appeal to us even with the current higher timeframe structures in place (see above). What we would be interested in though is playing for a (confirmed) trade on a break above and retest of 1.4600. However, let’s see what comes of the BoC meeting today before making any further decisions…
Levels to watch/live orders:
- Buys: Watch for offers to be consumed around 1.4600 and look to trade any retest of this number thereafter (lower timeframe confirmation required).
- Sells: Flat (Stop loss: N/A
USD/CHF:
Despite yesterday’s selling from around the 1.0080 mark, the pair remains trading within a H4 consolidation formed from 0.9931/0.9900 and 1.0123/0.0100. As we mentioned in yesterday’s report, any level seen within this range is considered, at least by us, to be mid-range. In other words, a barrier we believe only to be good enough for a bounce at best rather than a medium-term swing. With that being the case, our original outlook continues to be our plan of attack – only take trades at the extremes of the current range:
For buys, we’re looking at between 0.9931/0.9900. Notice that this range support molds together with both the weekly and daily support structures seen at 0.9796-0.9902/0.9851-0.9926. We would still require a trade to be confirmed here due to the possibility that price may fake lower beyond 0.9900.
For sells, however, the 1.0123/0.0100 is the zone to watch. Not only does this area boast a 61.8% Fibonacci level at 1.0122, but within the range itself there appears to be a H4 Harmonic AB=CD bearish pattern setting up which completes nicely around the extremes of our sell zone. Should the AB=CD pattern remain symmetrical on approach, we would, dependent on the time of day, look to short this beauty at market with our stop placed fifteen pips above 1.0123. This not only gives the trade room to breathe but will also likely avoid any whipsaws through the area.

Levels to watch/live orders:
- Buys: 0.9900/0.9931 region [Tentative – confirmation preferred] (Stop loss: dependent on where one confirms this area).
- Sells: 1.0100/1.0123 region [If the AB=CD bearish pattern remains symmetrical on approach, a short at market is permitted] (Stop loss: around 1.0138).
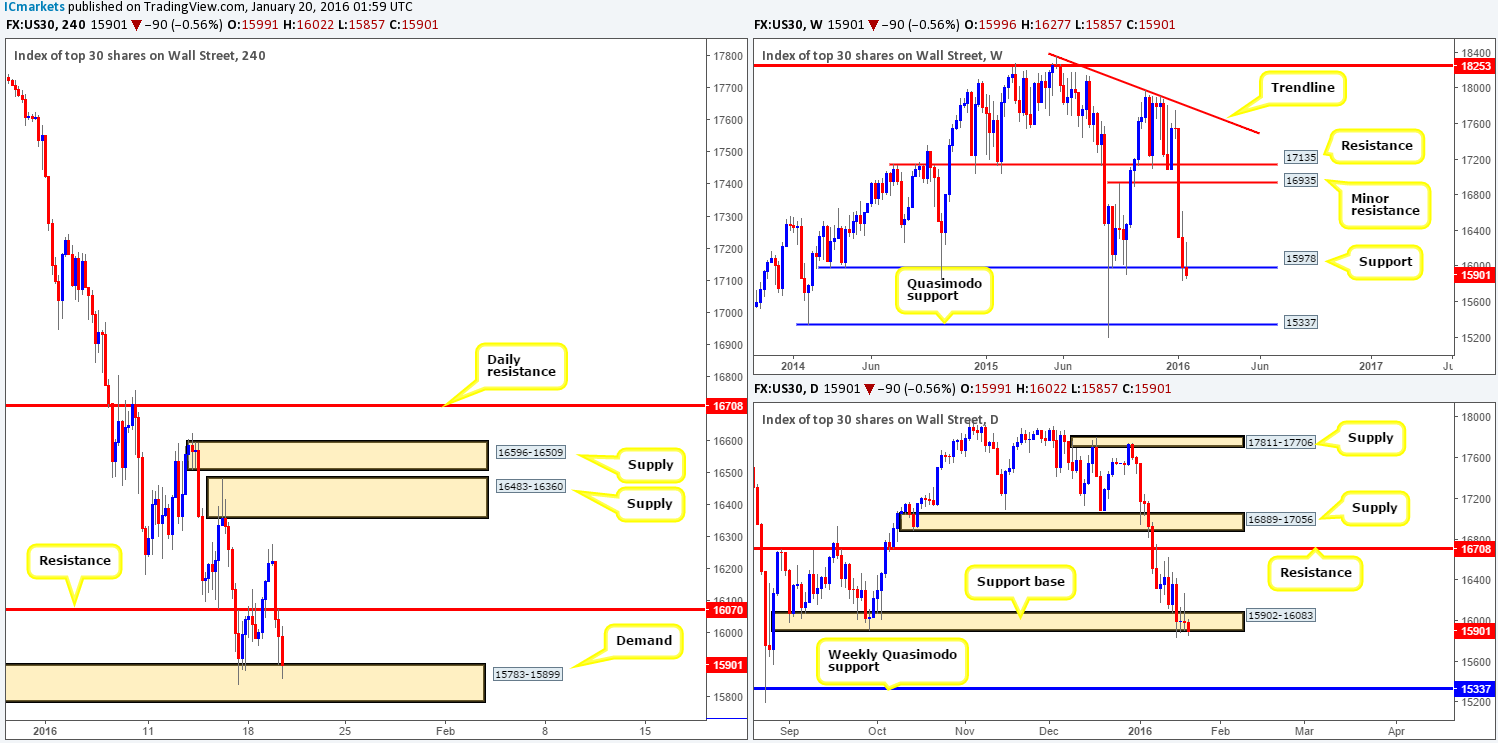
DOW 30:
This morning’s analysis will kick-off with a look at the weekly timeframe which shows that the buyers are struggling to defend support drawn from 15978. Supposing that bids are wiped out from this region, the next area to watch falls in at a Quasimodo support level seen at 15337.
Scrolling down to the daily timeframe, the support base visible at 15902-16083 also looks as though it’s fragile with buyers showing very little interest from here at the moment. Much the same as the weekly picture, a break below here could encourage further selling down to the above said weekly Quasimodo support.
Zooming in and looking at the H4 timeframe, nevertheless, demand at 15783-15899 is still in the game! Initially, we did report that following a close above resistance at 16070 and retrace back to this demand, we would enter long at market here. However, with the weekly candle looking scarily bearish right now and the daily support base showing signs of weakness, doubt has set in resulting in us passing on this trade opportunity.
Going forward, we do not intend on looking to trade this instrument today, but what we will say is if the current H4 demand does indeed give way, then other than a H4 support seen below at 15709, there’s very little stopping this index from dropping down to the weekly Quasimodo support mentioned above at 15337. Therefore, a break below and retest of the H4 support would be a beautiful short setup should it come to fruition.
Levels to watch/live orders:
- Buys: Flat (Stop loss: N/A).
- Sells: Flat (Stop loss: N/A).
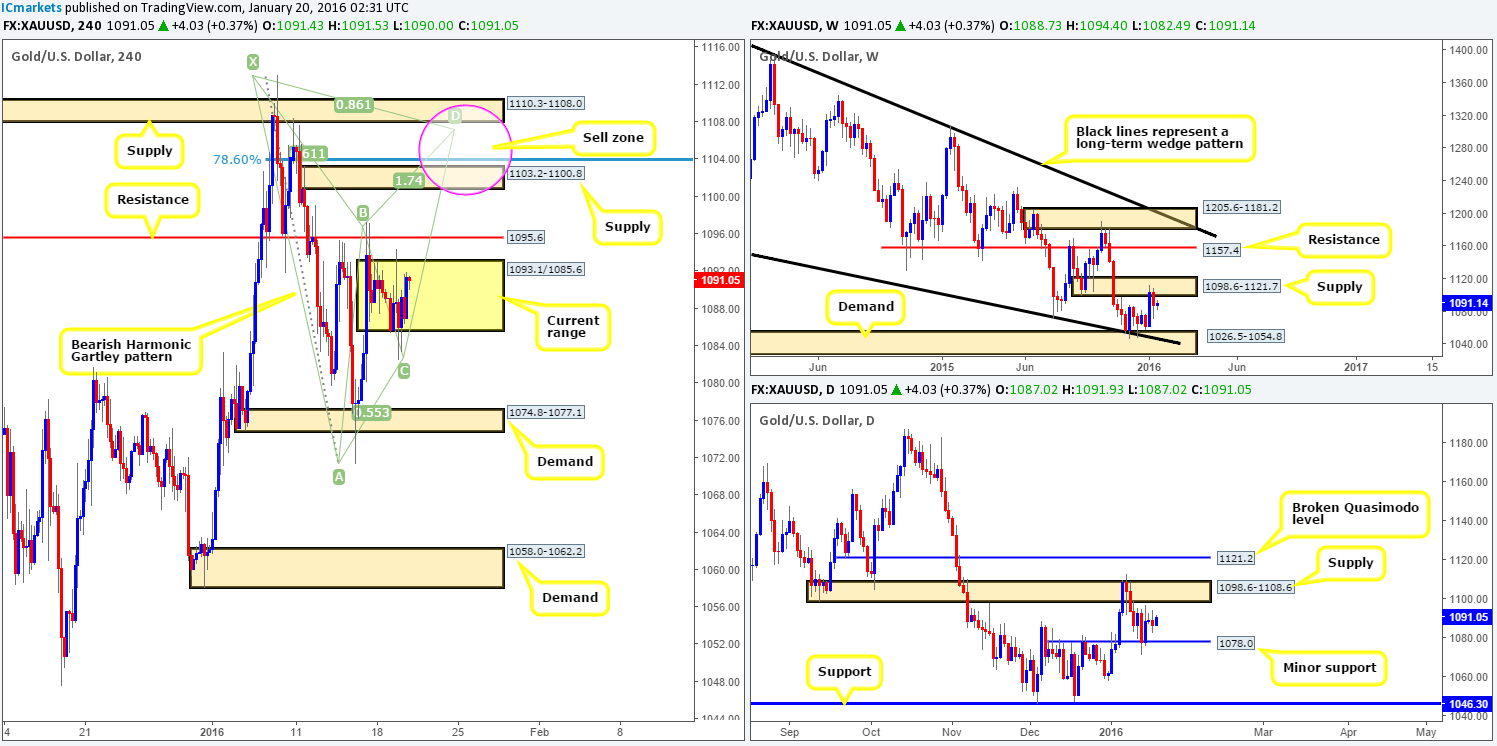
XAU/USD: (Gold)
Despite Friday’s advance north Gold has seen very little action coming into this week, with price appearing to carve out a range between 1093.1/1085.6. Consequent to this somewhat lackluster trading, much of yesterday’s outlook still holds weight going into today’s sessions.
With weekly supply at 1098.6-1121.7 providing a technical ceiling for this market at the moment and daily action showing room to dive lower down to at least support seen at 1078.9, this is still a sellers’ market in our opinion. With that being said, we have our eye on two zones today:
- The area between the range resistance at 1093.1 and resistance above at 1095.6. This small, but albeit significant area, has fakeout written all over it so it is certainly somewhere we’d consider selling should the lower timeframes agree (confirmation needed).
- The second area falls in a little higher on the curve – the H4 supply above at 1103.2-1100.8. Not only is this area sitting deep within both the weekly supply at 1098.6-1121.7 and daily supply at 1098.6-1108.6, it also boasts a potential reversal zone derived from a bearish Harmonic Gartley pattern. As we all know, a Gartley pattern is only invalidated if the X point is breached, therefore, our sell zone will not just comprise of the H4 supply mentioned above, it will also include the H4 supply above it at 1110.3-1108.0. Stops, of course, would be best placed above the X point whether you enter at market or wait for the lower timeframes to confirm selling strength exists.
Levels to watch/live orders:
- Buys: Flat (Stop loss: N/A).
- Sells: 1095.6/1093.1 region [Tentative – confirmation required] (Stop loss: dependent on where one confirms this area). 1100.8/1113.0 [Tentative – confirmation required] (Stop loss: 1113.5 area).


