
DXY:
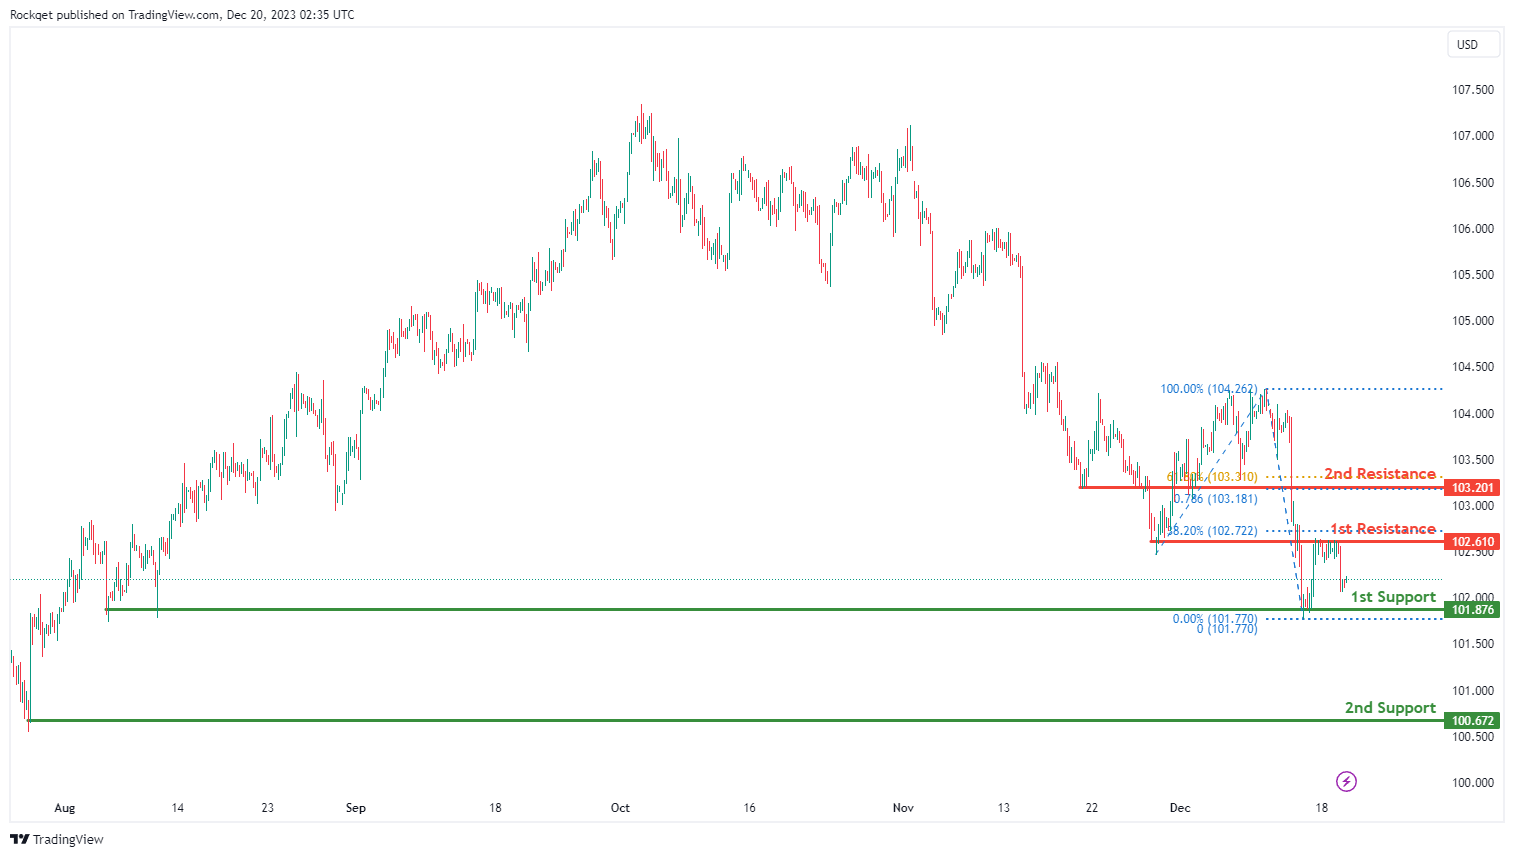
The DXY (US Dollar Index) chart currently shows an overall bearish momentum, indicating a potential for price to make a bearish continuation towards the 1st support.
The 1st support level at 101.87 is identified as a multi-swing-low support. Further below, the 2nd support level at 100.67 is noted as a swing-low, further reinforcing its importance as a potential key support level.
To the upside, the 1st resistance level at 102.61 is identified as an overlap resistance that aligns close to the 38.20% Fibonacci retracement level. Higher up, the 2nd resistance level at 103.20 is also marked as an overlap resistance that aligns with a confluence of Fibonacci levels i.e. the 61.80% retracement and the 78.60% projection levels, suggesting a potential barrier for further upside movement.
EUR/USD:
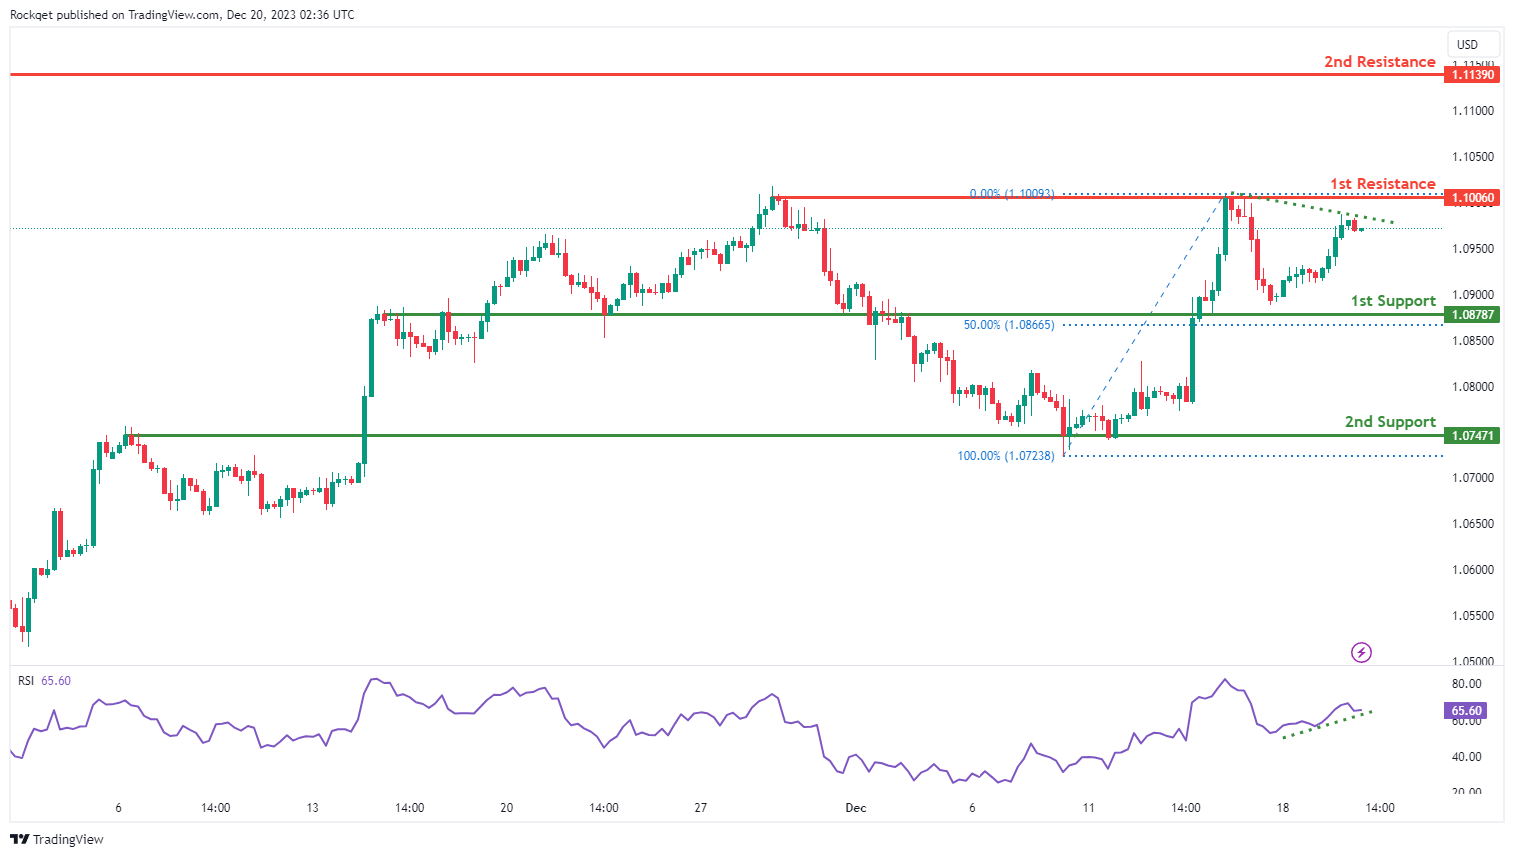
The EUR/USD chart currently exhibits an overall bullish momentum. In this context, there is a potential scenario for price to make a bullish continuation towards the 1st resistance. Additionally, the Relative Strength Indicator (RSI) is also demonstrating a bullish divergence versus price, suggesting a potential for a continued bullish momentum.
The 1st resistance level at 1.1006 is identified as a multi-swing-high resistance. Higher up, the 2nd resistance level at 1.1139 is noted as a swing-high resistance, suggesting a potential barrier for further upside movement.
To the downside, the 1st support level at 1.0878 is identified as an overlap support that aligns close to the 50.00% Fibonacci retracement level. Further below, the 2nd support level at 1.0747 is also marked as an overlap support, further reinforcing its importance as a potential key support level.
EUR/JPY:
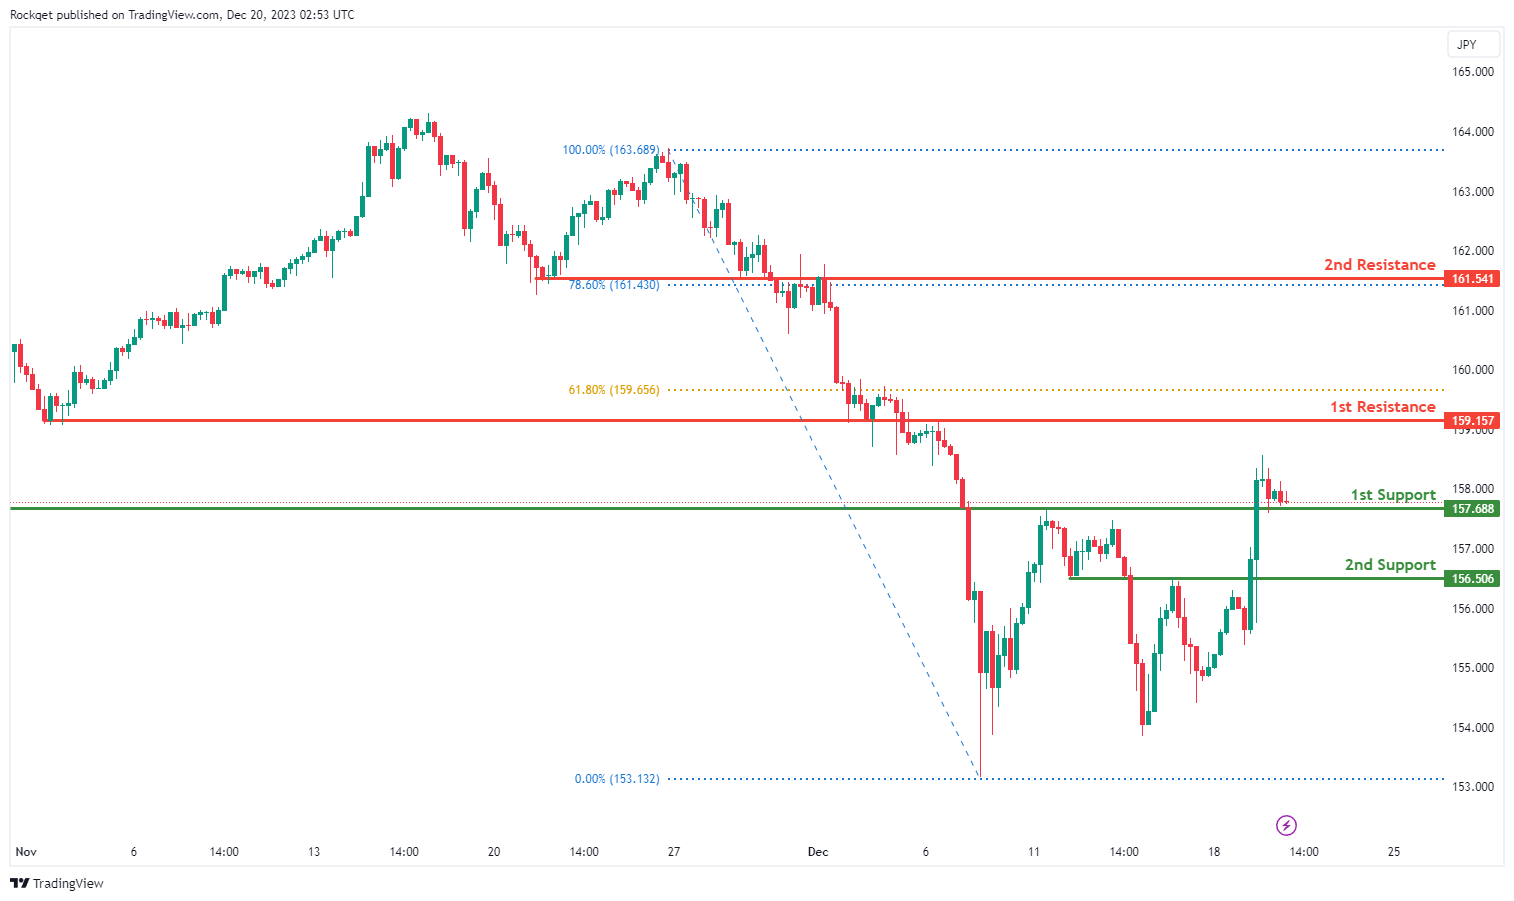
The EUR/JPY chart currently exhibits a bullish overall momentum, suggesting a potential scenario for a short-term drop to the 1st support before bouncing and rising to the 1st resistance.
The 1st support at 157.69 is considered significant as it represents a pullback support. This level indicates a historical area where buying interest has been present, reinforcing its potential as a crucial support zone.
Similarly, the 2nd support at 156.51 is identified as another pullback support, providing an additional layer of potential support for the currency pair.
On the resistance side, the 1st resistance at 159.16 is associated with a pullback resistance and coincides with the 61.80% Fibonacci Retracement level. This level may act as a barrier where selling interest could intensify, potentially causing a temporary pause or reversal in the bullish trend.
Furthermore, the 2nd resistance at 161.54 is characterized as an overlap resistance and aligns with the 78.60% Fibonacci Retracement level, suggesting increased resistance in this area.
EUR/GBP:
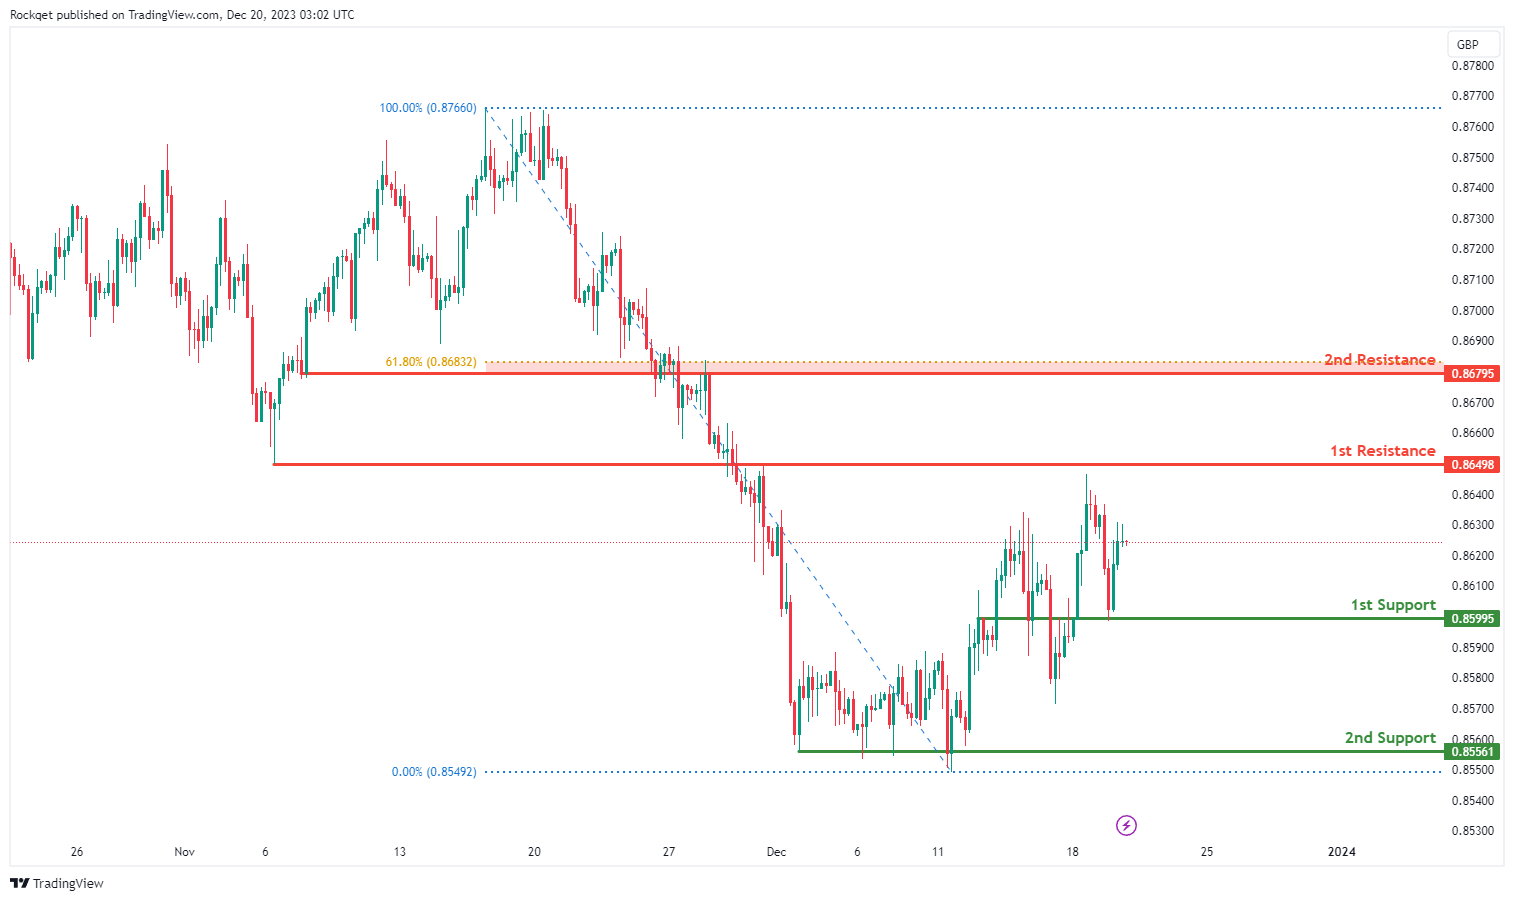
The EUR/GBP chart currently has a bearish overall momentum, indicating a potential scenario for a bearish continuation towards the 1st support.
The 1st support at 0.8600 is considered significant as it represents an overlap support. This level indicates a historical area where buying interest has been present, reinforcing its potential as a crucial support zone.
Similarly, the 2nd support at 0.8556 is identified as a multi-swing low support, providing an additional layer of potential support for the currency pair.
On the resistance side, the 1st resistance at 0.8650 is associated with an overlap resistance, suggesting an area where selling interest could intensify, potentially causing a temporary pause or reversal in the bearish trend.
Additionally, the 2nd resistance at 0.8680 is characterized as an overlap resistance and aligns with the 61.80% Fibonacci Retracement level, suggesting increased resistance in this area.
GBP/USD:
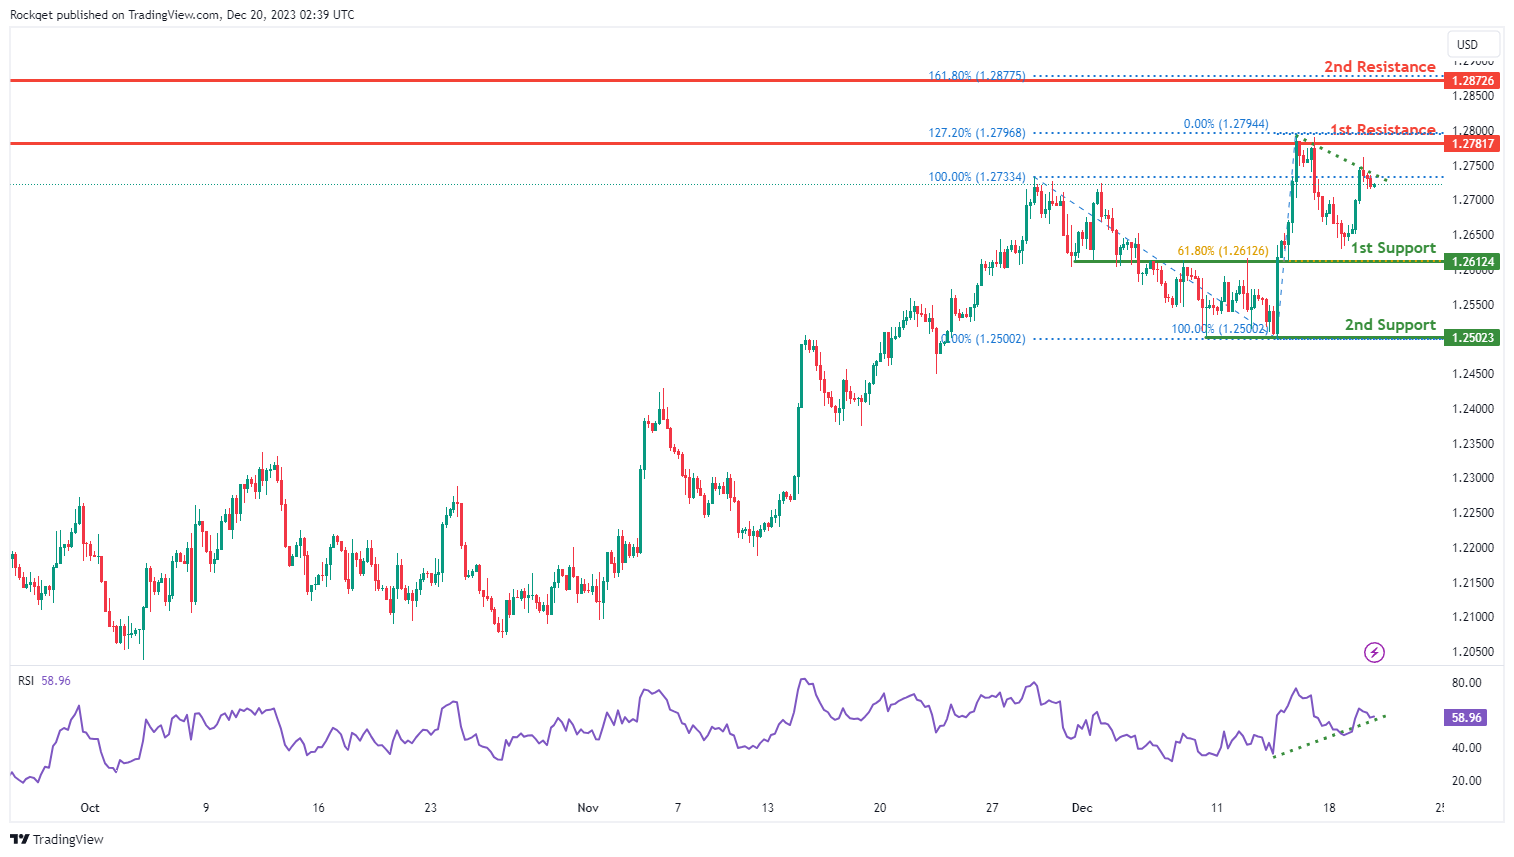
The GBP/USD chart currently exhibits an overall bullish momentum. In this context, there is a potential scenario for price to make a bullish continuation towards the 1st resistance. Additionally, the Relative Strength Indicator (RSI) is also demonstrating a bullish divergence versus price, suggesting a potential for a continued bullish momentum.
The 1st resistance level at 1.2781 is identified as a multi-swing-high resistance that aligns with the 127.20% Fibonacci extension level. Higher up, the 2nd resistance level at 1.2872 is noted as a pullback resistance that aligns with the 161.80% Fibonacci extension level, suggesting a potential barrier for further upside movement.
To the downside, the 1st support level at 1.2612 is identified as an overlap support that aligns with the 61.80% Fibonacci retracement level. Further below, the 2nd support level at 1.2502 is marked as a swing-low support, further reinforcing its importance as a potential key support level.
GBP/JPY:
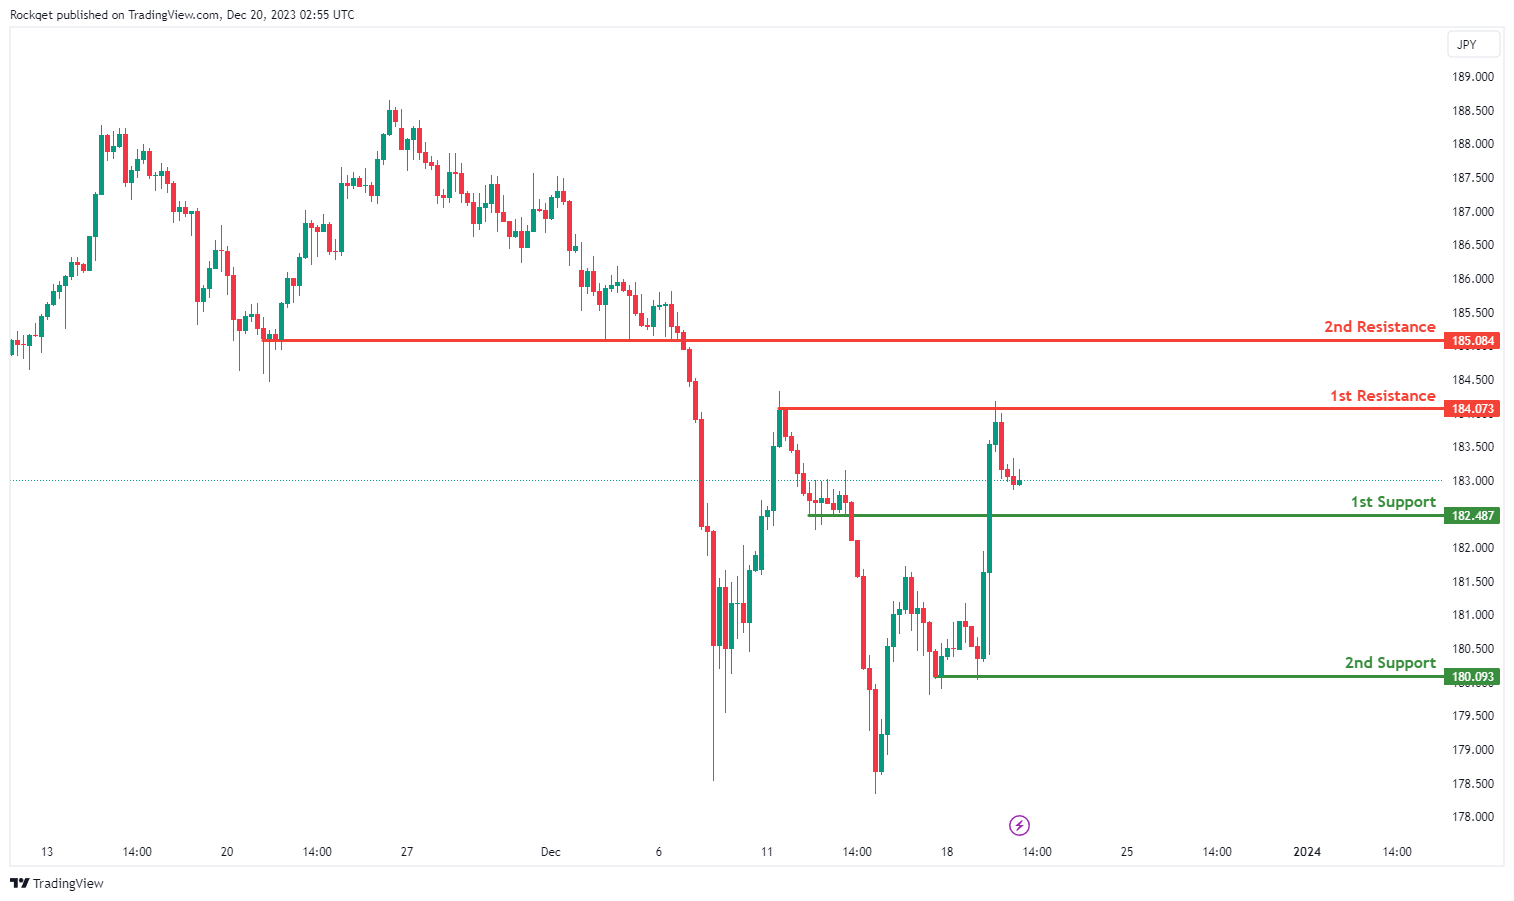
The GBP/JPY chart currently exhibits a weak bearish overall momentum with low confidence, suggesting a potential scenario for a bearish continuation towards the 1st support.
The 1st support at 182.49 is considered significant as it represents a pullback support. This level indicates a historical area where buying interest has been present, reinforcing its potential as a crucial support zone.
Similarly, the 2nd support at 176.40 is identified as a pullback support, providing an additional layer of potential support for the currency pair.
On the resistance side, the 1st resistance at 184.07 is associated with a multi-swing high resistance, suggesting an area where selling interest could intensify, potentially causing a temporary pause or reversal in the bearish trend.
Additionally, the 2nd resistance at 185.08 is characterized as a pullback resistance, adding another layer of potential resistance in the vicinity.
USD/CHF:
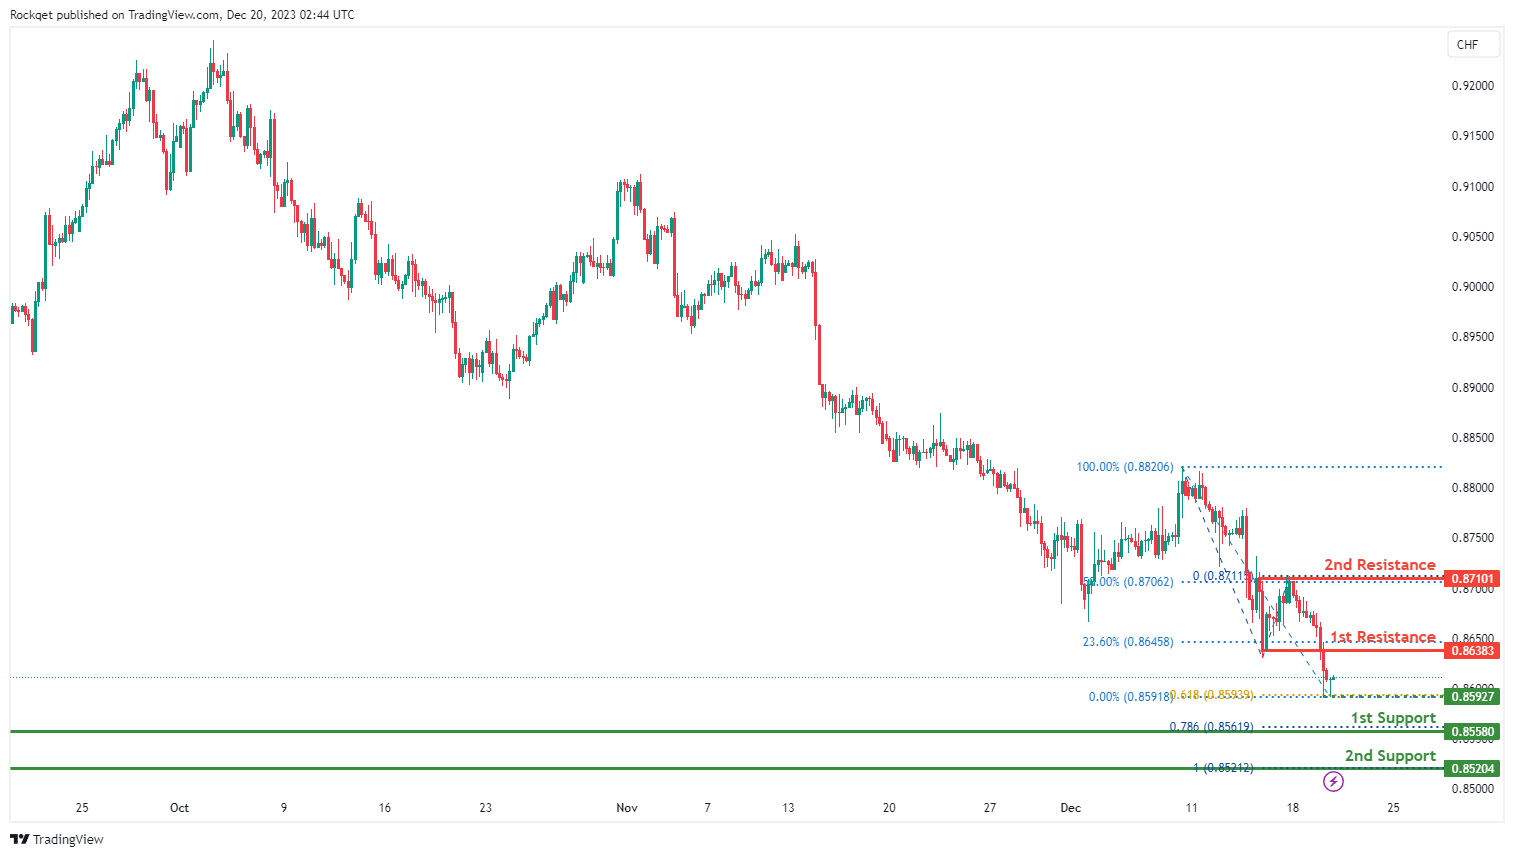
The USD/CHF chart currently exhibits an overall bearish momentum. In this context, there is a potential scenario for price to make a bearish continuation towards the 1st support.
The intermediate support level at 0.8592 is identified as a pullback support that aligns with the 61.80% Fibonacci projection level while the 1st support level at 0.8558 is marked as a multi-swing-low support that aligns with the 78.60% Fibonacci projection level. Further below, the 2nd support level at 0.8520 is noted as a swing-low support that aligns with the 100.00% Fibonacci projection level, further reinforcing its importance as a key support level.
To the upside, the 1st resistance level at 0.8638 is identified as a pullback resistance that aligns with the 23.60% Fibonacci retracement level. Higher up, the 2nd resistance level at 0.8710 is also marked as a pullback resistance that aligns with the 50.00% Fibonacci retracement level, suggesting a potential barrier for further upside movement.
USD/JPY:
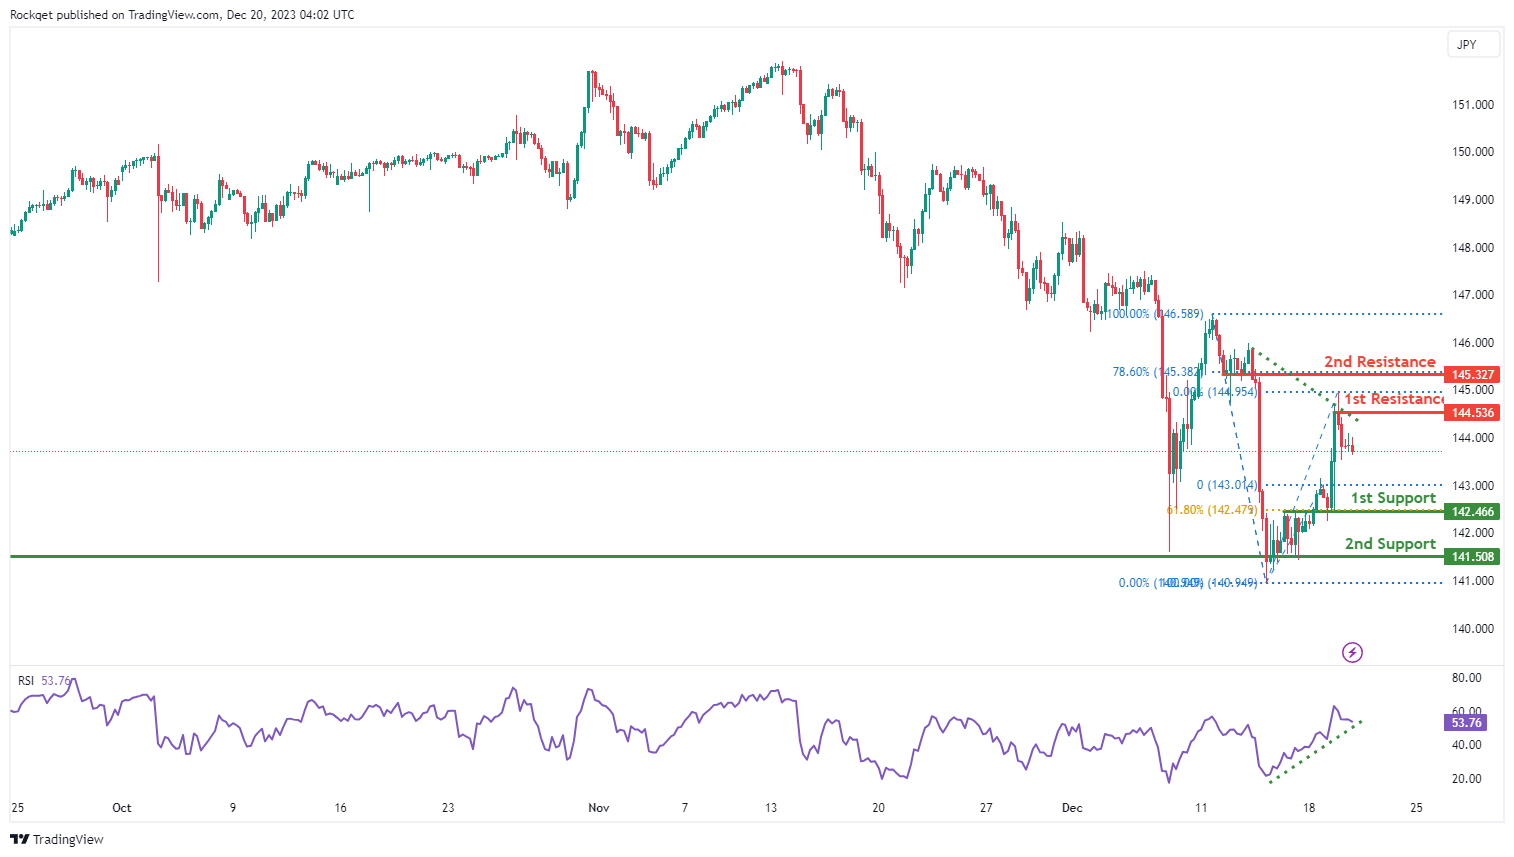
The USD/JPY chart currently exhibits an overall bullish momentum, indicating a potential for price to make a bullish continuation towards the 1st resistance. Additionally, the Relative Strength Indicator (RSI) is also demonstrating a bullish divergence versus price, suggesting a potential for a continued bullish momentum.
The 1st resistance level at 144.53 is identified as a pullback resistance. Higher up, the 2nd resistance level at 145.32 is also marked as a pullback resistance that aligns with the 78.60% Fibonacci retracement level, suggesting a potential barrier for further upside movement.
To the downside, the 1st support level at 142.46 is identified as an overlap support that aligns with the 61.80% Fibonacci retracement level. Further below, the 2nd support level at 141.50 is noted as a multi-swing-low support, further reinforcing its importance as a key support level.
USD/CAD:
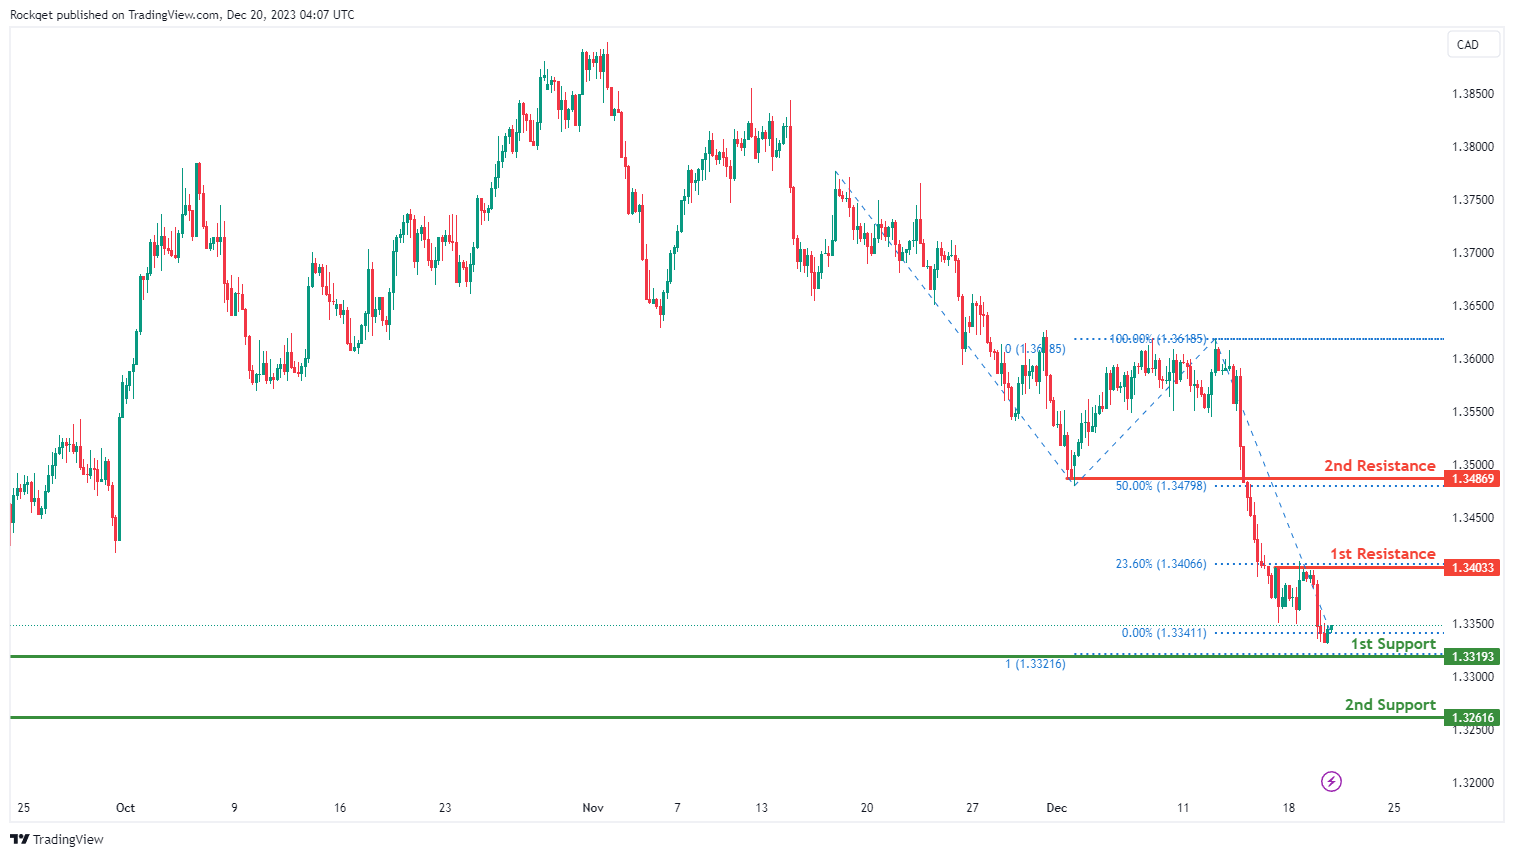
The USD/CAD chart currently exhibits an overall bearish momentum, indicating a potential for a drop towards the 1st support.
The 1st support level at 1.3319 is identified as a pullback support that aligns with the 100.00% Fibonacci projection level. Further below, the 2nd support level at 1.3261 is noted as an overlap support, further reinforcing its importance as a key support level.
To the upside, the 1st resistance level at 1.3403 is identified as a pullback resistance that aligns with the 23.60% Fibonacci retracement level. Higher up, the 2nd resistance level at 1.3486 is also marked as a pullback resistance that aligns with the 50.00% Fibonacci retracement level, suggesting a potential barrier for further upside movement.
AUD/USD:
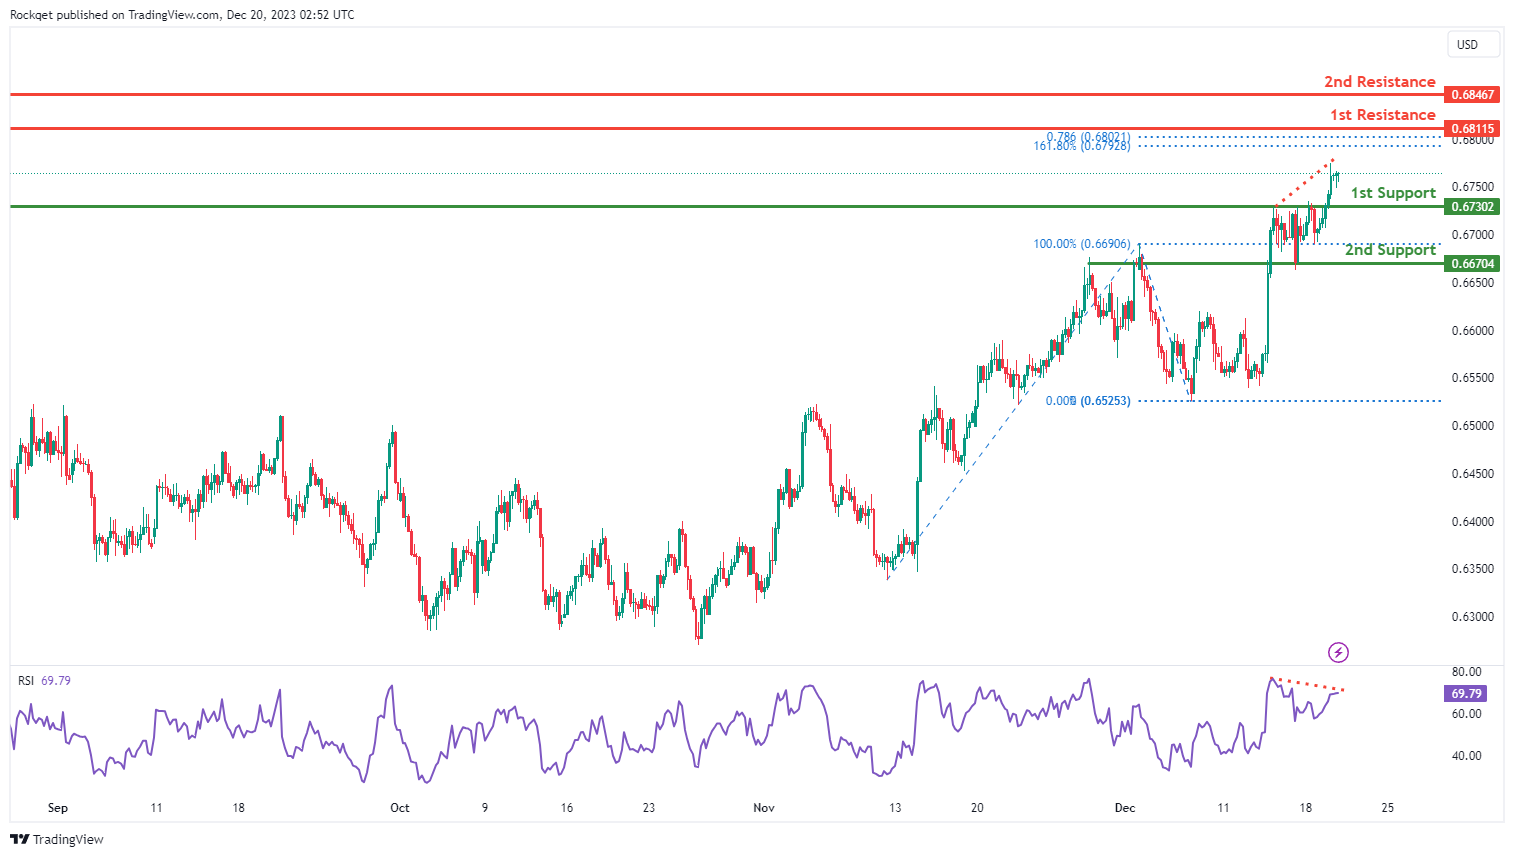
The AUD/USD chart currently exhibits an overall bullish momentum. In this context, there is a potential scenario for price to make a bullish continuation towards the 1st resistance. However, the Relative Strength Indicator (RSI) is also demonstrating a bearish divergence versus price, suggesting a potential for a bearish reversal.
The 1st resistance level at 0.6811 is identified as a swing-high resistance that aligns with a confluence of Fibonacci levels i.e. the 161.80% extension and the 78.60% projection levels. Higher up, the 2nd resistance level at 0.6846 is also noted as a swing-high resistance, indicating its potential significance as a barrier for further upward movement.
To the downside, the 1st support level at 0.6730 is identified as an overlap support. Further below, the 2nd support level at 0.6670 is also marked as an overlap, further reinforcing its importance as a key support level.
NZD/USD
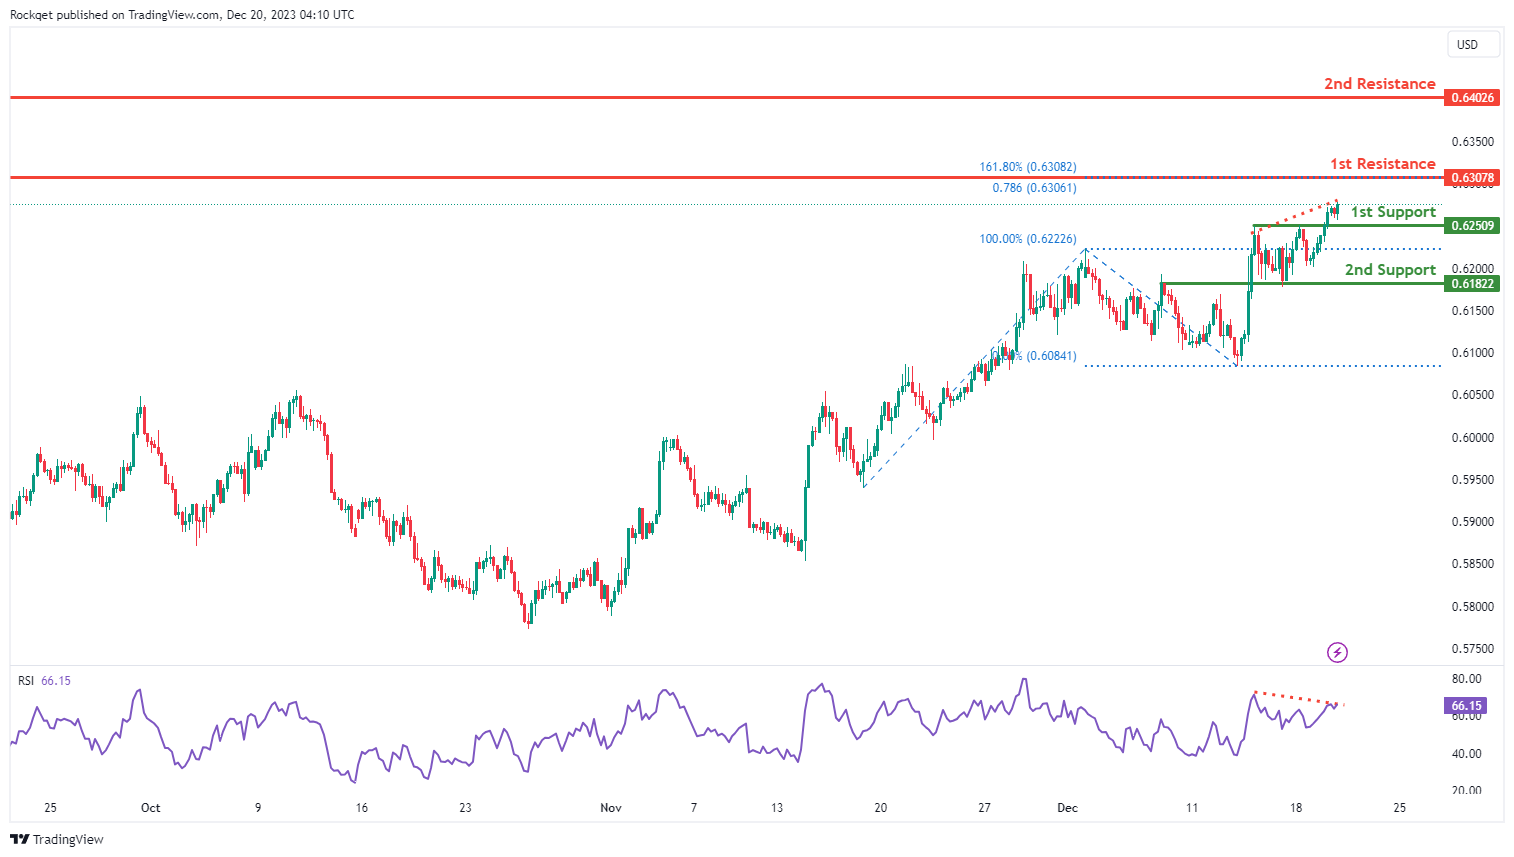
The NZD/USD chart currently exhibits an overall bullish momentum. In this context, there is a potential scenario for price to make a bullish continuation towards the 1st resistance. However, the Relative Strength Indicator (RSI) is also demonstrating a bearish divergence versus price, suggesting a potential for a bearish reversal.
The 1st resistance level at 0.6307 is identified as a swing-high resistance that aligns with a confluence of Fibonacci levels i.e. the 161.80% extension and the 78.60% projection levels. Higher up, the 2nd resistance level at 0.6307 is also marked as a swing-high resistance, indicating its potential significance as a barrier for further upward movement.
To the downside, the 1st support level at 0.6250 is identified as an overlap support. Further below, the 2nd support level at 0.6182 is also noted as an overlap support, further reinforcing its importance as a key support level.
DJ30:
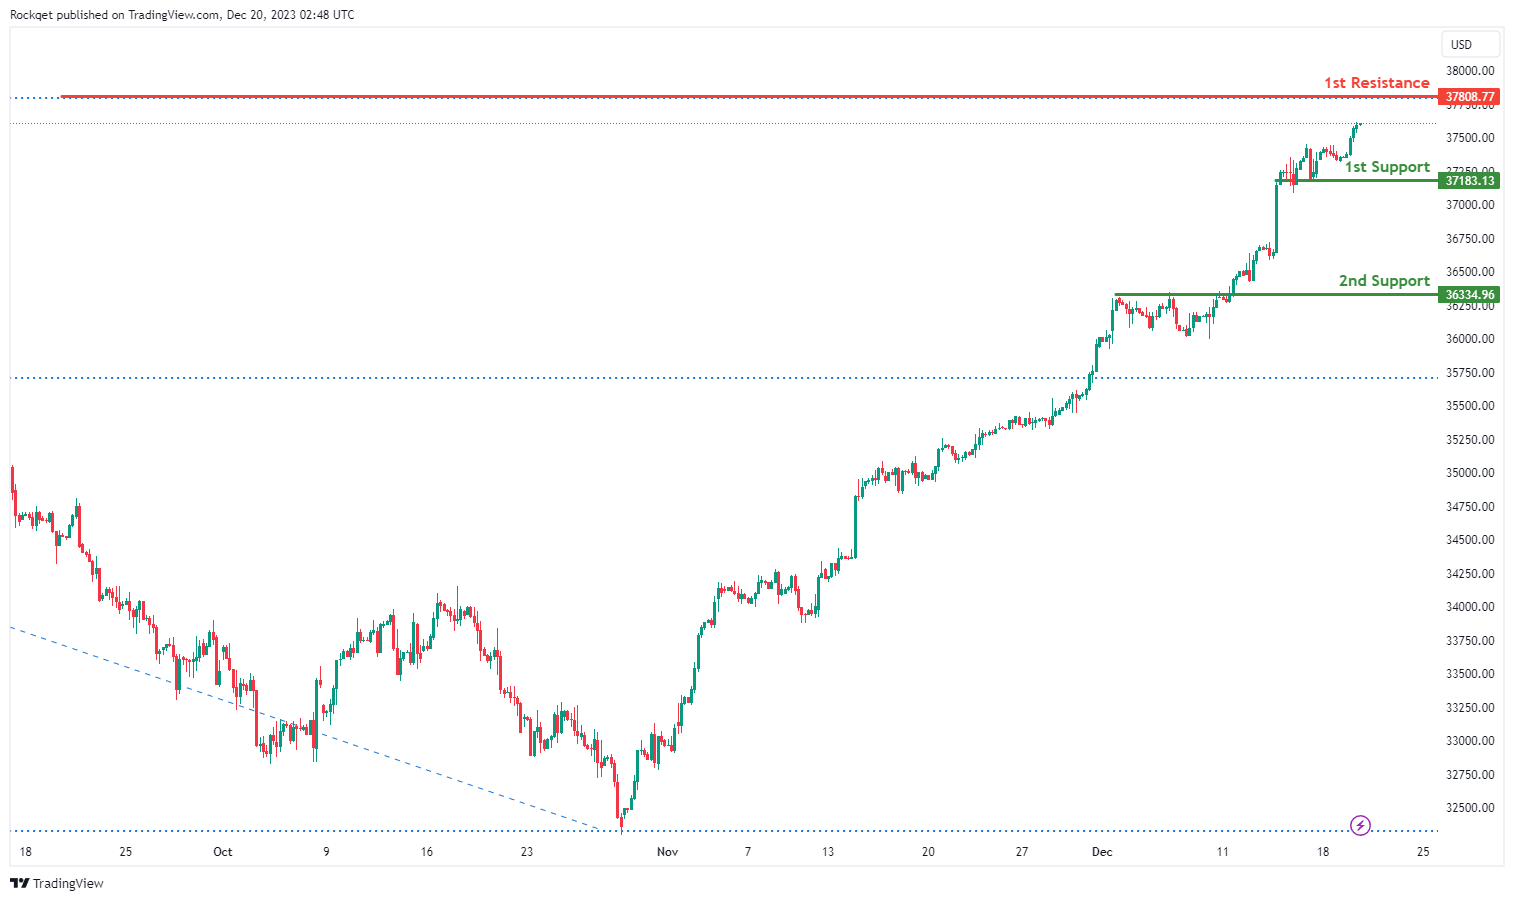
The DJ30 chart currently exhibits a bullish overall momentum, suggesting a potential scenario for a bullish continuation towards the 1st resistance.
The 1st support at 37183.13 is considered significant as it represents an overlap support. This level indicates a historical area where buying interest has been present, reinforcing its potential as a crucial support zone.
Similarly, the 2nd support at 36334.96 is identified as another overlap support, providing an additional layer of potential support for the index.
On the resistance side, the 1st resistance at 37808.77 is associated with the 161.80% Fibonacci Extension. This level may act as a barrier where selling interest could intensify, potentially causing a temporary pause or reversal in the bullish trend.
GER40:
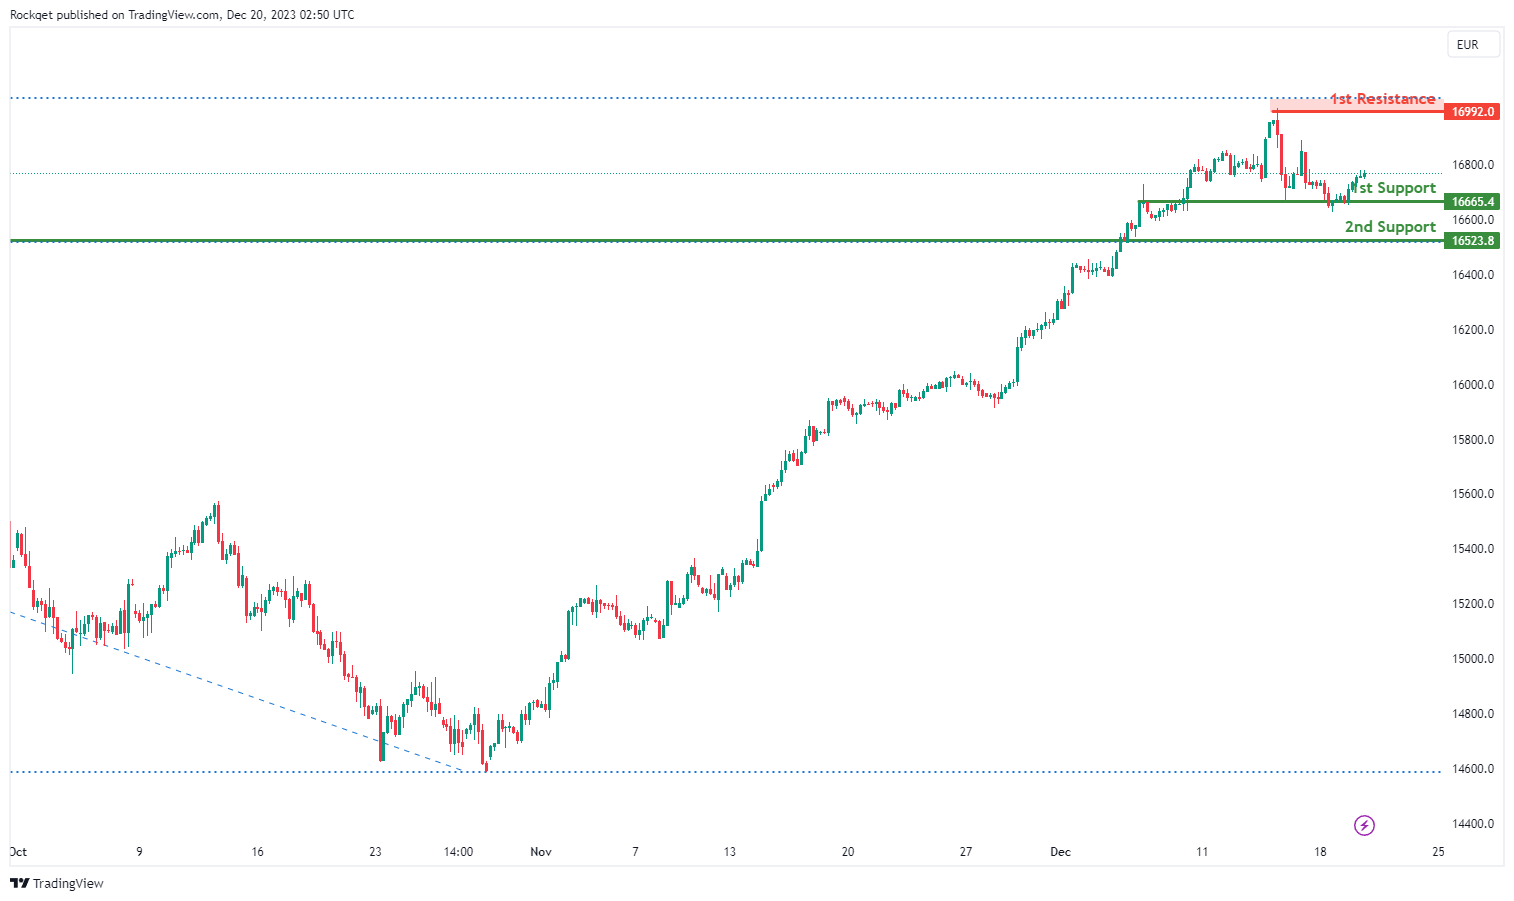
The GER40 chart currently exhibits a bullish overall momentum, with contributing factors supporting this trend.
The potential scenario suggests that the price may experience a bullish bounce off the 1st support and move towards the 1st resistance.
The 1st support at 16665.40 is considered significant as it represents an overlap support. This level indicates a historical area where buying interest has been present, making it a potential strong support zone.
Additionally, the 2nd support at 16523.80 is identified as a pullback support, adding another layer of potential support for the price.
On the resistance side, the 1st resistance at 16992.00 is associated with the 127.20% Fibonacci Extension. This level could act as a target where selling interest might intensify, potentially causing a temporary halt or reversal in the bullish trend.
US500:
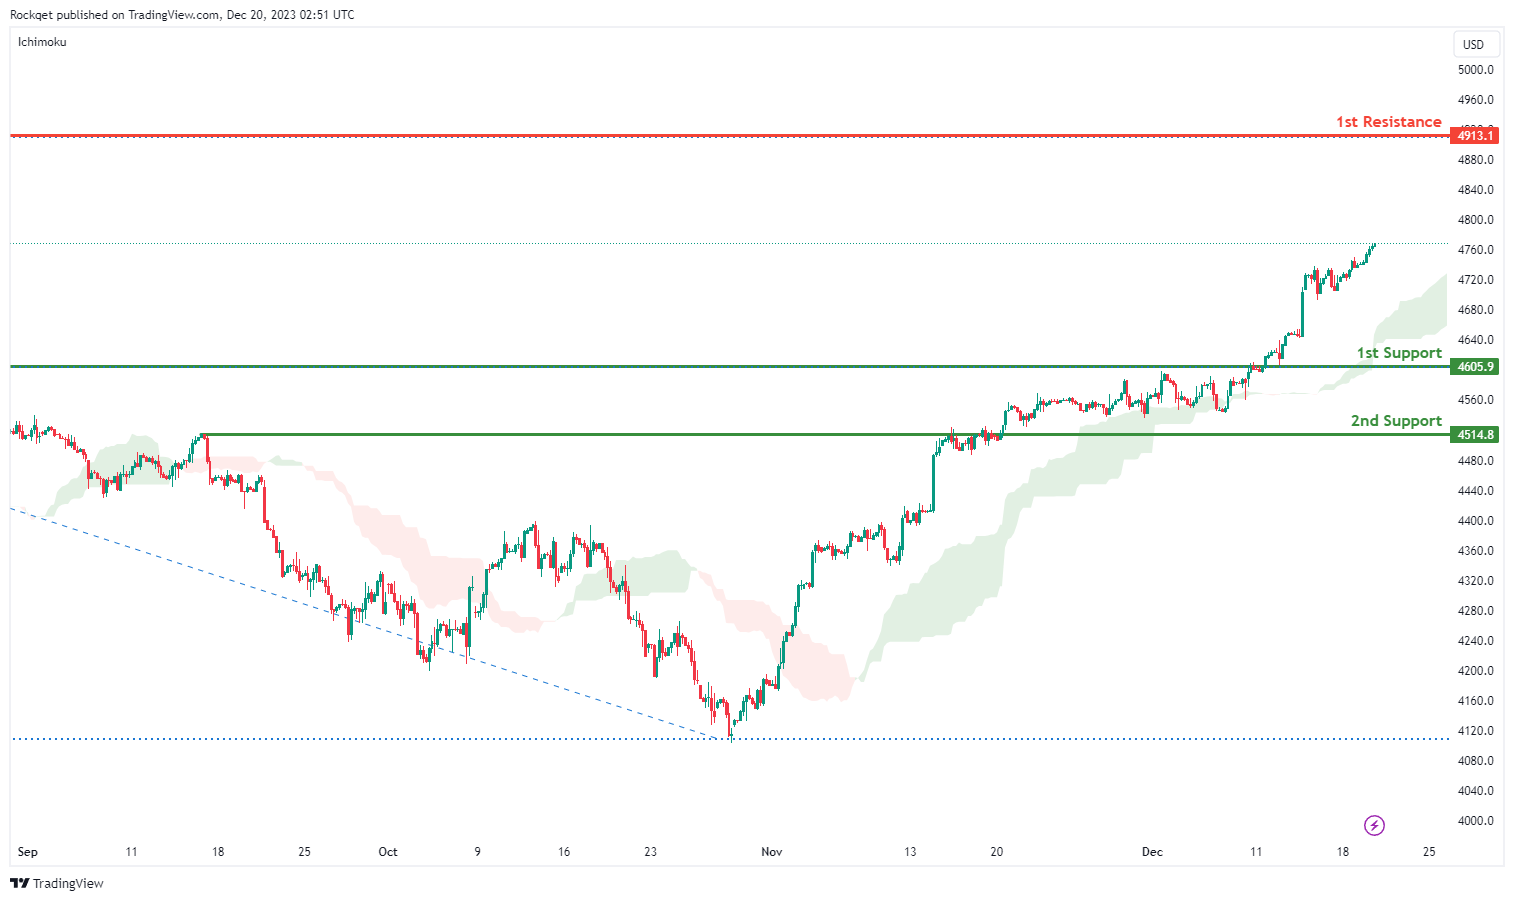
The US500 chart currently exhibits a bullish overall momentum, with factors contributing to this momentum being that the price is above the bullish Ichimoku cloud.Potential scenarios suggest a bullish continuation towards the 1st resistance level.
The 1st support at 4605.9 is identified as a pullback support, indicating a level where buying interest has historically been present. Additionally, the 2nd support at 4514.8 is recognized as an overlap support, adding another layer of potential support to the chart.
On the resistance side, the 1st resistance at 4913.1 is associated with the 161.80% Fibonacci Extension. This level may act as a barrier where selling interest could intensify, potentially causing a temporary pause or reversal in the bullish trend.
BTC/USD:
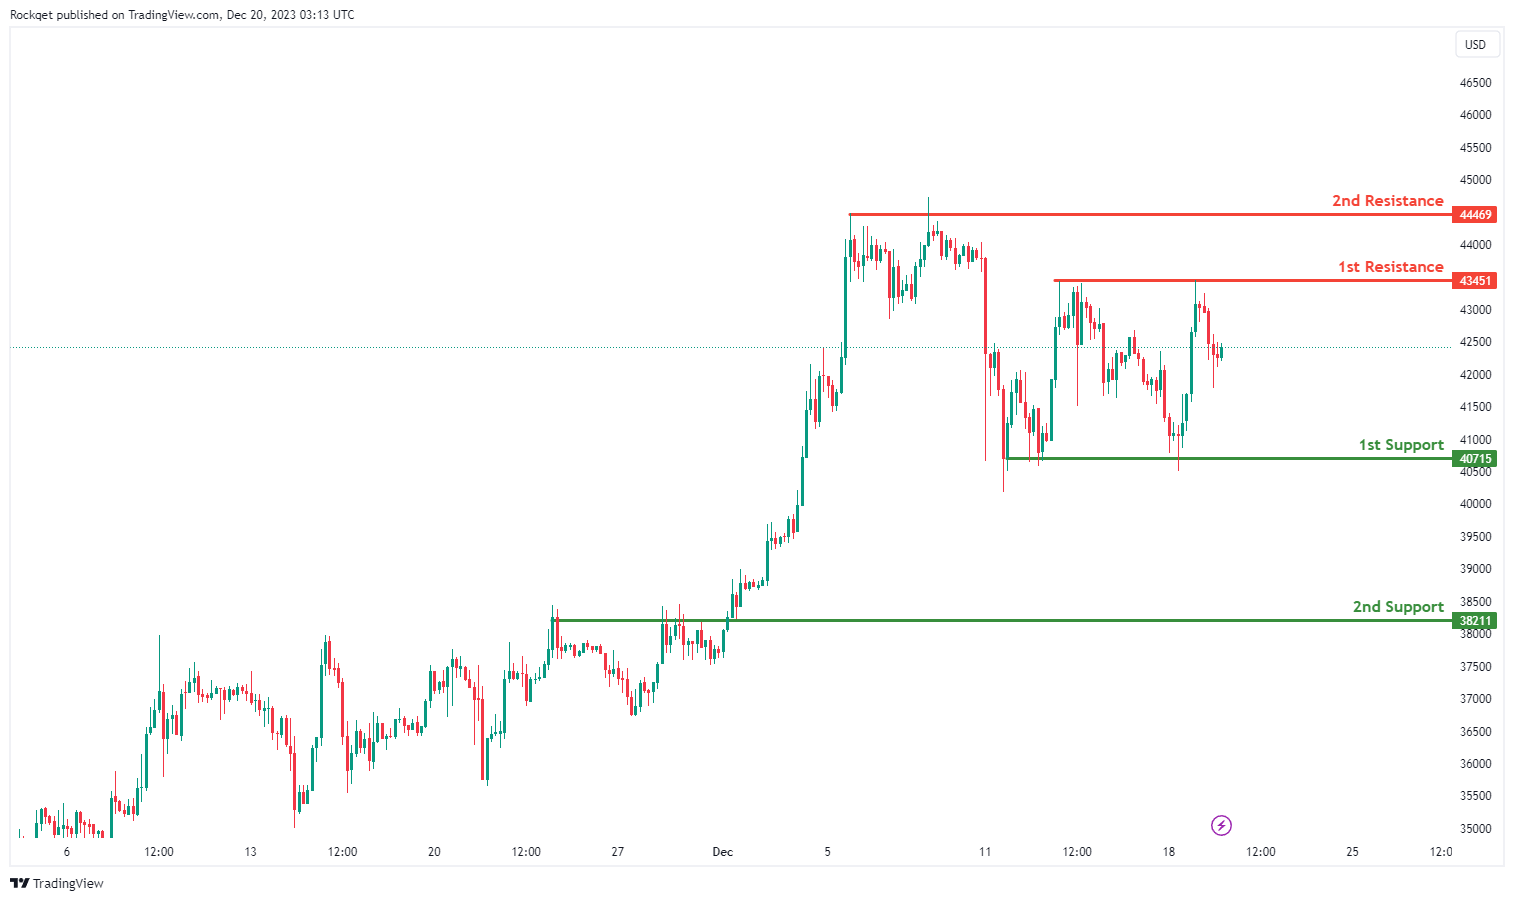
The BTC/USD chart currently exhibits a bullish overall momentum, suggesting a potential scenario for a bullish continuation towards the 1st resistance.
The 1st support at 40715 is considered significant as it represents a pullback support. This level indicates a historical area where buying interest has been present, reinforcing its potential as a crucial support zone. Similarly, the 2nd support at 38211 is identified as another pullback support, providing an additional layer of potential support for the cryptocurrency.
On the resistance side, the 1st resistance at 43451 is associated with a swing high resistance. This level may act as a barrier where selling interest could intensify, potentially causing a temporary pause or reversal in the bullish trend. Additionally, the 2nd resistance at 44469 is another swing high resistance, further emphasizing the potential challenge for the price to surpass these levels.
ETH/USD:
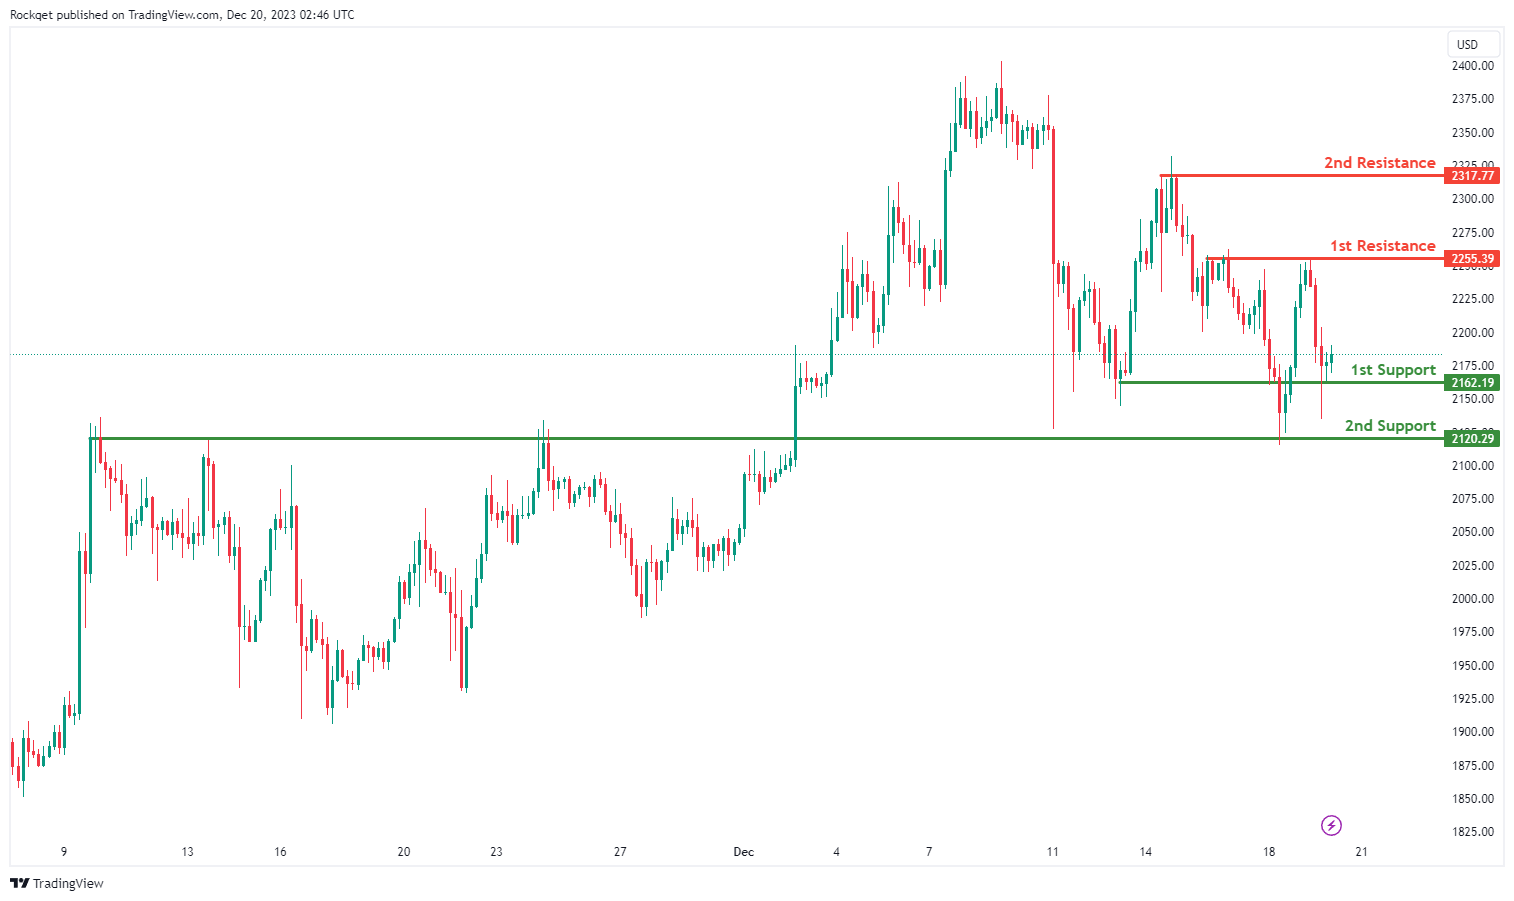
The ETH/USD chart currently exhibits a bullish overall momentum, suggesting a potential scenario for a bullish continuation towards the 1st resistance.
However, in the short term, the price could experience a drop to the 1st support level. The 1st support at 2162.19 is identified as a pullback support, representing a historical area where buying interest has been present. Additionally, the 2nd support at 2120.29 is considered an overlap support, adding an extra layer of potential support for the cryptocurrency.
On the resistance side, the 1st resistance at 2255.39 is associated with a pullback resistance, indicating a level where selling interest could intensify, potentially causing a temporary pause or reversal in the bullish trend. Furthermore, the 2nd resistance at 2317.77 is linked to a swing high resistance, highlighting a potential challenge for the price to surpass these levels.
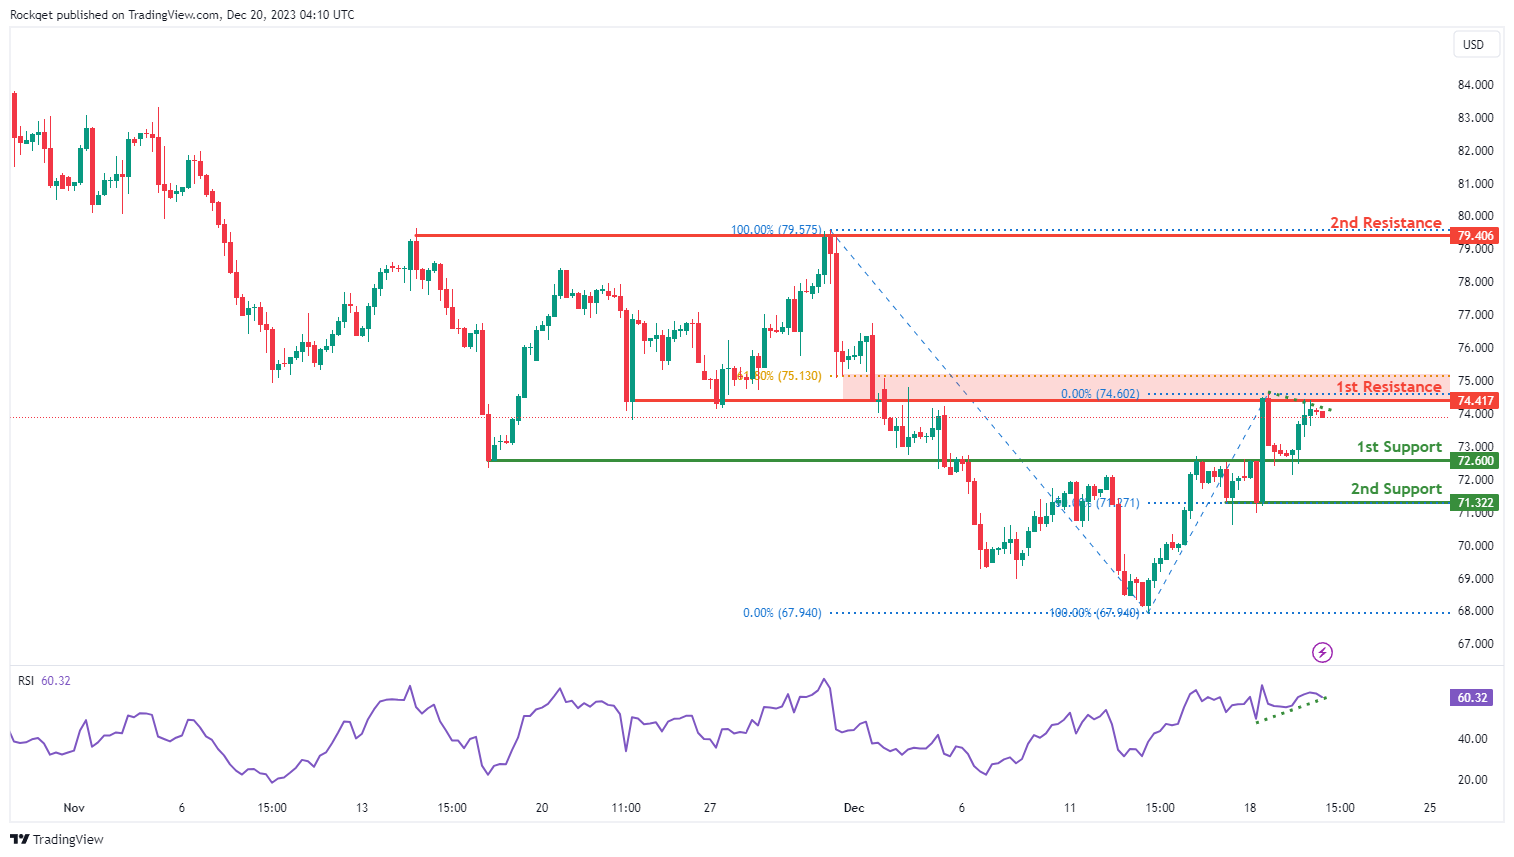
WTI/USD:
The WTI chart currently exhibits an overall bearish momentum, suggesting a prevailing downward trend. In this context, there is a potential scenario for price to make a bearish continuation towards the 1st support. However, the Relative Strength Indicator (RSI) is also demonstrating a bullish divergence versus price, suggesting a potential for a bullish reversal.
The 1st support level at 72.60 is identified as an overlap support. Further below, the 2nd support level at 71.32 is marked as a pullback support that aligns with the 50.00% Fibonacci retracement level, reinforcing its importance as a key support level.
To the upside, the 1st resistance level at 74.41 is identified as an overlap resistance that aligns close to the 61.80% Fibonacci retracement level. Higher up, the 2nd resistance level at 79.40 is noted as a multi-swing-high resistance, further indicating its potential significance as a barrier for further upward movement.
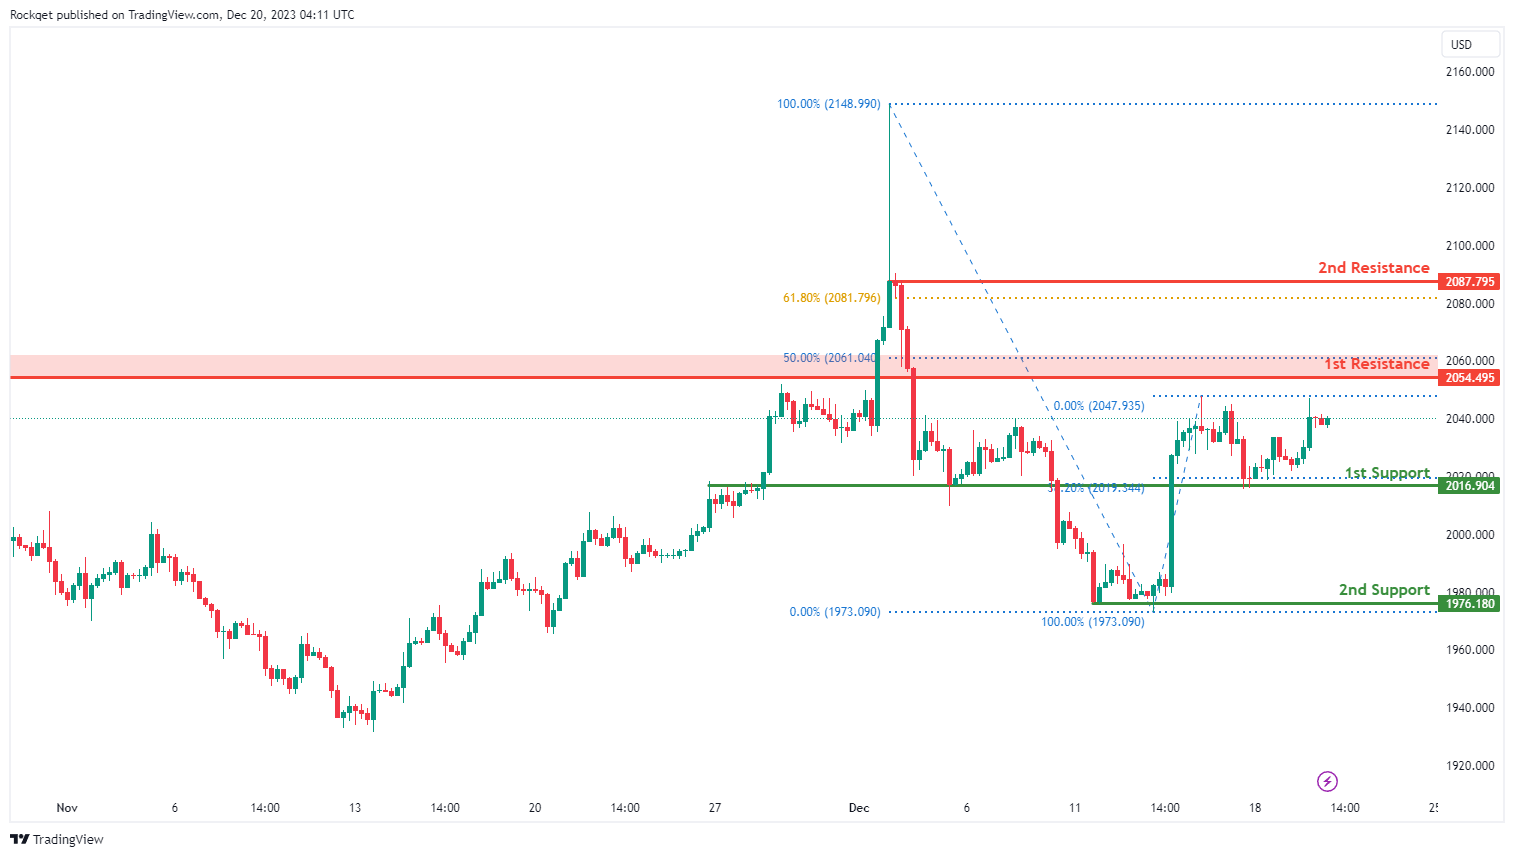
XAU/USD (GOLD):
The XAU/USD chart currently demonstrates a neutral momentum, indicating a potential for price to fluctuate between the 1st support and the 1st resistance.
The 1st support level at 2,016.90 is identified as an overlap support that aligns with the 38.20% Fibonacci retracement level. Further below, the 2nd support level at 1,976.18 is noted as a pullback support, reinforcing its importance as a key support level.
To the upside, the 1st resistance level at 2,054.49 is identified as a swing-high resistance that aligns close to the 50.00% Fibonacci retracement level. Higher up, the 2nd resistance level at 2,087.79 is marked as a pullback resistance that aligns close to the 61.80% Fibonacci retracement level, further indicating its potential significance as a barrier for further upward movement.
The accuracy, completeness and timeliness of the information contained on this site cannot be guaranteed. IC Markets does not warranty, guarantee or make any representations, or assume any liability regarding financial results based on the use of the information in the site.
News, views, opinions, recommendations and other information obtained from sources outside of www.icmarkets.com, used in this site are believed to be reliable, but we cannot guarantee their accuracy or completeness. All such information is subject to change at any time without notice. IC Markets assumes no responsibility for the content of any linked site.
The fact that such links may exist does not indicate approval or endorsement of any material contained on any linked site. IC Markets is not liable for any harm caused by the transmission, through accessing the services or information on this site, of a computer virus, or other computer code or programming device that might be used to access, delete, damage, disable, disrupt or otherwise impede in any manner, the operation of the site or of any user’s software, hardware, data or property.


