
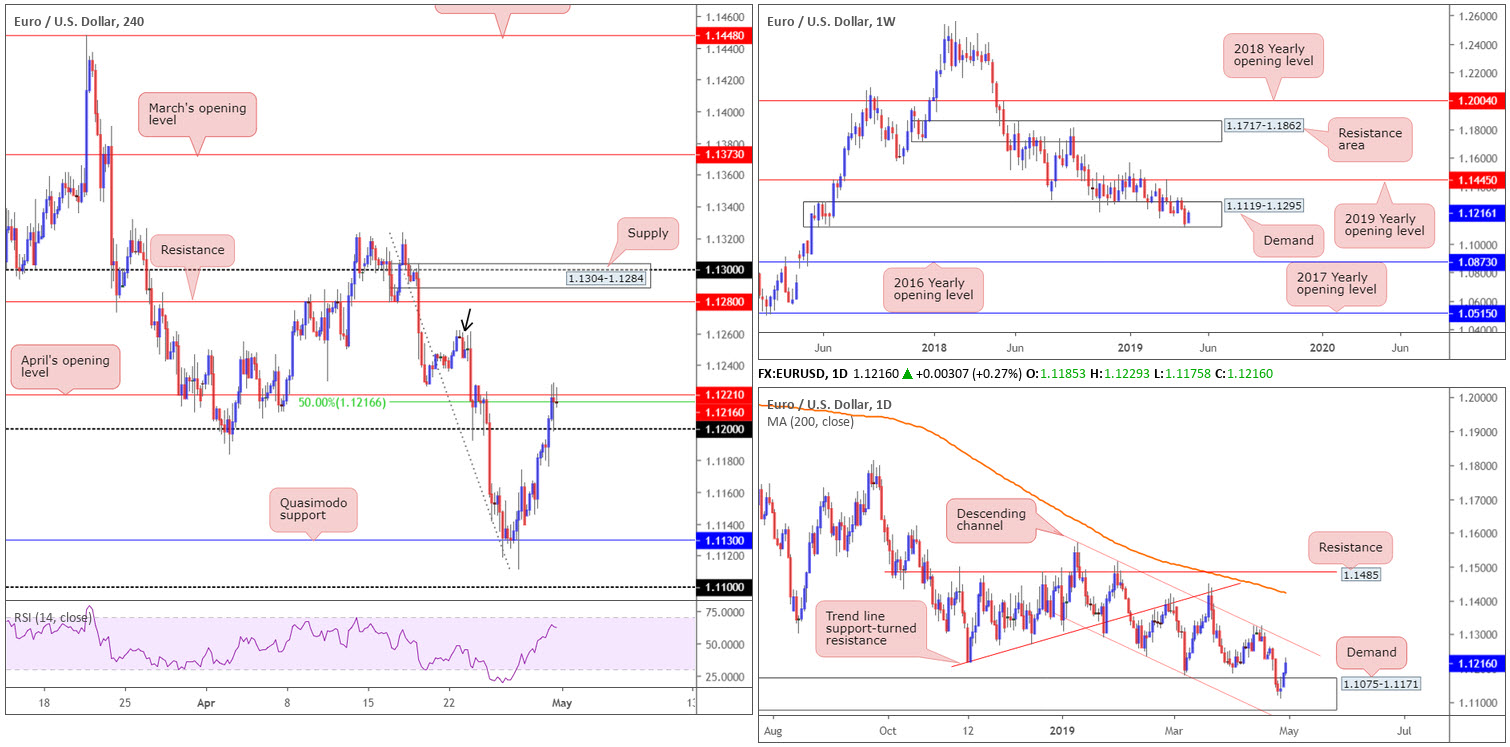
EUR/USD:
EUR/USD bulls went on the offensive Tuesday, chalking up a third consecutive daily gain. A faster-than-anticipated pickup in the Eurozone economy during the first quarter, as well as a diminishing greenback, elevated the H4 candles beyond its 1.12 neighbourhood to a session high of 1.1229.
As we head into Asia, the unit is seen consolidating gains around April’s opening level at 1.1221 and a 50.0% resistance value drawn from 1.1216. Beyond here, the research team is watching the 1.1262 April 22 high (black arrow), followed closely by resistance at 1.1280 and then a fresh supply zone coming in at 1.1304-1.1284.
On more of a broader perspective, weekly buyers continue to climb to higher ground within a long-standing demand area at 1.1119-1.1295, despite last week’s movement clipping the lower edge of its base. By the same token, daily action maintains a strong stance out of demand priced in at 1.1075-1.1171 (glued to the underside of the current weekly demand area). The next point of resistance from current price falls in around channel resistance etched from the high 1.1569.
Areas of consideration:
In order to confirm buyer intent, the research team recommends waiting for a H4 close above Aprils opening level at 1.1221 to form. This not only helps validate higher-timeframe strength, but it also clears the pathway north on the H4 scale towards noted H4 resistances (see above) for a possible long opportunity.
Traders interested in buying beyond 1.1221 could either buy the breakout candle and position a stop beyond its extreme point, or wait and see if a retest takes shape and enter based on the rejection candle’s structure. The latter is considered more conservative as breakouts have a tendency to fail.
Today’s data points: Many European banks are closed in observance of Labour Day; US ADP Non-Farm Employment Change; US ISM Manufacturing PMI; FOMC Statement, Press Conference and Federal Funds Rate.
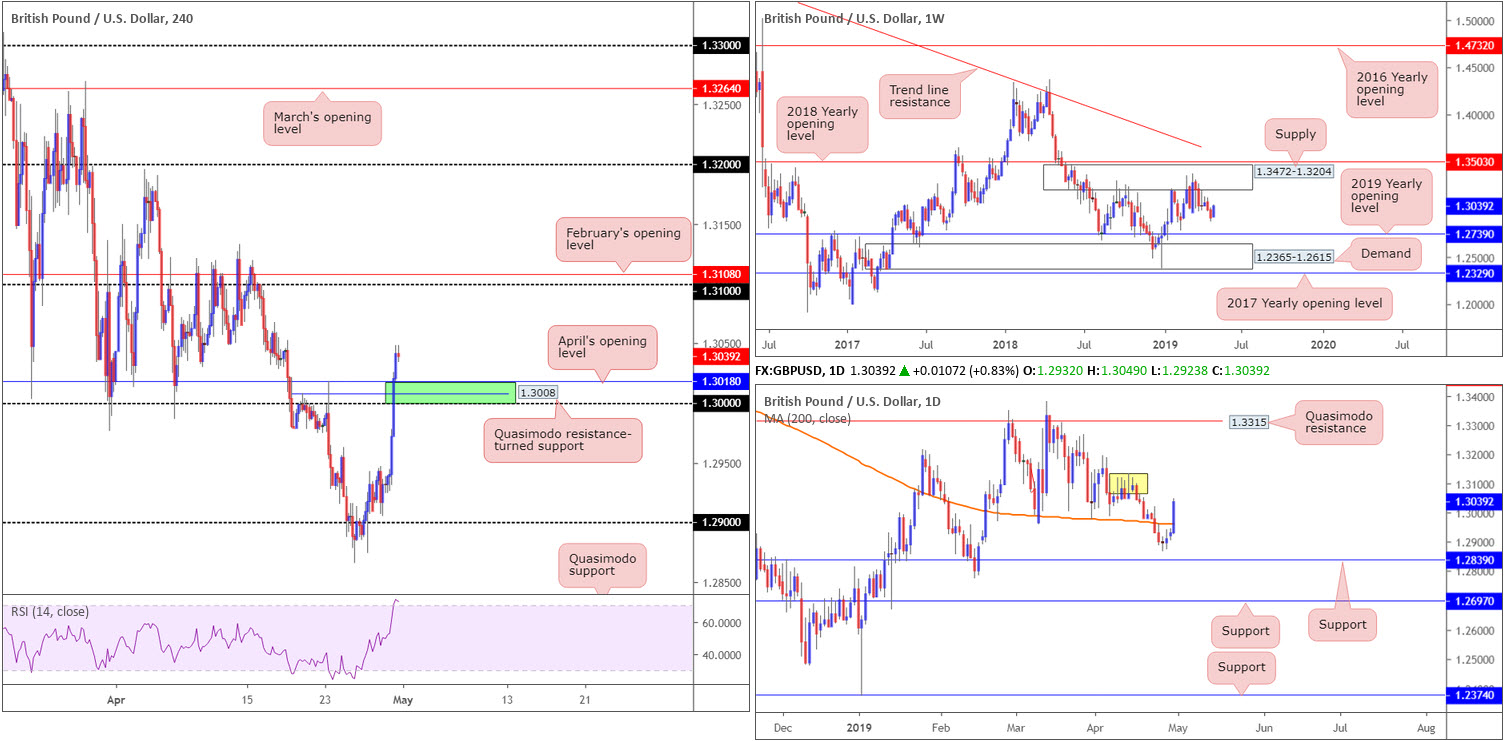
GBP/USD:
Sterling advanced alongside the euro Tuesday, while also seeing upside on reports the opposition Labour Party had opted to back a second Brexit referendum if it cannot secure a general election or come to an agreement with the government.
Focus has now shifted north of the key figure 1.30 on the H4 timeframe, eyeing a possible run towards 1.31, which is shadowed closely by February’s opening level at 1.3108. With that being said, though, a retest of 1.30 (and its surrounding supports: Quasimodo resistance-turned support at 1.3008 and April’s opening level at 1.3018 – green) may form prior to follow-through buying taking shape.
Recent buying, as is evident on the daily timeframe, has overthrown its 200-day SMA, now poised to retest possible supply emerging around 1.3070ish (yellow). Note above here, active supply is limited until reaching Quasimodo resistance at 1.3315.
In terms of weekly flow, price action could move in either direction with supply overhead visible at 1.3472-1.3204 and the 2019 yearly opening level surfacing below at 1.2739.
Areas of consideration:
With room to press for higher ground evident on the higher timeframes, traders may find use in the green H4 support zone discussed above at 1.30/1.3018 for potential longs. A retest of this area in the shape of a H4 bullish candlestick formation is likely enough to entice buyers into the market. Waiting for additional candlestick confirmation helps traders identify buyer intent; helps avoid a fakeout beneath 1.30 and also provides structure by which to position entry and risk levels.
Today’s data points: UK Manufacturing PMI; UK Net Lending to Individuals m/m; US ADP Non-Farm Employment Change; US ISM Manufacturing PMI; FOMC Statement, Press Conference and Federal Funds Rate.
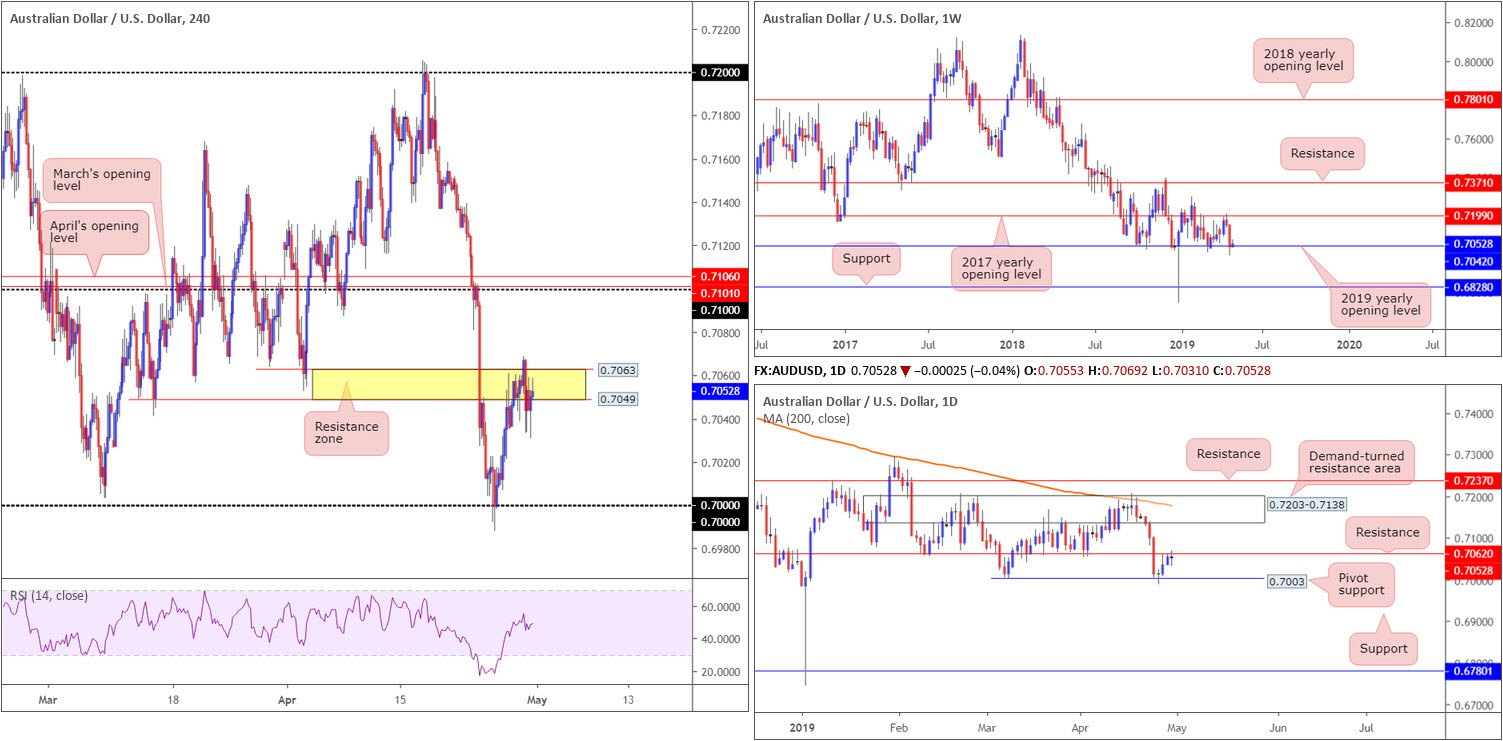
AUD/USD:
Outlook unchanged due to lacklustre movement.
Disappointing manufacturing data out of China weighed on the Australian dollar amid early trade Tuesday. Figures presented weak business activity in China’s manufacturing sector, with the Caixin Manufacturing PMI registering 50.2 in April vs. a market expectation of 51.0. In spite of this, and a broadly weaker greenback, the session wrapped up the day in neutral territory.
Technically, the H4 candles remain warring for position within a resistance zone pencilled in between 0.7063/0.7049 (yellow). This area is particularly significant, comprised of two Quasimodo support-turned resistances, levels which, statistically, have a high probability of holding – even more so when merging with daily resistance seen at 0.7062. Note yesterday’s activity produced a clear-cut Doji candle: an indecision candle.
On the other side of the spectrum, weekly action remains shaking hands with potential support by way of the 2019 yearly opening level at 0.7042. Further buying from here on the weekly timeframe has the 2017 yearly opening level to target at 0.7199.
Areas of consideration:
In spite of both H4 and daily structure underscoring strong resistance, weekly has support in sight. As a result of this, sellers might want to exercise some caution. Rather than entering a market sell order and placing a stop above yesterday’s high hoping it’ll move in favour, traders are urged to wait and see if the H4 candles breakout to the downside. A reasonably solid H4 bearish candle (one that closes near its lows) drawn from here will, given we’re coming from daily resistance, likely be enough energy to deliver a move towards the 0.70 neighbourhood.
Today’s data points: US ADP Non-Farm Employment Change; US ISM Manufacturing PMI; FOMC Statement, Press Conference and Federal Funds Rate.
USD/JPY:
Outlook unchanged due to lacklustre movement.
Extending last week’s loss from a peak of 112.40, the USD/JPY tested lows of 111.23 Tuesday. As you can see on the H4 timeframe, the move surpassed March’s opening level at 111.36, though as of writing a recovery above this number is taking form. Beyond 111.36, the research team has eyes on the (yellow) 110.94/111.08 region (comprised of April’s opening level at 110.94, the round number 111, a 50.0% support value at 111.06 and a 127.2% AB=CD [black arrows] Fibonacci ext. point at 111.08).
In terms of the higher timeframes, weekly price left the 2018 yearly opening level at 112.65 unopposed last week and turned lower, wrapping up the session forming a bearish pin-bar pattern. Further selling from this point is a possibility and has the 2019 yearly opening level at 109.68 to target.
The story on the daily timeframe saw the unit marginally cross beneath its 200-day SMA (orange), highlighting a potential move in the direction of channel support drawn from the low 107.77.
Areas of consideration:
March’s opening level at 111.36 on the H4 timeframe remains a barrier worth keeping an eye on today, largely due to its close connection with the 200-day SMA. A H4 or H1 bullish candlestick signal printed from 111.36 (entry and risk parameters can be determined according to this structure) is likely sufficient to draw in buyers and retest the 112 region.
A push below 111.36, as mentioned above, has 110.94/111.08 on the hit list. Owing to its local H4 confluence this is also another area buyers may potentially reside. As round numbers are prone to fakeouts, traders might also consider waiting for additional candlestick confirmation to form here before pulling the trigger.
Today’s data points: US ADP Non-Farm Employment Change; US ISM Manufacturing PMI; FOMC Statement, Press Conference and Federal Funds Rate.

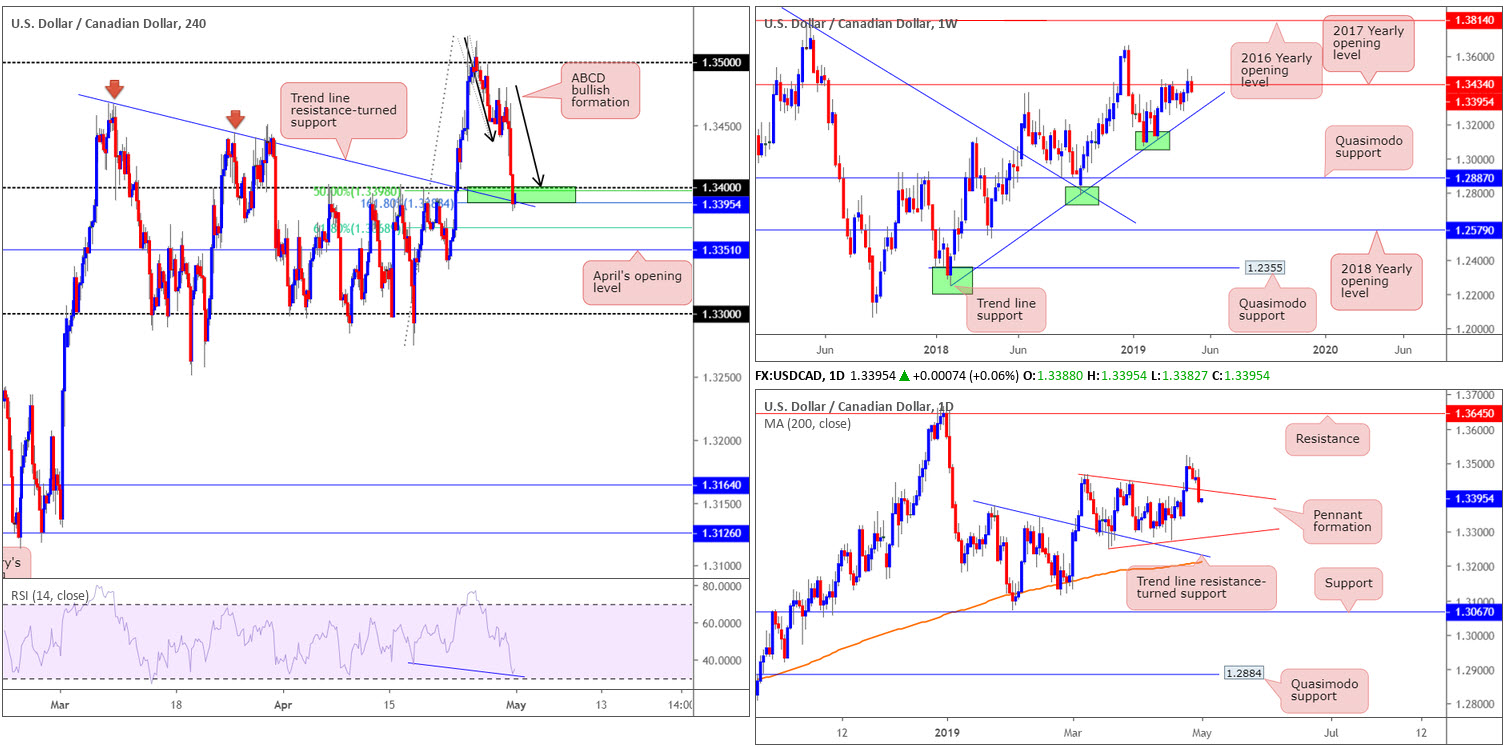
USD/CAD:
The Canadian dollar strengthened Tuesday, buoyed by advancing oil prices, a weakening dollar and comments from Bank of Canada’s Governor Poloz.
From a technical standpoint, the USD/CAD’s H4 candles settled a few points sub 1.34, though connected with a trend line resistance-turned support etched from the high 1.3443 and a 161.8% ABCD (black arrows) bullish pattern at 1.3388. Note we also have a 50.0% support value just above at 1.3398 (green zone). It might also interest some traders to note the RSI indicator (blue line) is currently printing hidden bullish divergence (whereby price leads the way as opposed to the indicator).
Longer-term flow sees weekly movement reclaim position beneath its 2017 yearly opening level at 1.3434, potentially opening up a run towards trend line support taken from the low 1.2247. In addition to the weekly timeframe’s position, the daily candles re-entered its symmetrical pennant formation in strong fashion yesterday. This could, according to our technical studies, draw in further selling and target the opposing edge of the pennant drawn from the low 1.3250.
Areas of consideration:
Despite both weekly and daily action suggesting lower prices could be in store, the confluence on the H4 timeframe, indicating we may be heading back above 1.34 and higher, is likely enticing for a number of traders, particularly those who trade using harmonics.
With the green H4 zone at 1.3388/1.34 being somewhat small in size, waiting for a H4 close to form back above 1.34 and buying the breakout candle (entry at the close with a stop beneath its extreme) could be an option, targeting 1.3450ish as an initial upside base.
Today’s data points: US ADP Non-Farm Employment Change; US ISM Manufacturing PMI; FOMC Statement, Press Conference and Federal Funds Rate; BoC Gov. Poloz Speaks.
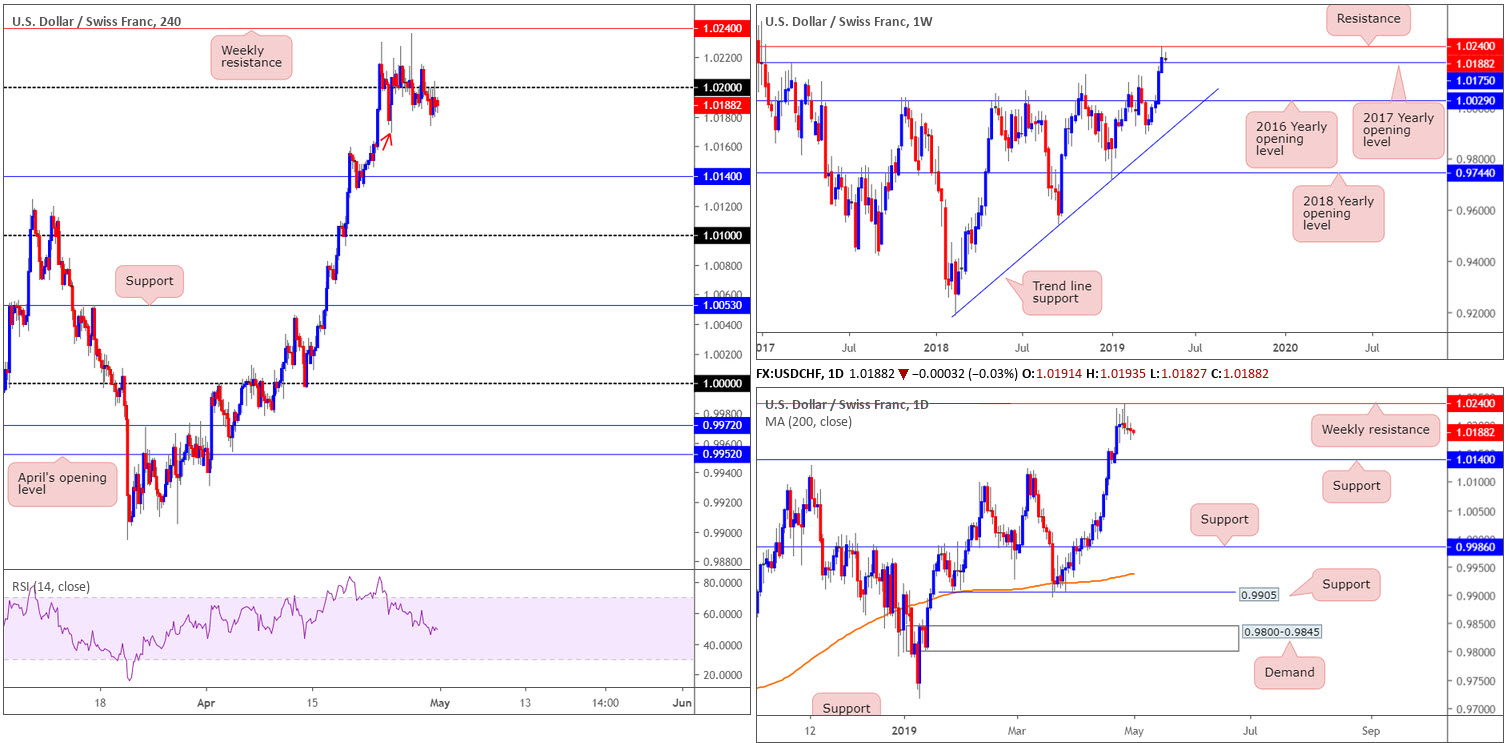
USD/CHF:
Outlook unchanged due to lacklustre movement.
Since April 23, the USD/CHF has struggled to determine its next short-term direction as the unit continues to flip between gains/losses around the 1.02 handle on the H4 timeframe. Overhead, traders are urged to pencil in weekly resistance coming in at 1.0240 (also shown on the H4 chart), which could, technically, be the reason behind cautious buying above 1.02. Price movement wrapped up Tuesday’s segment marginally in the red and currently holding ground sub 1.02.
The 2017 yearly opening level at 1.0175 on the weekly timeframe failed to offer the market resistance last week, consequently lifting the USD/CHF to its fifth consecutive weekly gain and fresh 2019 highs, as well as opening the gates for a test of nearby resistance at 1.0240. 1.0175, tested as support yesterday and Wednesday last week, boasts reasonably strong historical significance.
Much the same as the weekly viewpoint, weekly resistance 1.0240 is in view on the daily timeframe, though instead of the 2017 yearly opening level at 1.0175 set as the next downside target, daily support comes in a little lower at 1.0140.
Areas of consideration:
From a technical standpoint, the USD/CHF still appears to be ‘caught between a rock and a hard place’. In other words, irrespective of the direction one selects, opposing structure is close by. A short in this market has you contending with possible support from the 2017 yearly opening level at 1.0175, and a long has you competing with nearby weekly resistance at 1.0240. Granted, a long from above 1.02 has 40-points of wiggle room to play with, though given the lacklustre buying seen around this neighbourhood of late, it’s still a chancy move. With that being the case, the research team’s initial outlook stands: neither a long nor short seems attractive at this time.
Today’s data points: US ADP Non-Farm Employment Change; US ISM Manufacturing PMI; FOMC Statement, Press Conference and Federal Funds Rate.
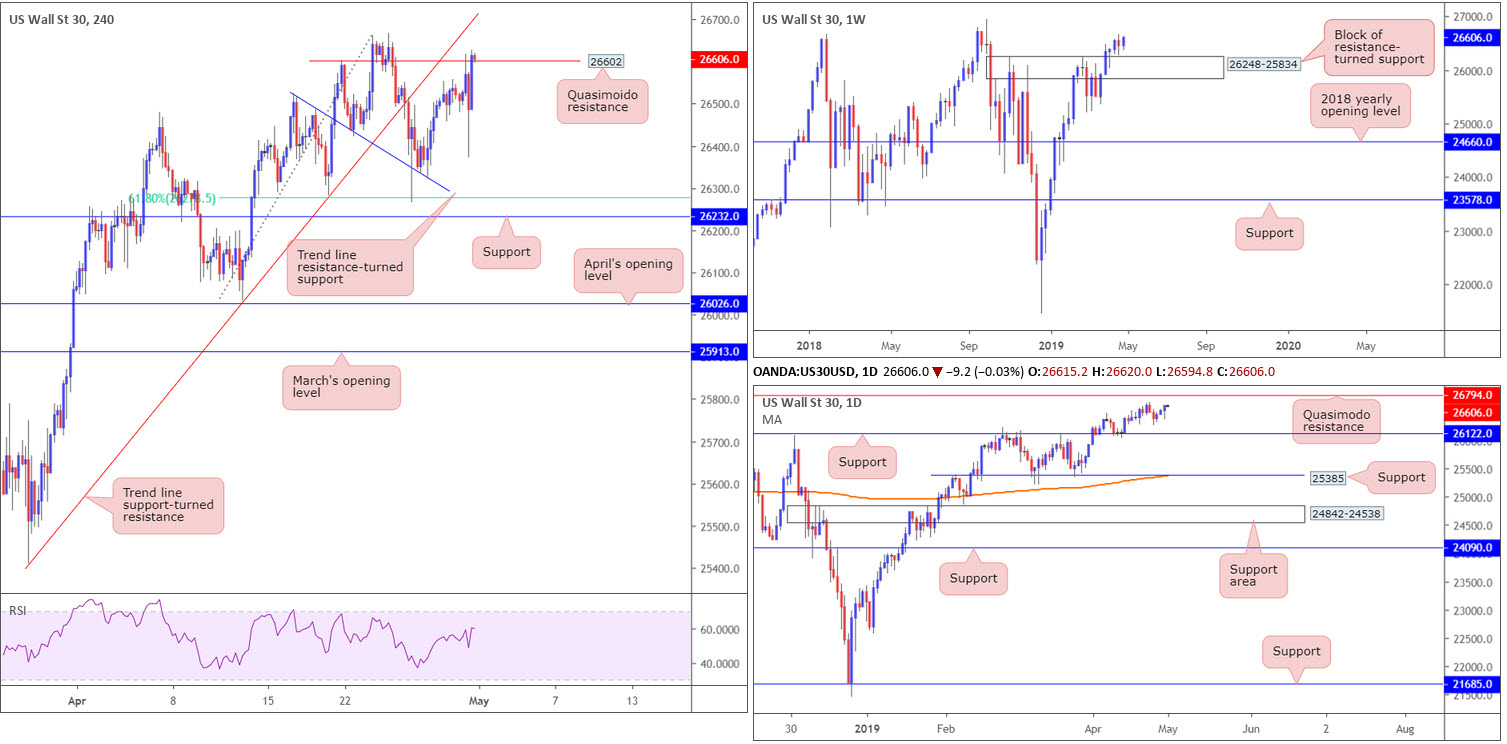
Dow Jones Industrial Average:
US equities concluded the day mixed Tuesday, as Google’s results weighed on the S&P 500 and Nasdaq. The Dow Jones Industrial Average added 0.15% (CFDs 0.30%), the S&P 500 eked out a 0.10% gain and the tech-heavy Nasdaq Composite wrapped up the session down 0.73%.
Mid-way through London’s session, the H4 candles briefly rose above Quasimodo resistance at 26602, though failed to push higher. It wasn’t until the day’s end did the market observe a H4 close print beyond this band. The next point of interest falls in around trend line support-turned resistance taken from the low 25410.
On a wider outlook, weekly price is hovering just north of a resistance-turned support area coming in at 26248-25834. Further buying from this point has the all-time high of 26939 to target. Located within the top region of the current support zone on the weekly timeframe, daily structure displays support at 26122. To the upside, however, a Quasimodo resistance is present at 26794.
Areas of consideration:
Traders may still be long this market on the back of last Thursday’s goodish H4 pin-bar pattern (red arrow) off the local trend line resistance-turned support (26525). The first logical take-profit target from here was the H4 Quasimodo resistance mentioned above at 26602. Well done to any of our readers who managed to take advantage of this move.
A break beyond here and price may approach the 26668 April 24 high, followed closely by the daily Quasimodo resistance mentioned above at 26794 and H4 trend line support-turned resistance taken from the low 25410.
Today’s data points: US ADP Non-Farm Employment Change; US ISM Manufacturing PMI; FOMC Statement, Press Conference and Federal Funds Rate.
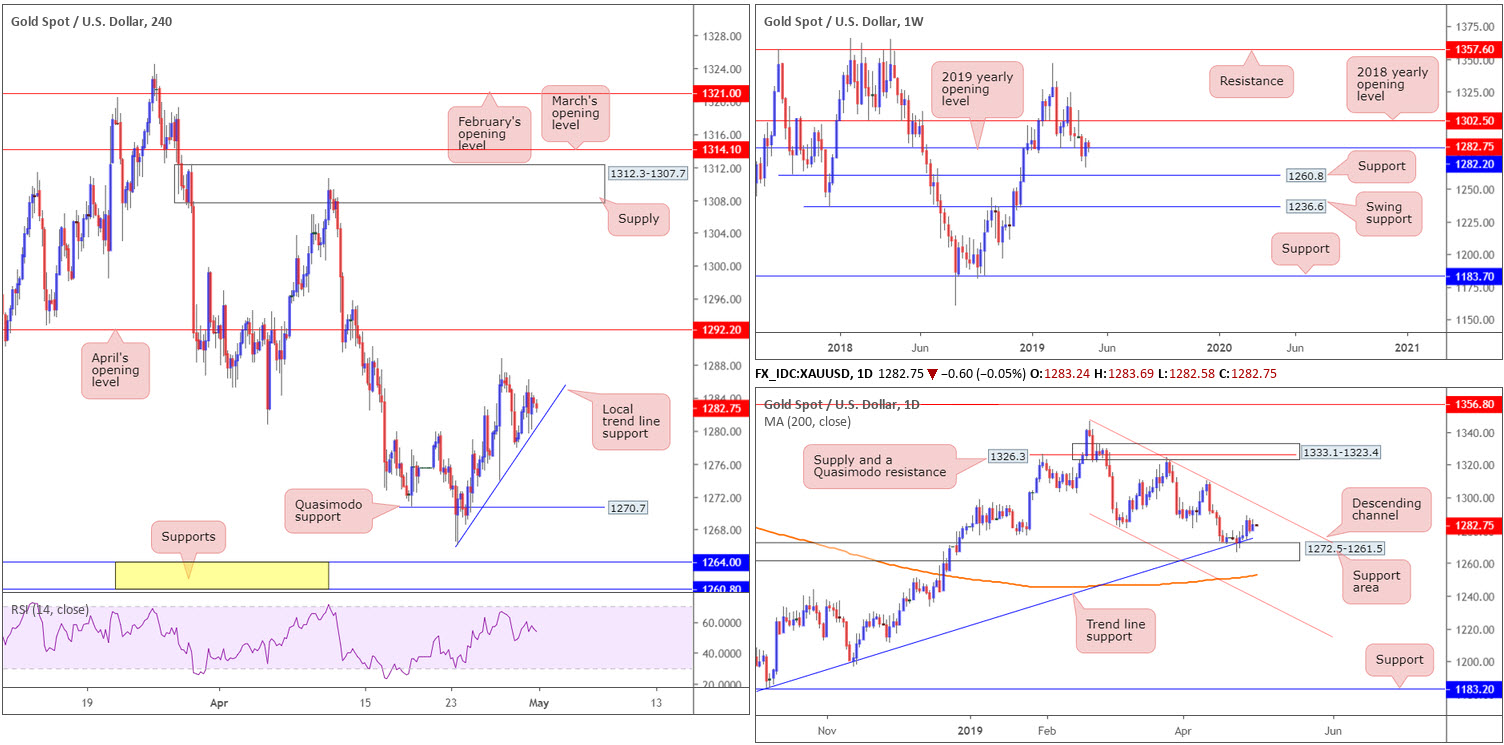
XAU/USD (GOLD):
Outlook unchanged due to lacklustre movement.
Despite broad-based USD selling Tuesday, bullion eked out marginal gains, though was not really anything to get excited about. Technically speaking, structure remains unchanged…
Daily price action, as you can see, continues to entice buyers into the market following a response emerging from a support area coming in at 1272.5-1261.5, as well as its merging trend line support etched from the low 1160.3. The next upside target from current price rests at a channel resistance drawn from the high 1346.7.
Weekly movement is seen flirting with its 2019 yearly opening level at 1282.2. Areas outside of this barrier to keep noted are support coming in at 1260.8 and the 2018 yearly opening level at 1302.5. A closer reading of price action on the H4 timeframe has the candles hovering just ahead of a local trend line support taken from the low 1266.1. To the upside, traders’ crosshairs are likely fixed on last Friday’s high at 1288.7, tailed closely by April’s opening level at 1292.2, whereas to the downside Quasimodo support rests at 1270.7.
Areas of consideration:
Shorter-term traders may find use in the current H4 trend line support today, given it likely has additional ‘juice’ from the 2019 yearly opening level on the weekly timeframe at 1282.2 and the aforementioned daily support area.
Traders are, however, urged to consider waiting for additional confirmation to form before pulling the trigger from the said trend line support, as limited confluence is seen supporting this base on the H4 timeframe. A H4 hammer candlestick signal, for example, not only helps define buyer intent, it provides a structure with which to base entry and risk levels from.
The accuracy, completeness and timeliness of the information contained on this site cannot be guaranteed. IC Markets does not warranty, guarantee or make any representations, or assume any liability with regard to financial results based on the use of the information in the site.
News, views, opinions, recommendations and other information obtained from sources outside of www.icmarkets.com.au, used in this site are believed to be reliable, but we cannot guarantee their accuracy or completeness. All such information is subject to change at any time without notice. IC Markets assumes no responsibility for the content of any linked site. The fact that such links may exist does not indicate approval or endorsement of any material contained on any linked site.
IC Markets is not liable for any harm caused by the transmission, through accessing the services or information on this site, of a computer virus, or other computer code or programming device that might be used to access, delete, damage, disable, disrupt or otherwise impede in any manner, the operation of the site or of any user’s software, hardware, data or property.


