
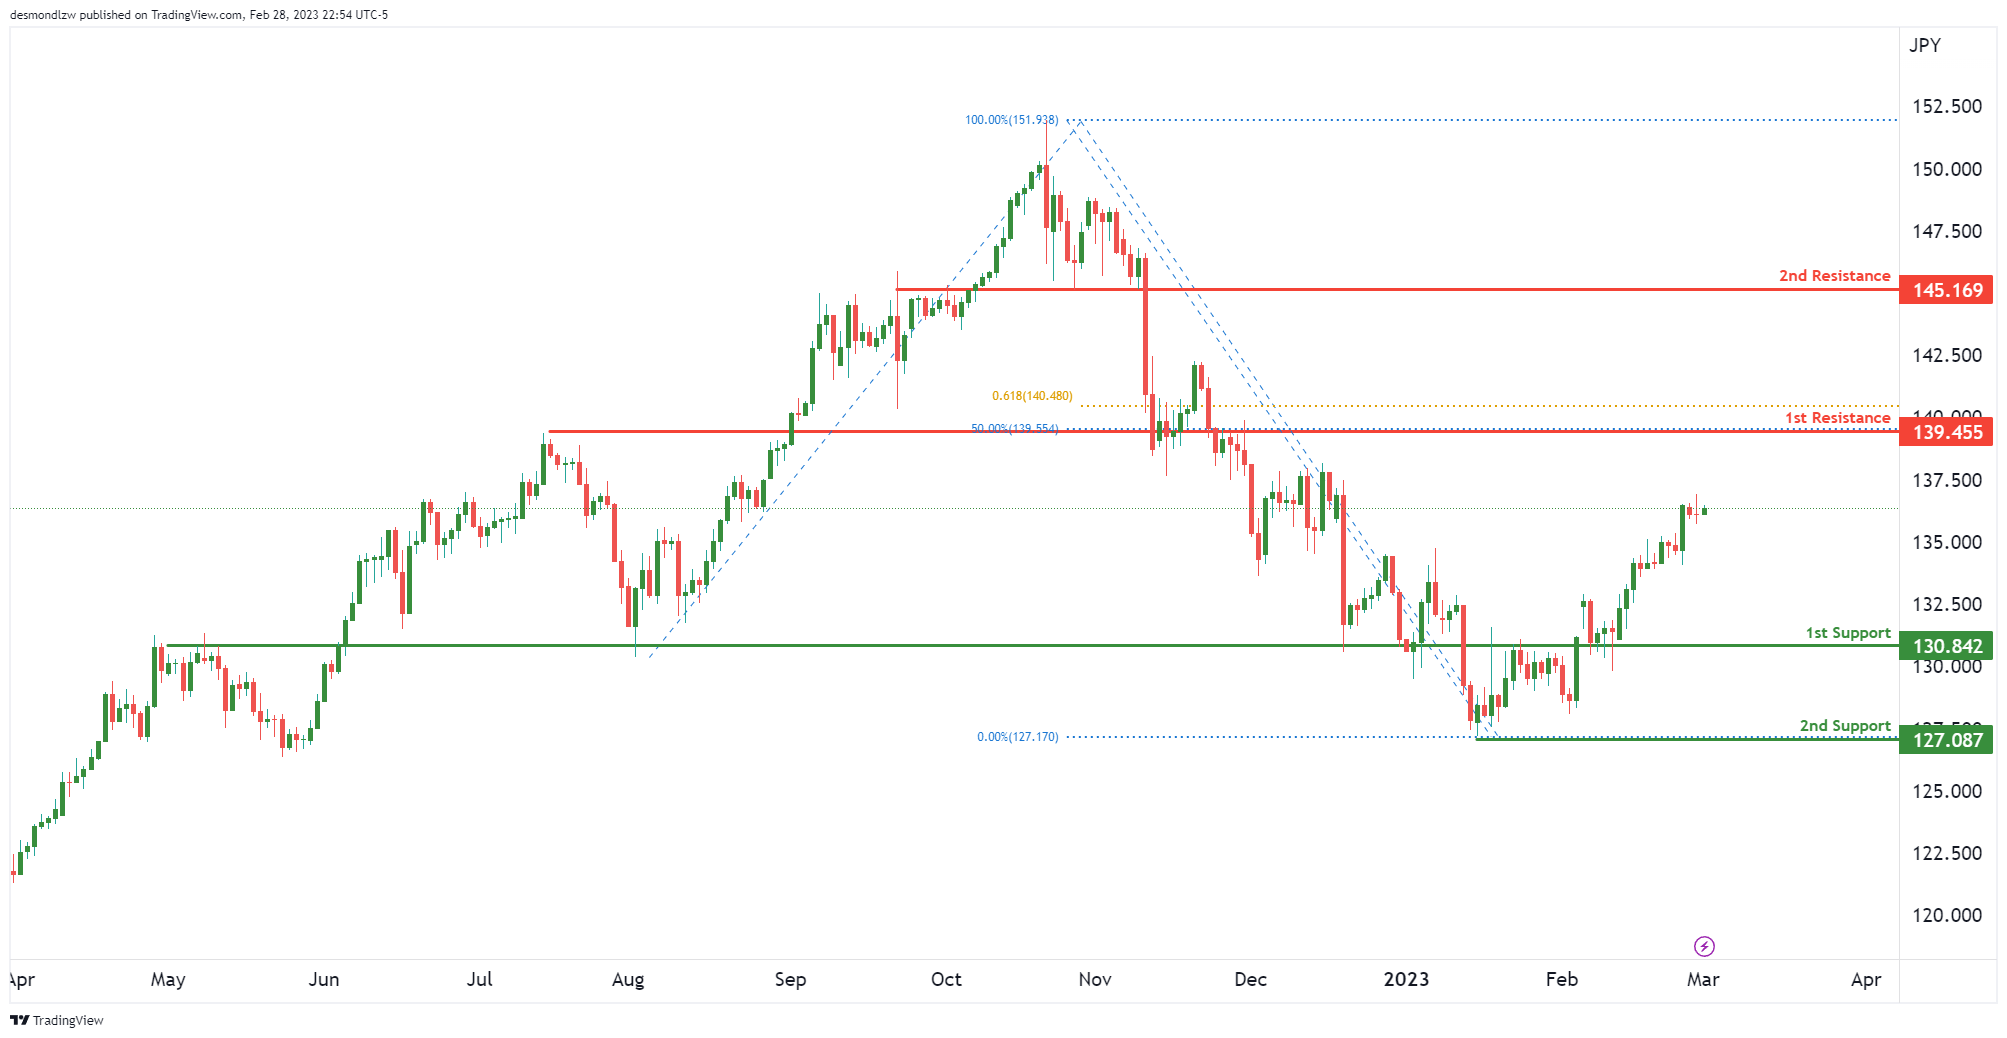
USD/JPY:
We’re seeing price approach our 1st resistance at 139.45. This is in line with the 50% Fibonacci retracement and 61.8% Fibonacci projection. If price breaks this level, the next big resistance is at 145.16 which is an overlap resistance.
In terms of support, there’s a nice overlap at 130.84 which serves as our 1st support. The next key support is the major swing low at 127.08.
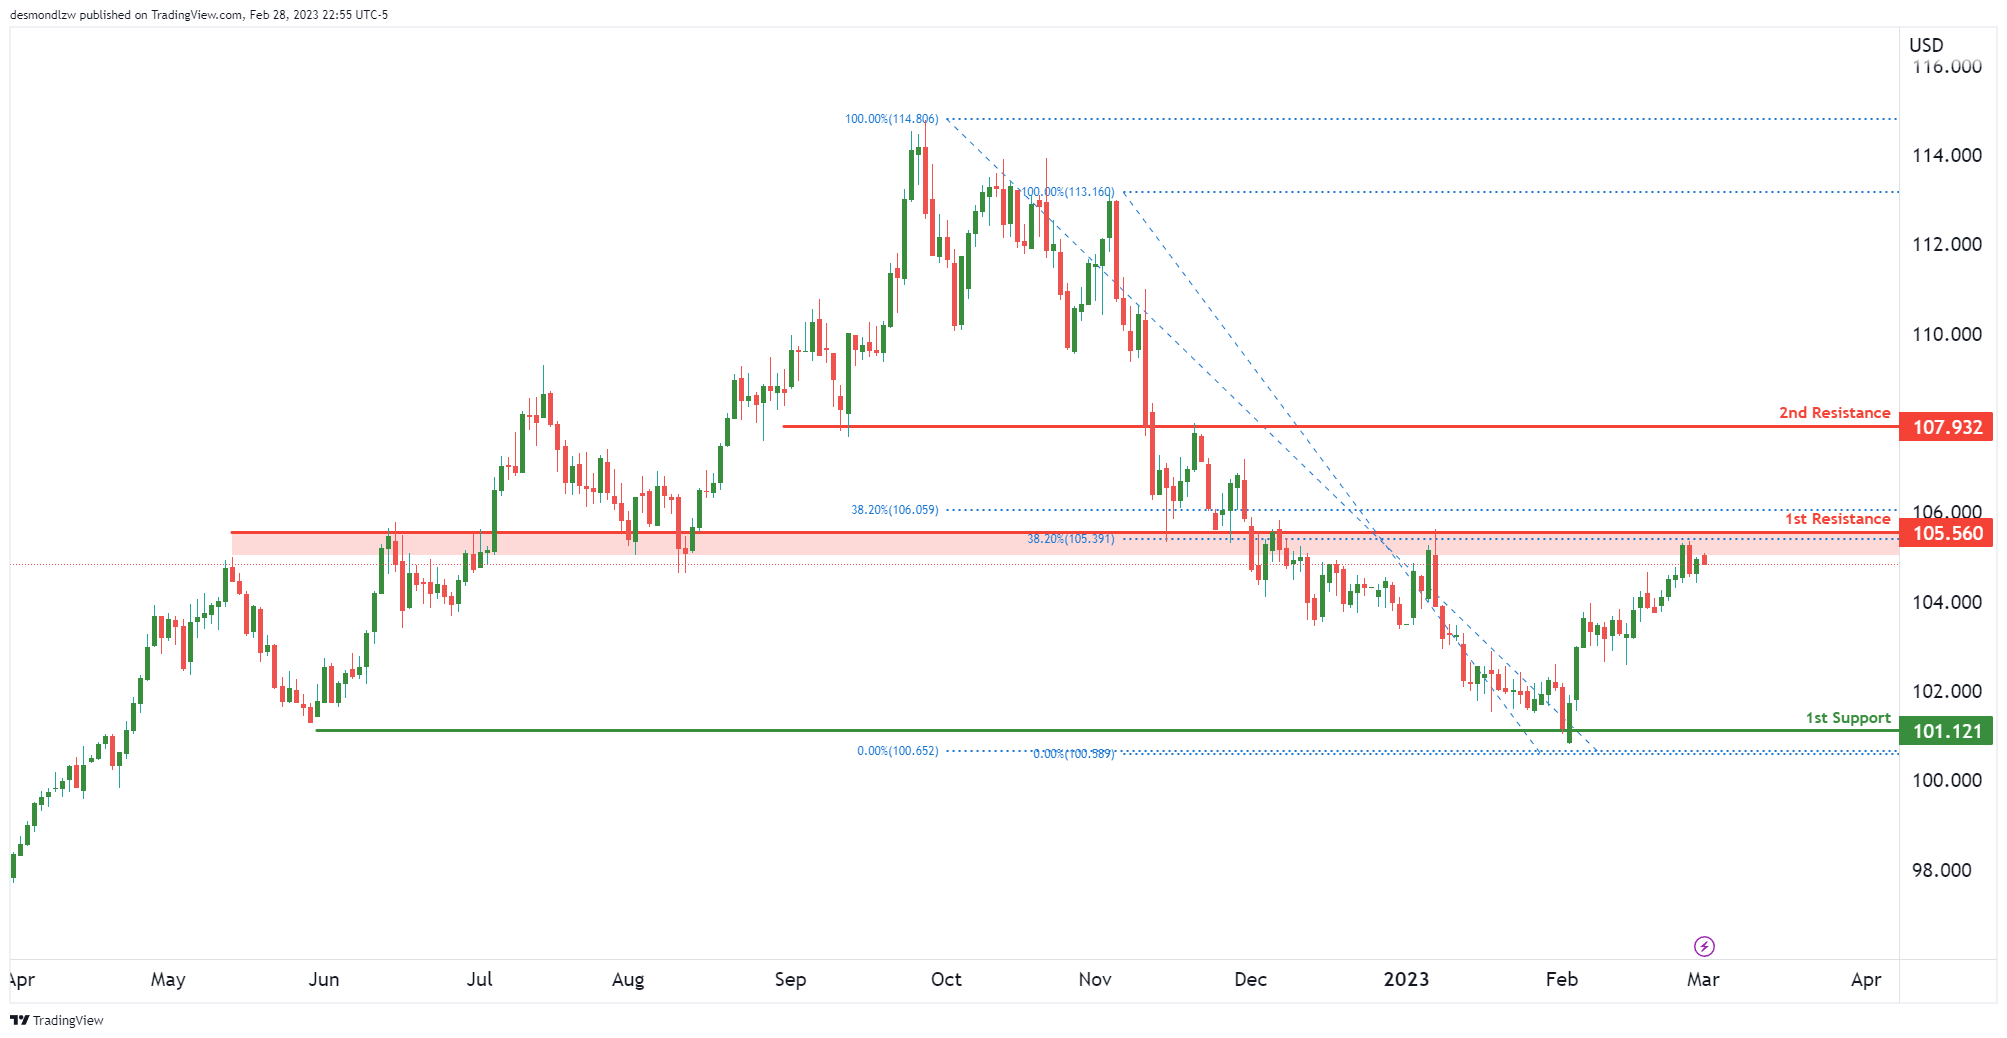
DXY:
Price is testing the 1st resistance at 105.56. This is a strong overlap resistance which also coincides what multiple 38% Fibonacci retracements. If price were to break this level, we could see if make a push up to 107.93.
In terms of support, a reversal from here would see prices drop to 101.12 which is a major double swing low support.
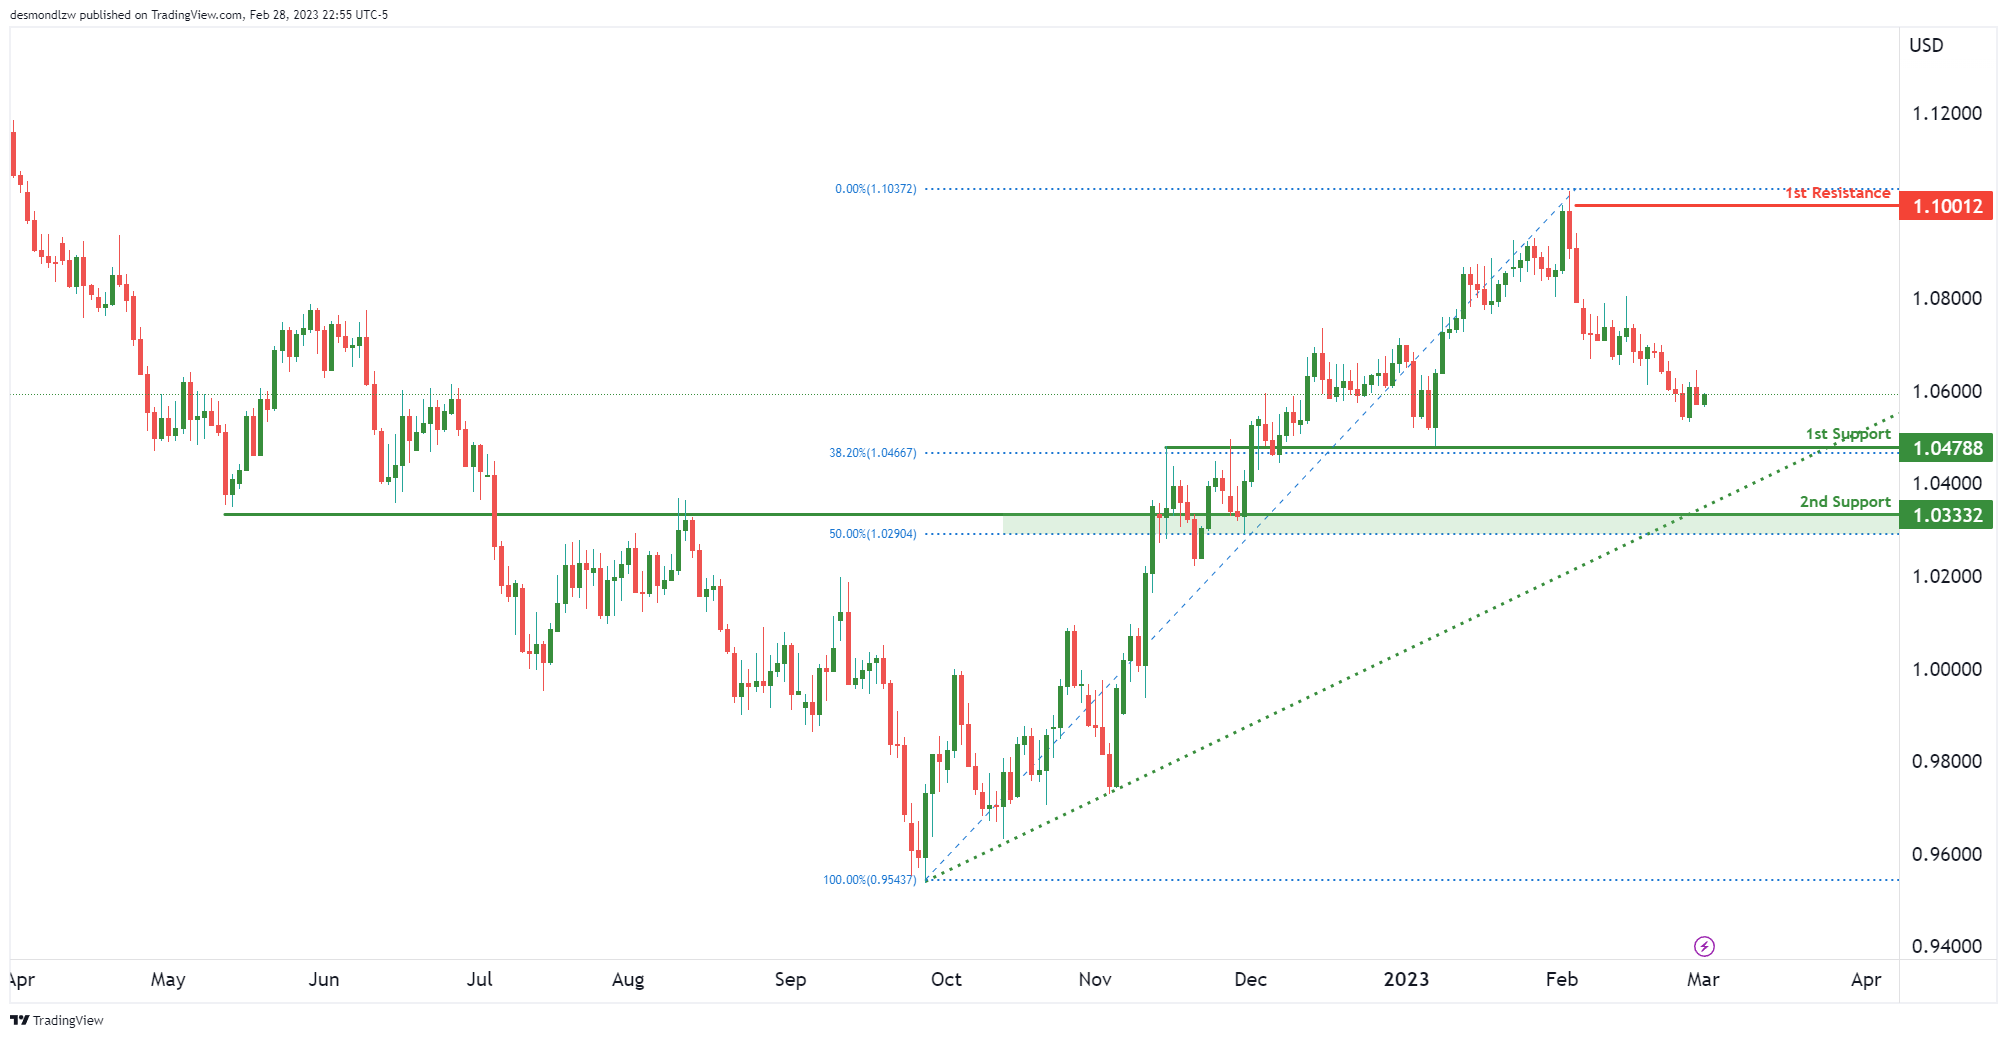
EUR/USD:
Price is approaching our 1st support at 1.0578 which is an overlap support that lines up with a 38.2% Fibonacci retracement. It’s worth noting that price is also seeing bullish pressure from the ascending support line.
The 2nd support is down at 1.0333 which is a strong overlap support and a 50% Fibonacci retracement too.
In terms of resistance, the closest resistance is at 1.1001 which is a recent swing high resistance.
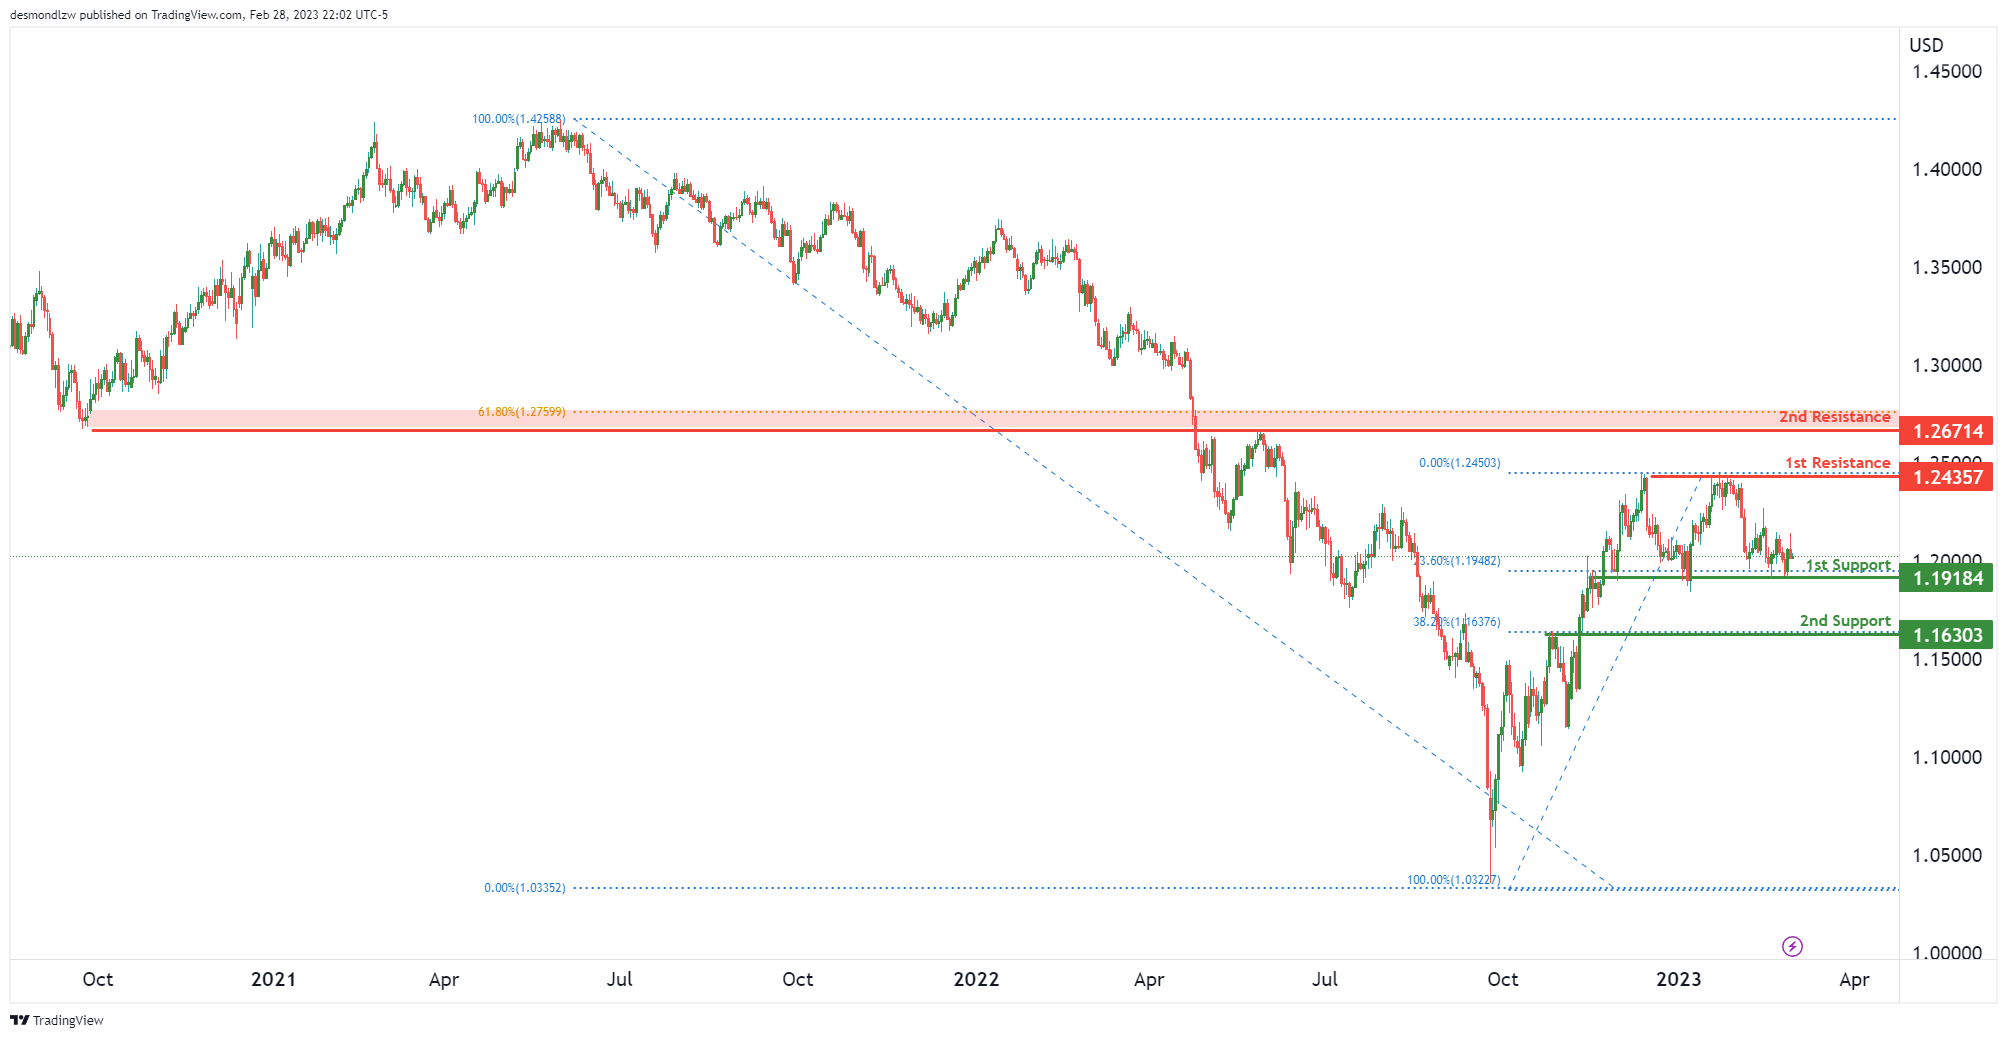
GBP/USD:
Price is ranging between the 1st support at 1.1918 which is an overlap support and a strong 23.6% Fibonacci retracement and the 1st resistance at 1.2435 – which coincides with 2 swing high resistance.
If price were to break the 1st support, we’re likely to see a double top reversal pattern and price could drop to 1.1630 which also lines up with the 38% Fibonacci retracement.
However, if price were to break the 1st resistance, we could see a push up to 2nd resistance at 1.2671 which is a strong pullback resistance that lines up with the major 61.8% Fibonacci retracement.
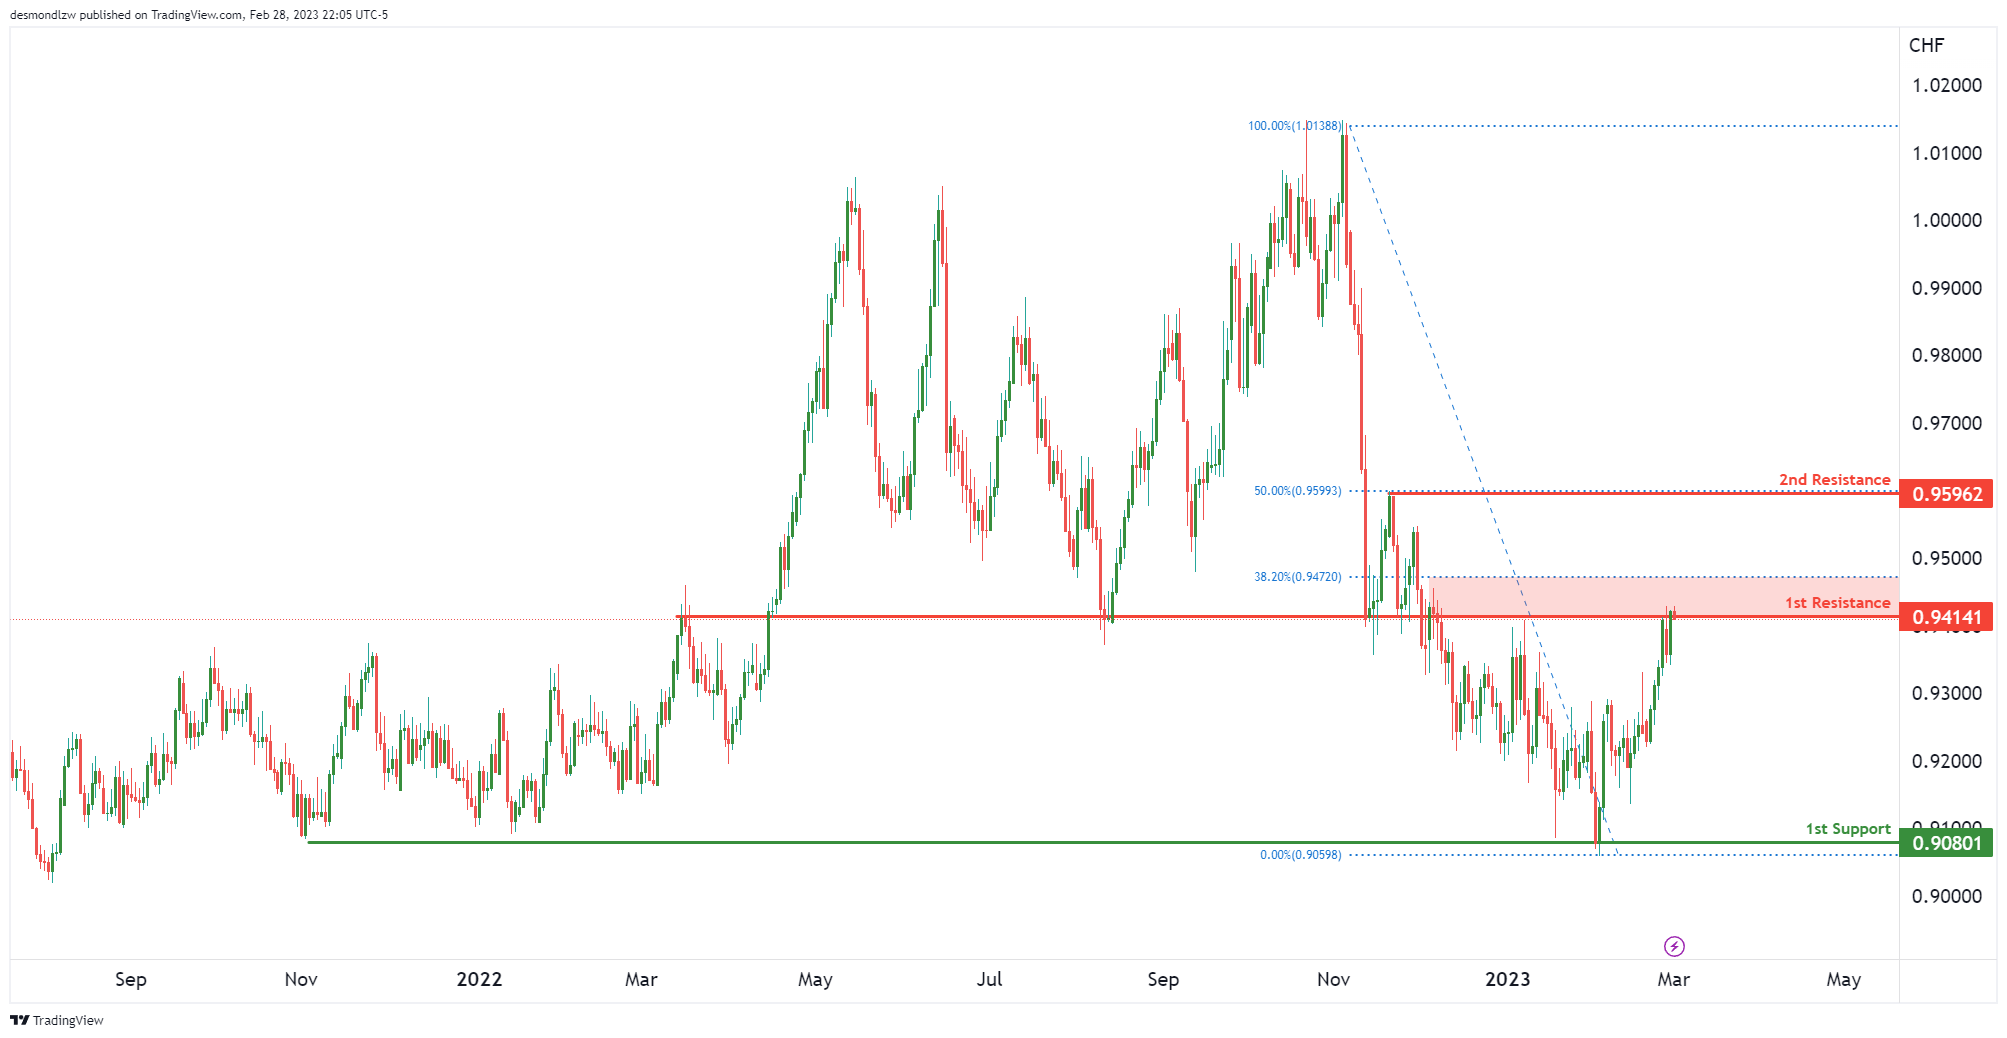
USD/CHF:
Price is now testing the 1st resistance at 0.9414. This is an overlap resistance and along with that, a 38.2% Fibonacci retracement. If price were to break this resistance, the next key resistance it could rise to is 0.9596 which is a small swing high resistance and a 50% Fibonacci retracement.
It’s worth noting that if price were to reverse from ehre, we could see it drop nicely down to 0.9080 which is our 1st support. This 1st support lines up nicely with a couple of recent swing lows.
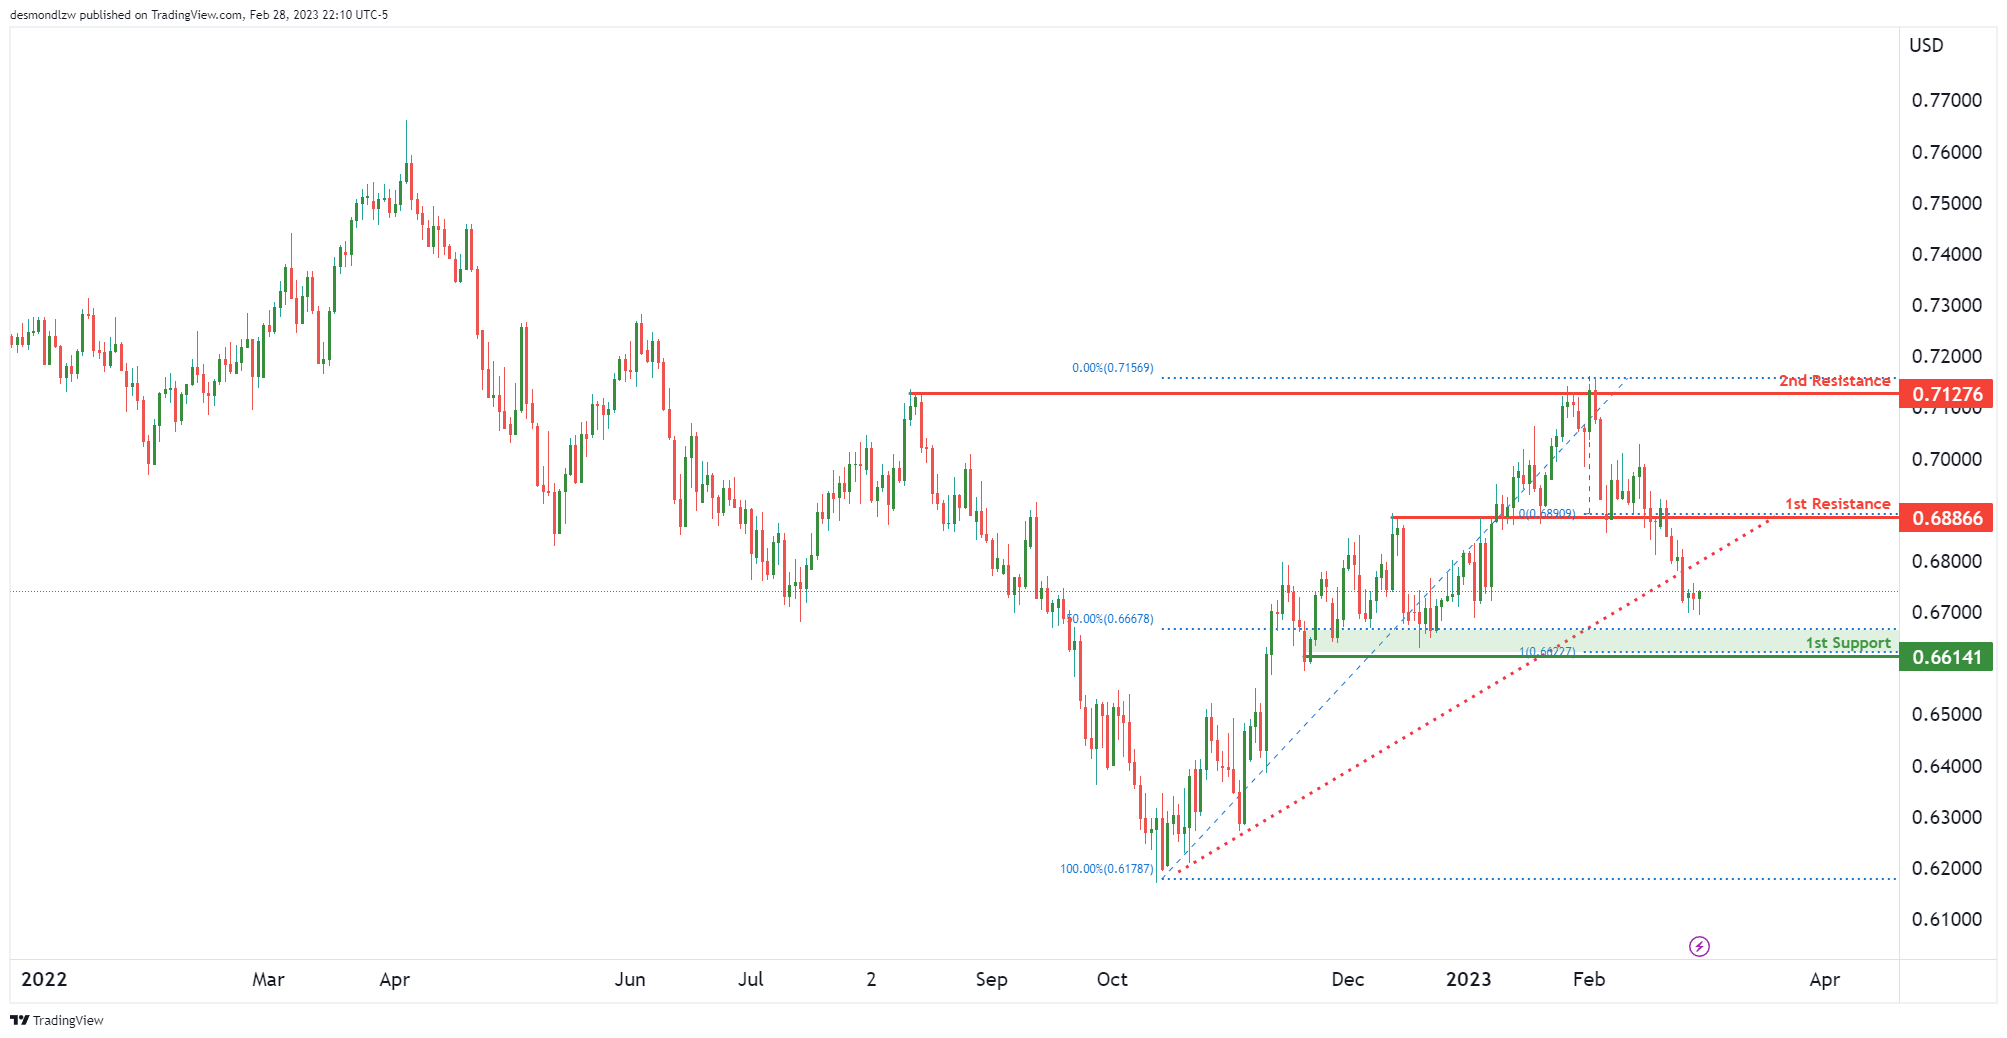
AUD/USD:
Price has broken our ascending support line and is enroute to our 1st support at 0.6614. This level lines up with the head and shoulders exit potential along with a 50% Fibonacci retracement. If price were to bounce from there, the 1st resistance we should take note of is at 0.6886 which is a strong overlap resistance and the level which formed the head and shoulders reversal.
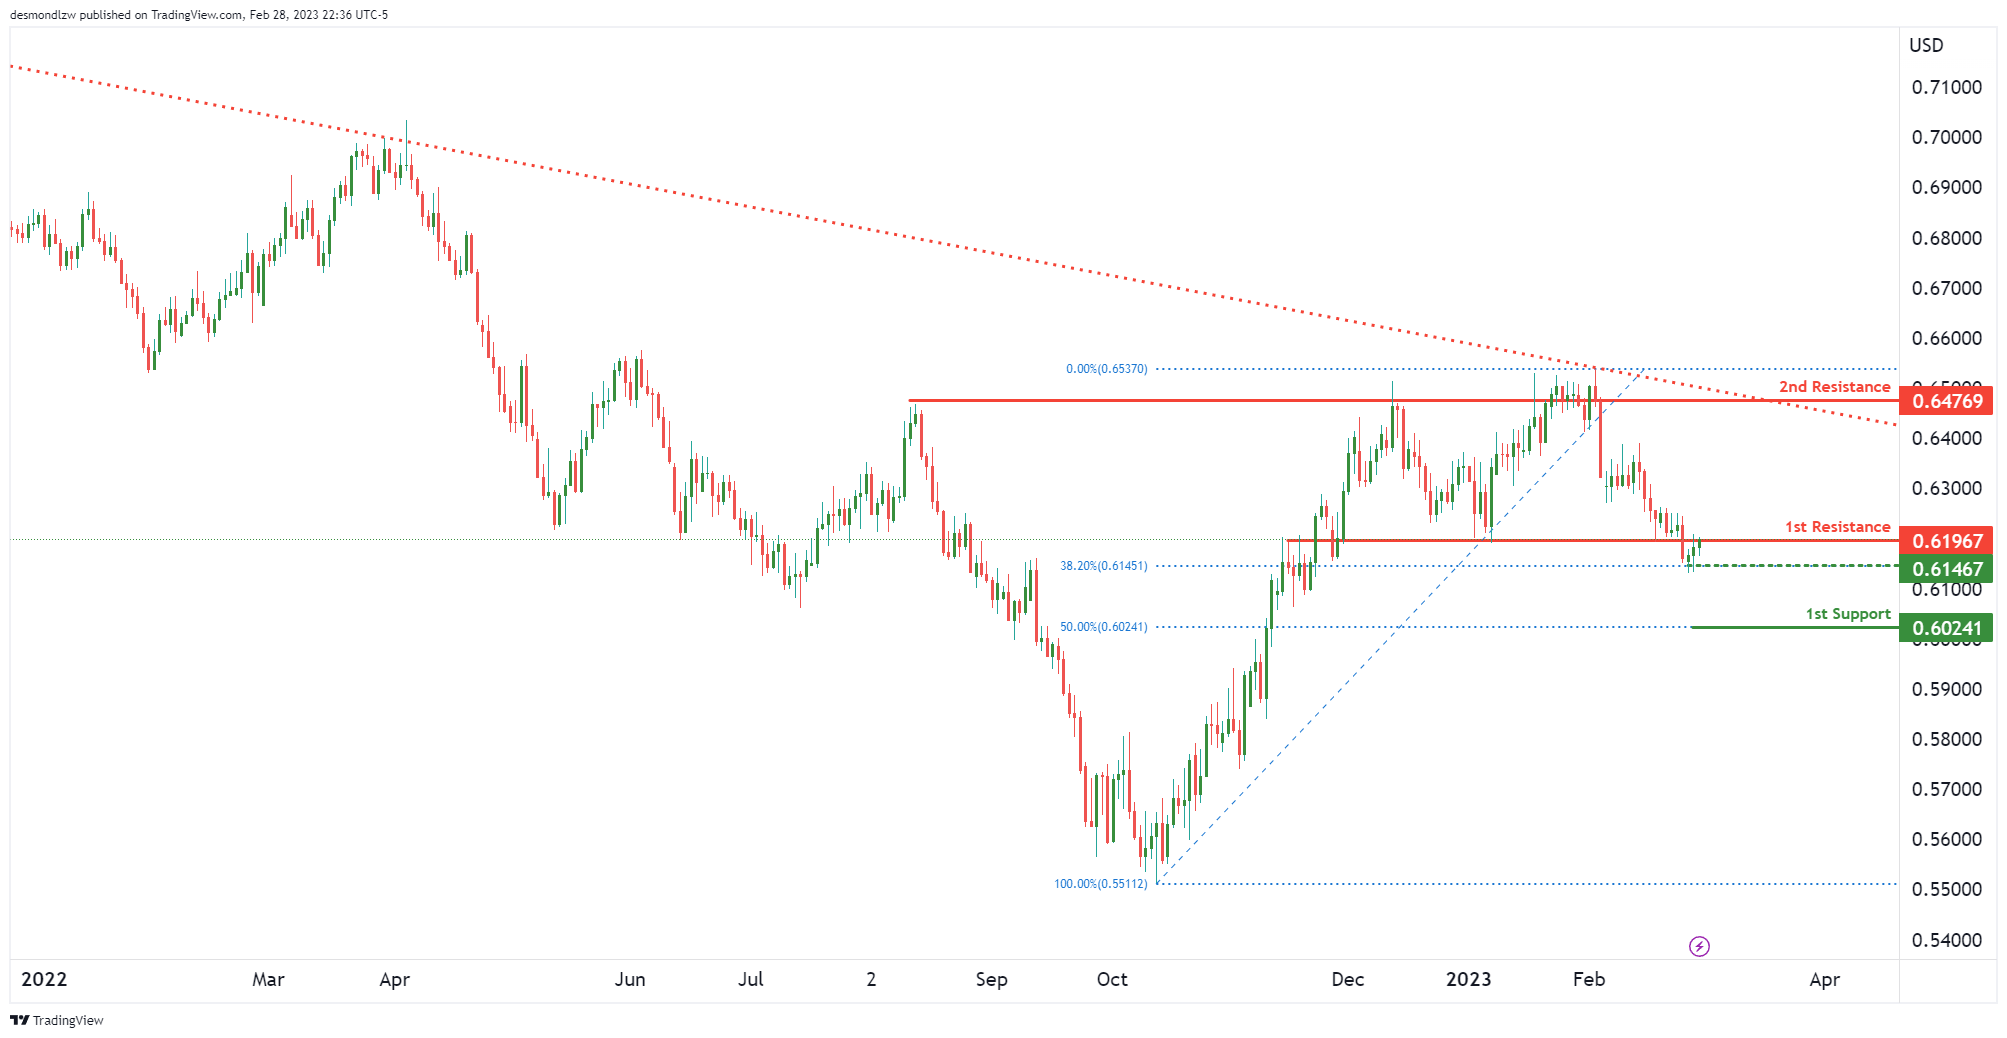
NZD/USD:
Price has broken the 1st support-turned-resistance at 0.6196 which would lead us to think we could be seeing a double top reversal. However, there is an intermediate support at 0.6146 which is line with the 38.2% Fibonacci retracement. Price needs to break this intermediate support to confirm a double top reversal which might push prices down to 1st support at 0.6024 – which also happents to line up with the 50% Fibonacci retracement.
However, if prices were to rise from here, we could see if rise to the 2nd resistance at 0.6474 which has seen multiple swing highs react off it in the past.
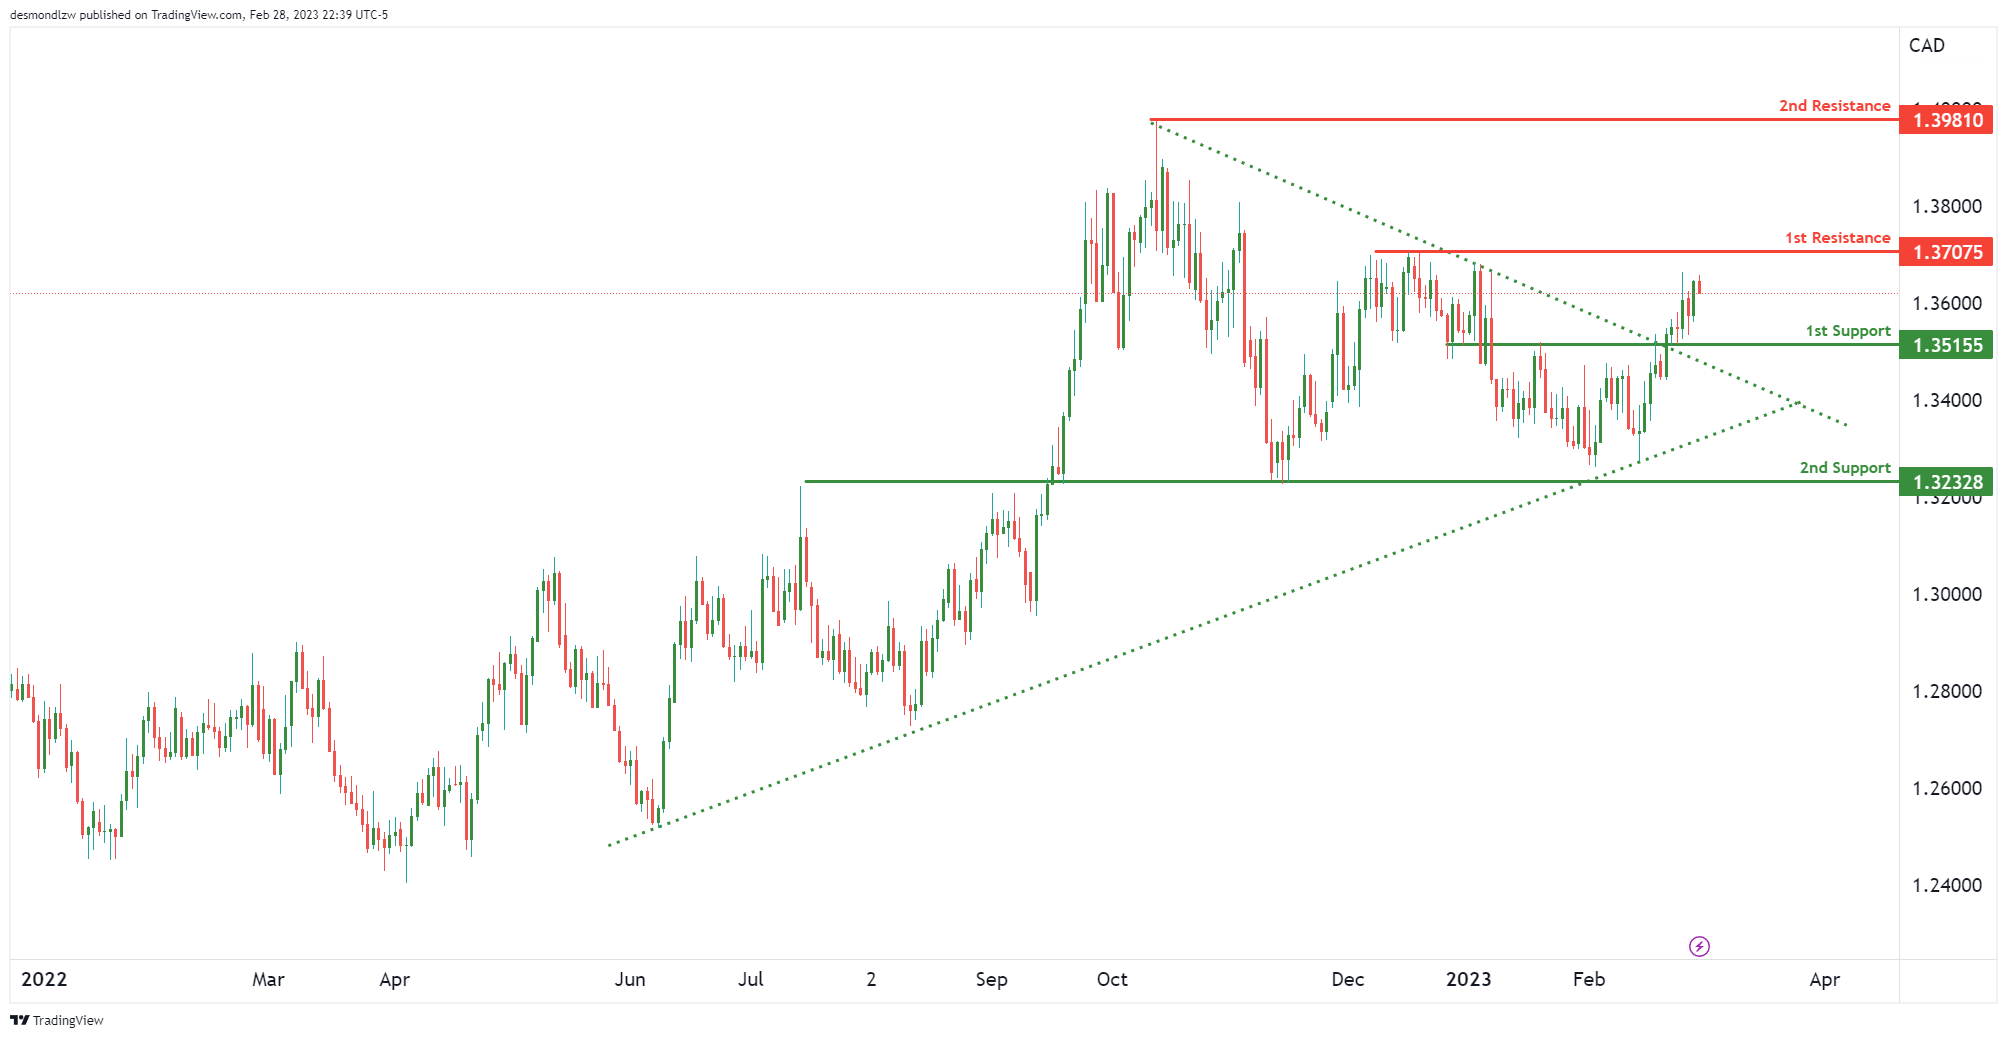
USD/CAD:
We can see an ascending support line push prices up stretching all the way back to June 2022. Along with that, price has also recently broke a descending resistance-turned-support line with our 1st support at 1.3515 which is the breakout level + the overlap support.
The 1st resistance to take note of is at 1.37070 which is a recent swing high. Price needs to break this to trigger a bigger move up to 1.3981.
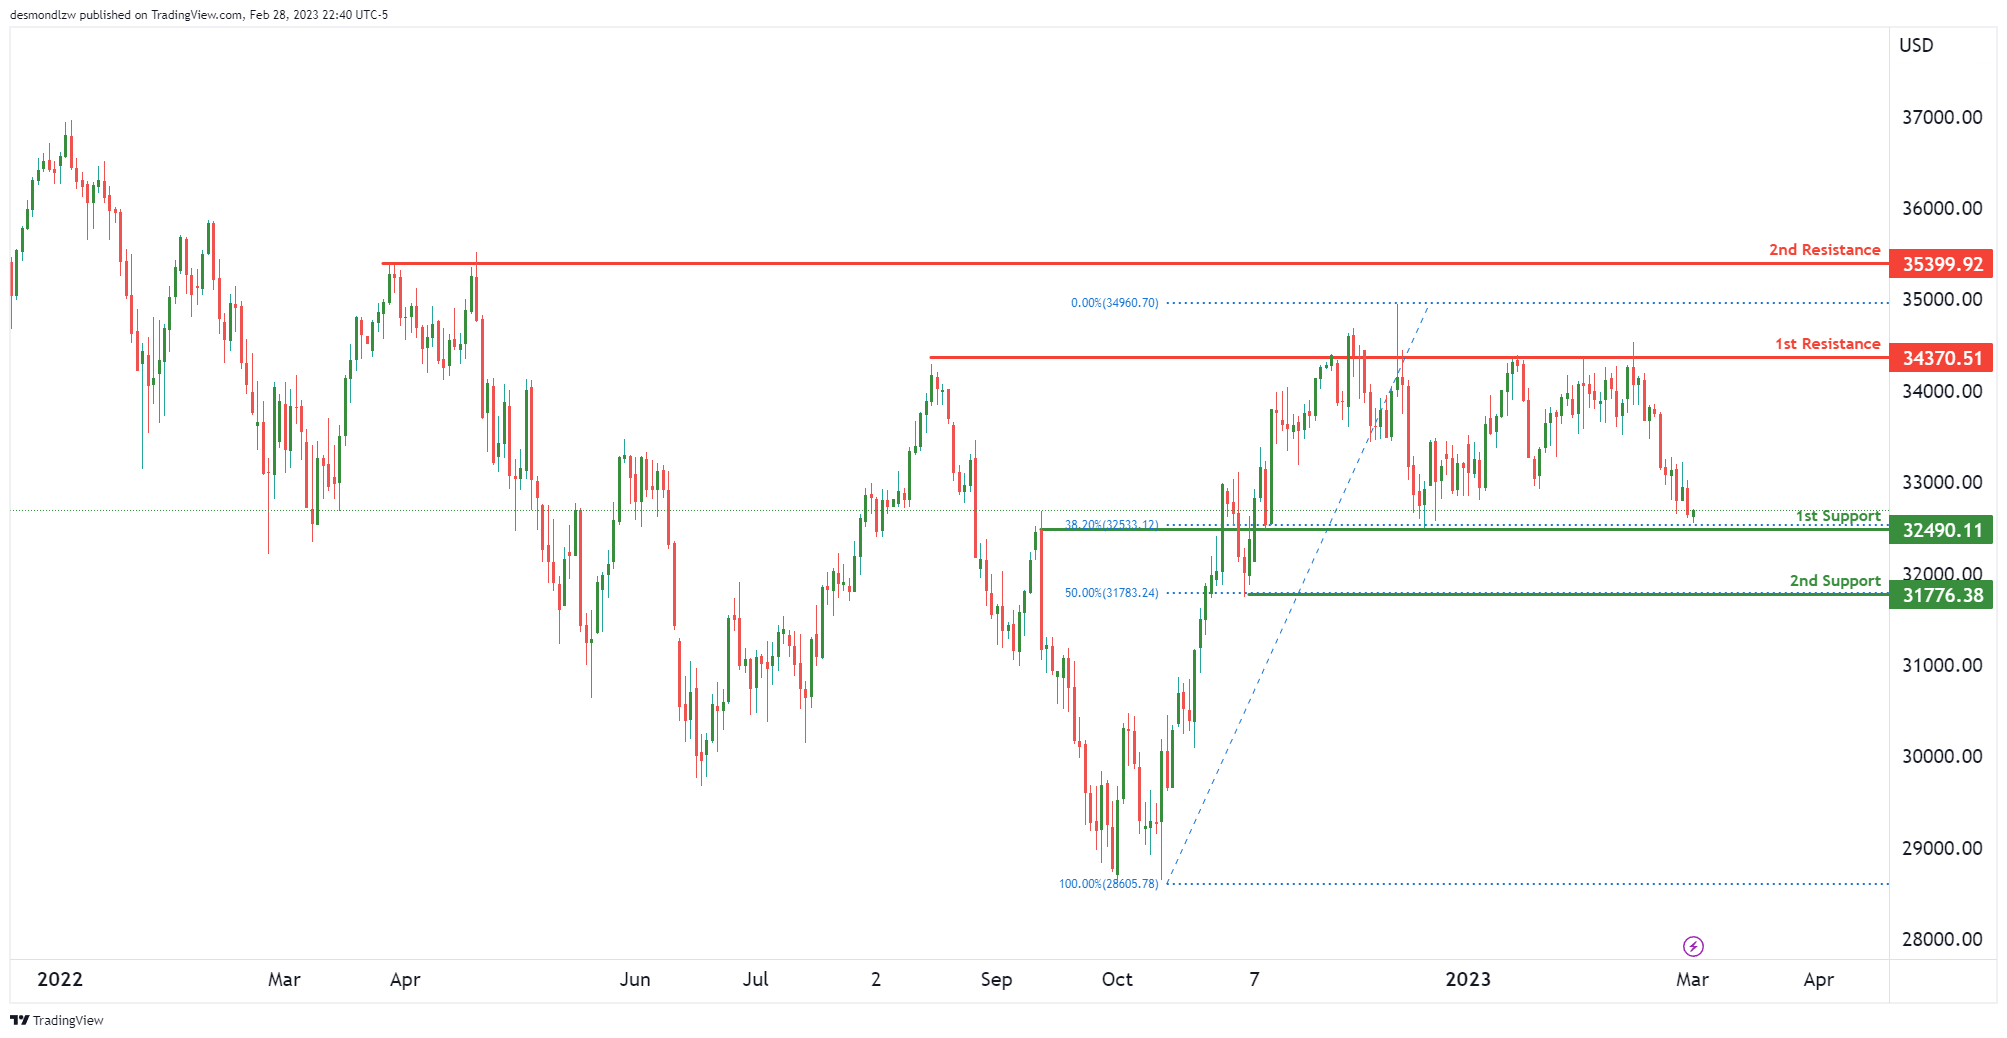
DJ30:
Price is testing our 1st support at 32490 which is a strong overlap support that also lines up with our 38.2% Fibonacci retracement. Price needs to break this level to trigger a small drop to 2nd support at 1.31776 which is a small swing low support lining up with the 50% Fibonacci retracement.
If price were to bounce from here, we could see a push up to 34370 which is our 1st resistance with multiple swing highs reacting off that level. Breaking that level, the next resistgance would be at 35399 which is also another swing high.
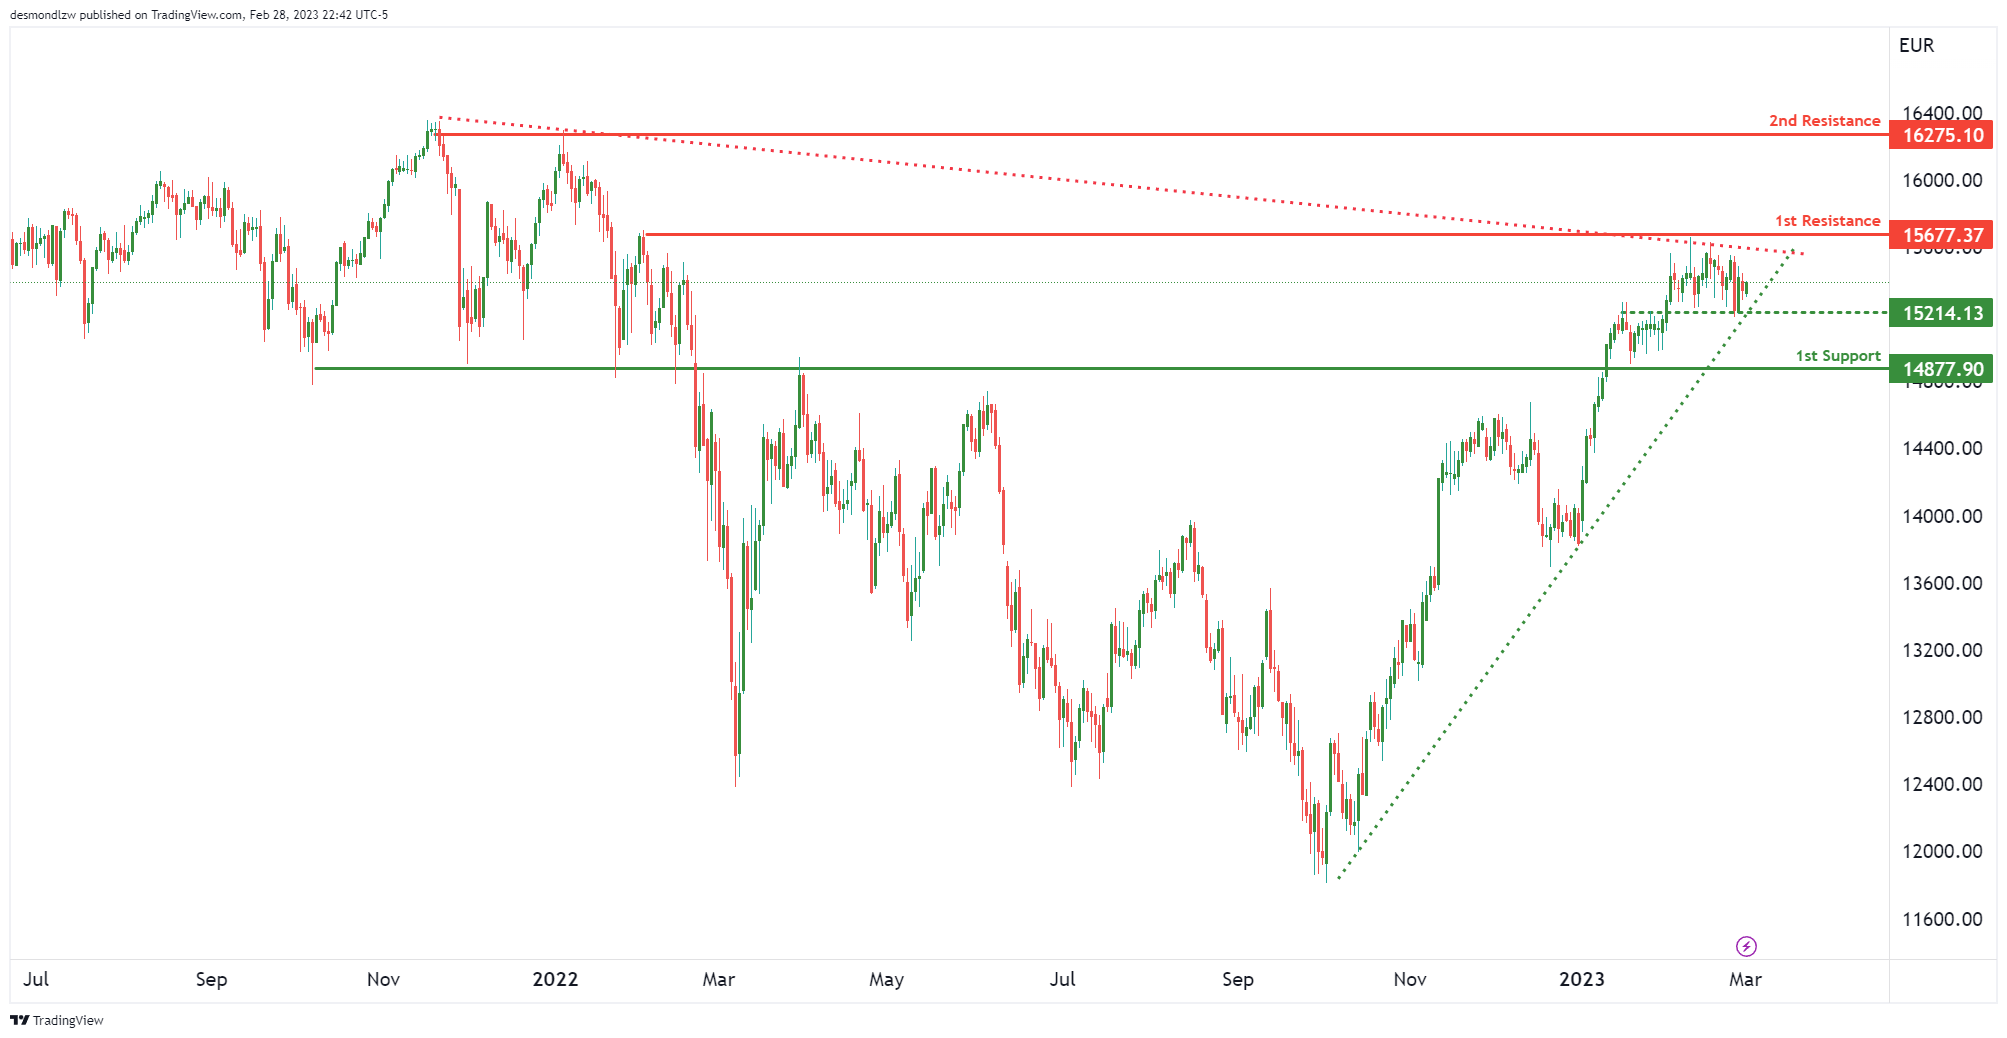
DAX:
We can see prices being squeezed between an ascending support line and a descending resistance line. In terms of key levels, 15677 is our 1st resistance and 15214 is our intermediate support. If price were to break this intermediate support and the ascending support line, the first level price might drop to is at 14877 which is a strong overlap support.
In terms of resistance, if price were to break 15677, we could see a push up towards 16275 which is our 2nd resistance that lines up with multiple swing highs.
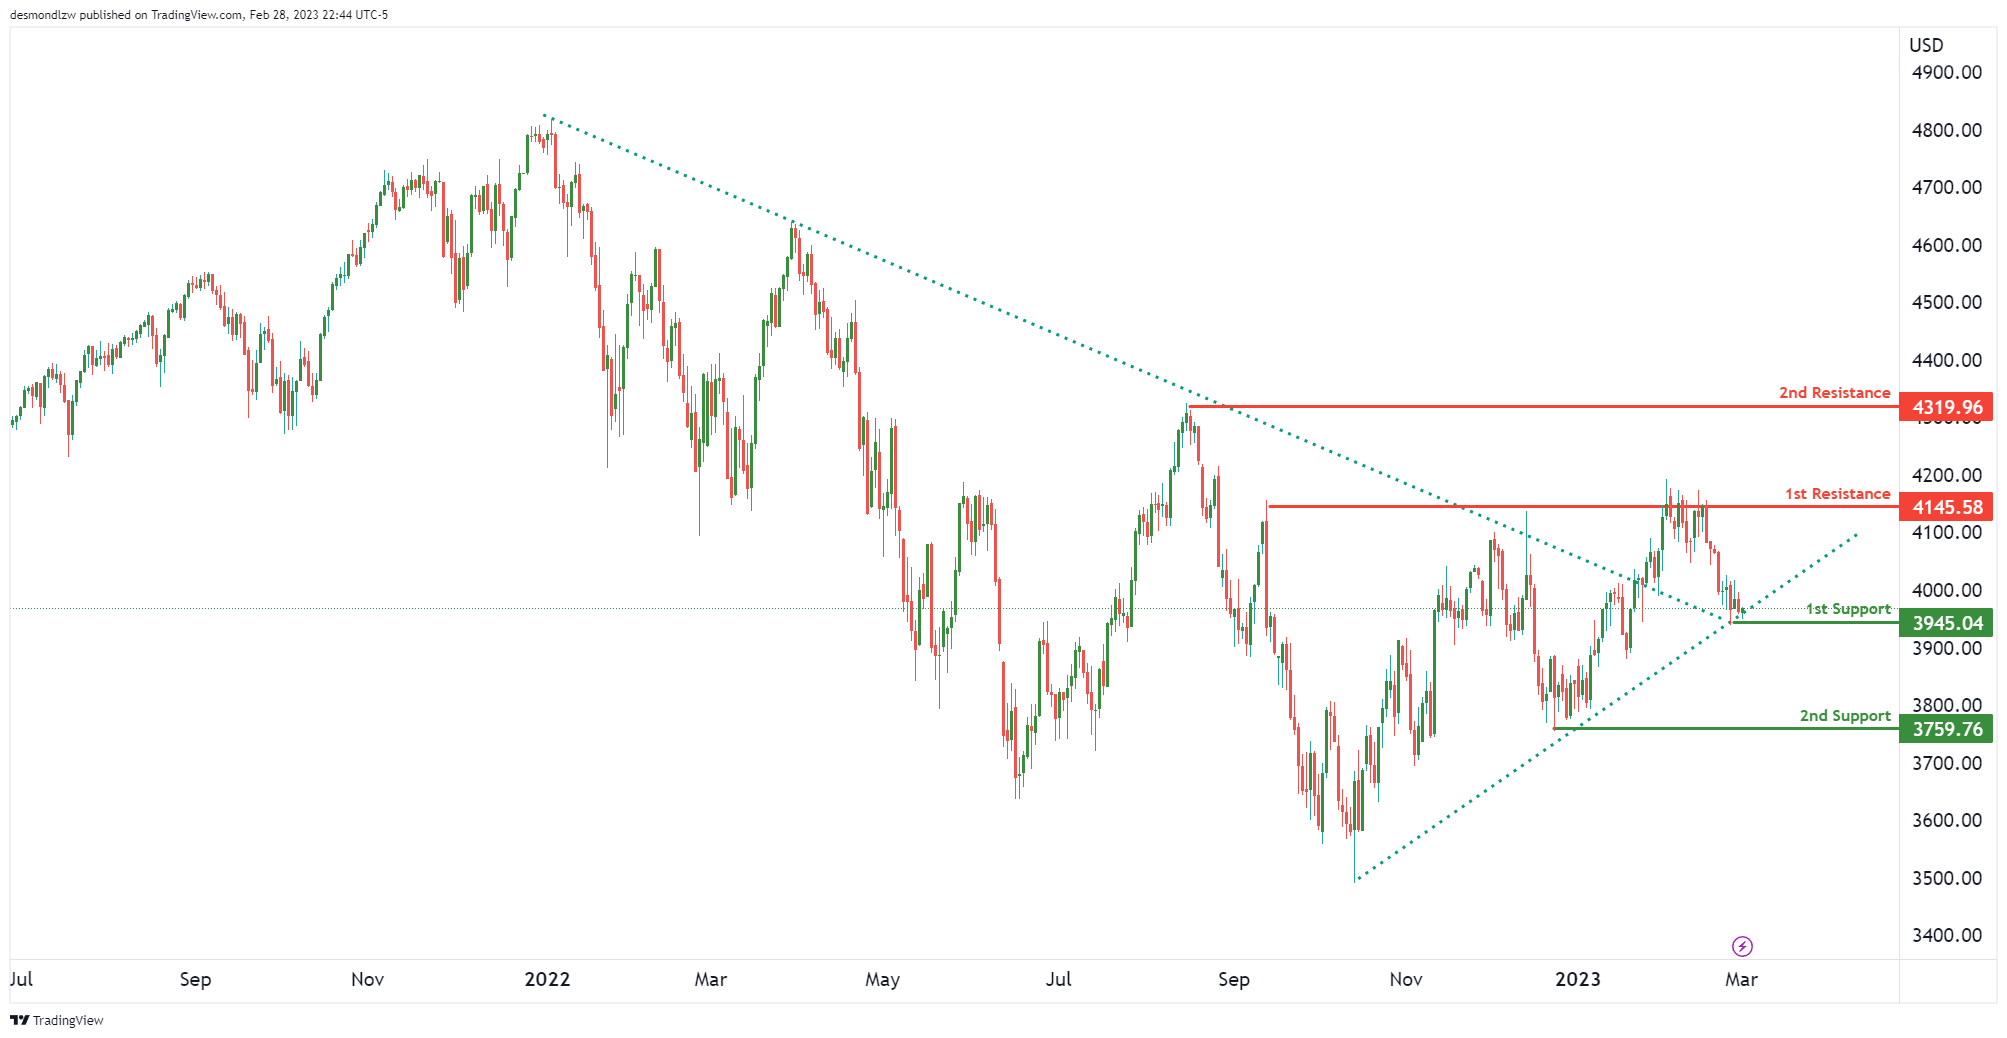
S&P500:
Price has broken our of our long term descending resistance-turned-support line and is also seeing a short term support line holding prices up quite nicely. Our 1st support is at 3945 and a bounce from here could see prices rise up to 4145 which is our 1st resistance htat lines up with multiple swing highs.
If prices were to break the ascending support line and our 1st support, we could see prices drop to the 2nd support at 3759 which lines up with a recent swing low.
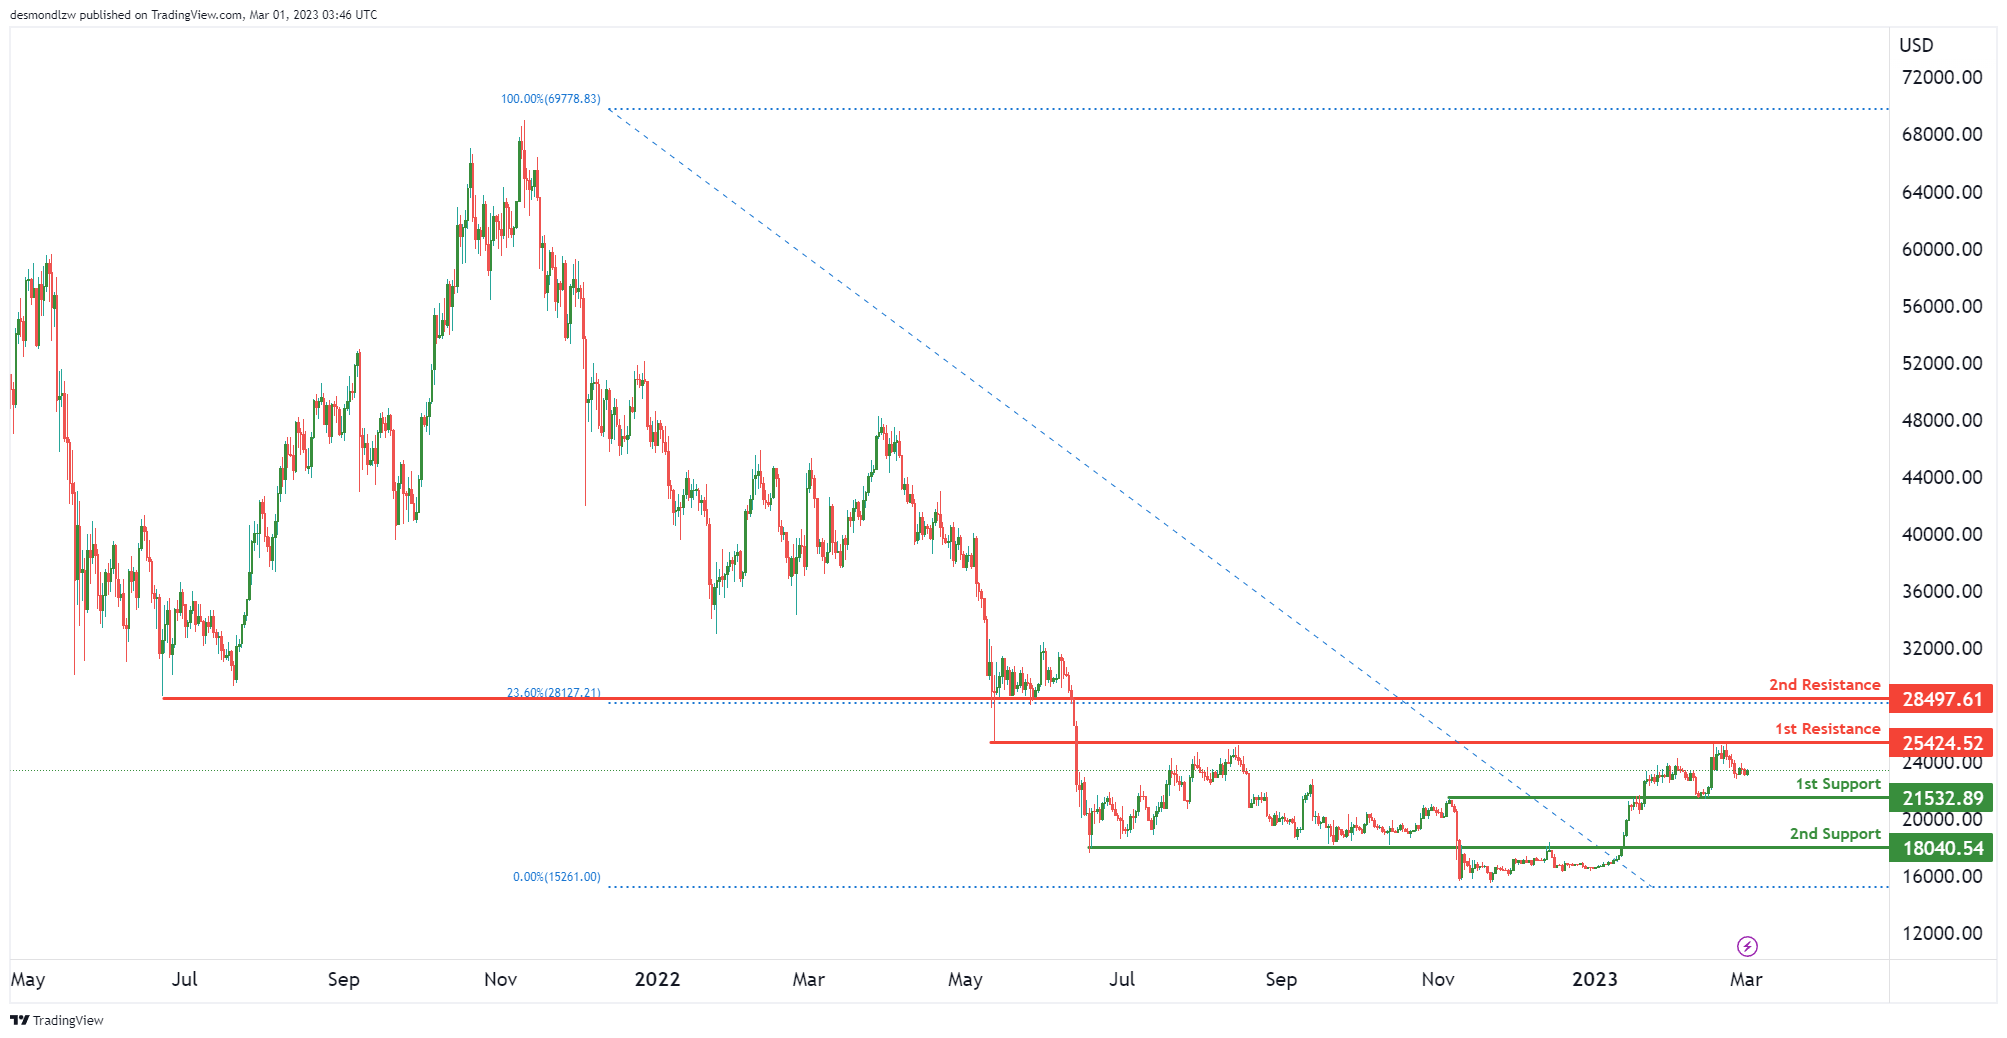
BTC/USD:
Price is in a bit of a range with the 1st key resistance at 25424 – which is an overlap resistance. If price were to break through this level, we could see it rise quite nicely to our 2nd resistance at 28497 which is a 23.6% Fibonacci retracement.
Our 1st support is at 21532 and a break of this level could see prices drop to 18040 – a strong overlap support.
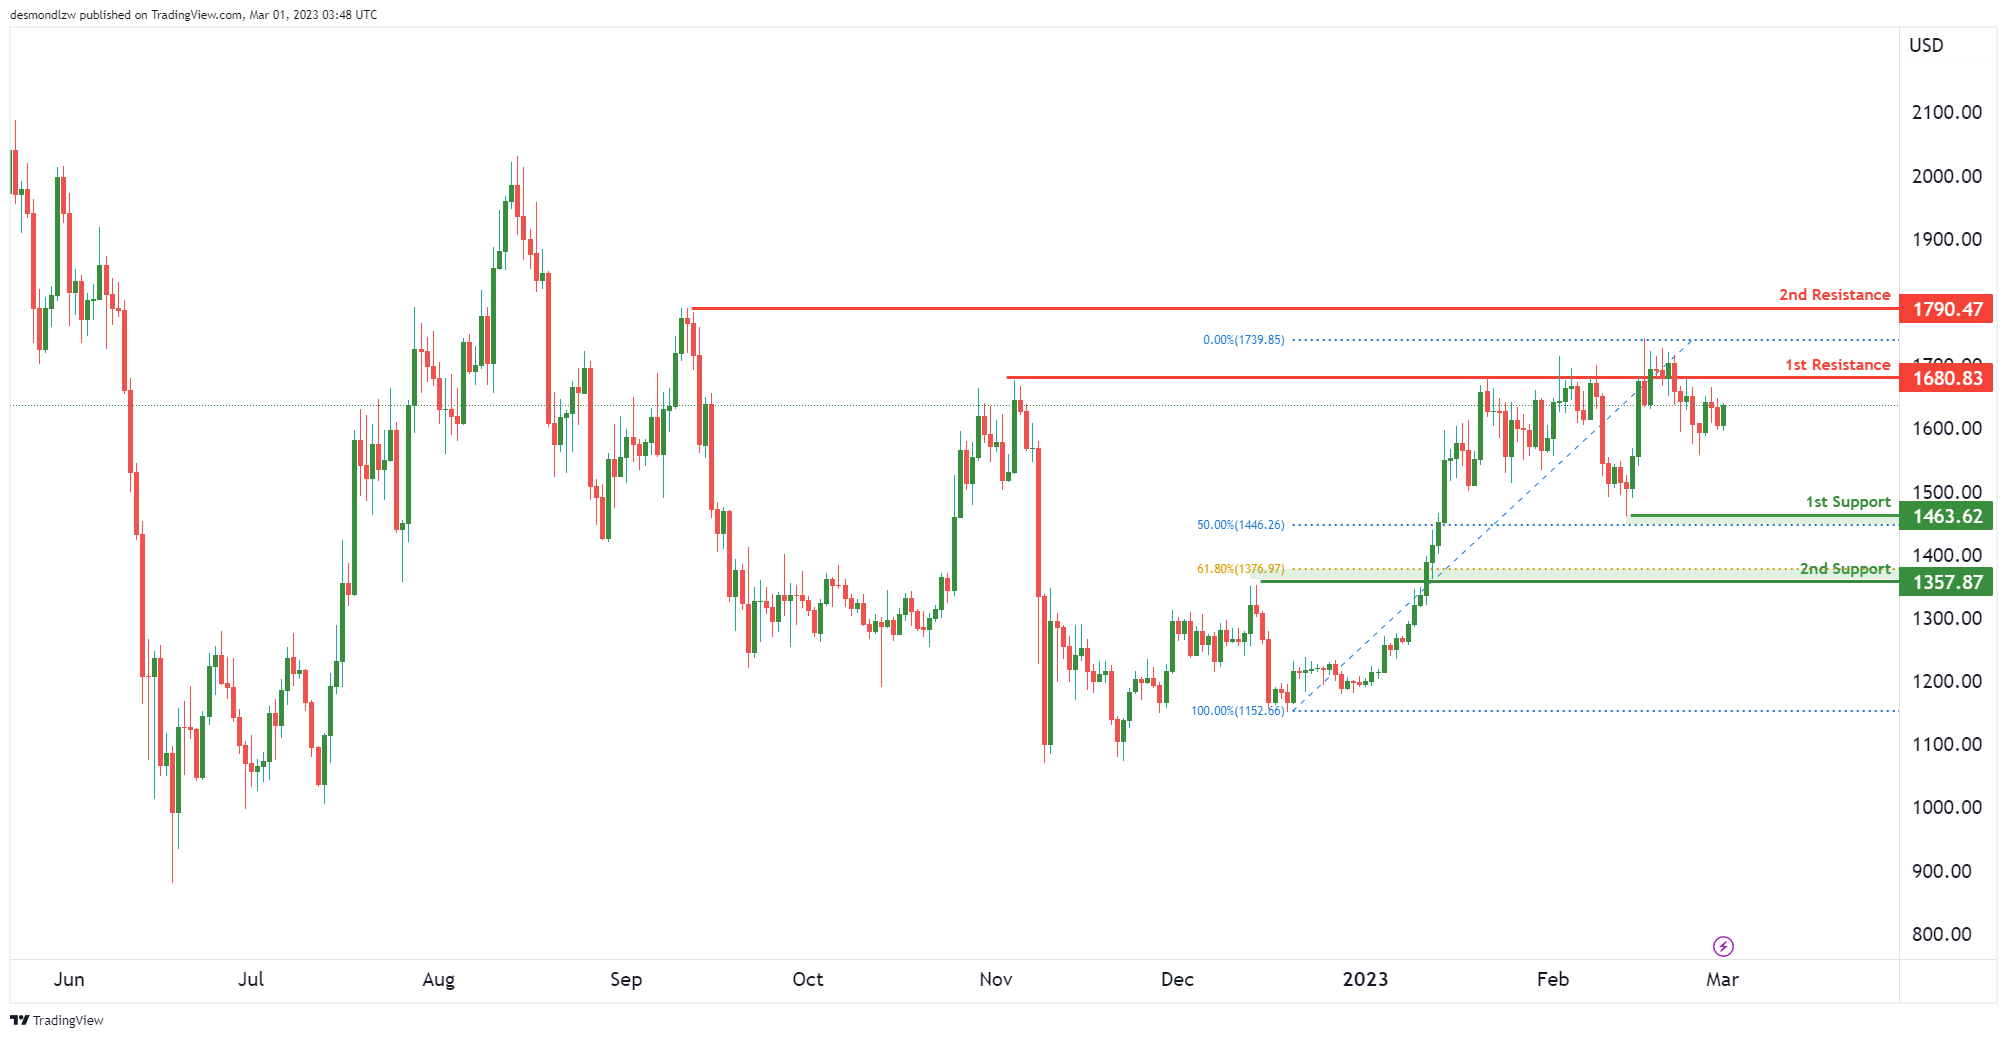
ETH/USD:
Price is testing a key resistance at 1680 which is a swing high resistance. A reversal from here could see prices first test the 1st support at 1463 which lines up with a 50% Fibonacci retracement and if prices were to break that, the next support would be a pullback support at 1357 that lines up with a 61.8% Fibonacci retracement.
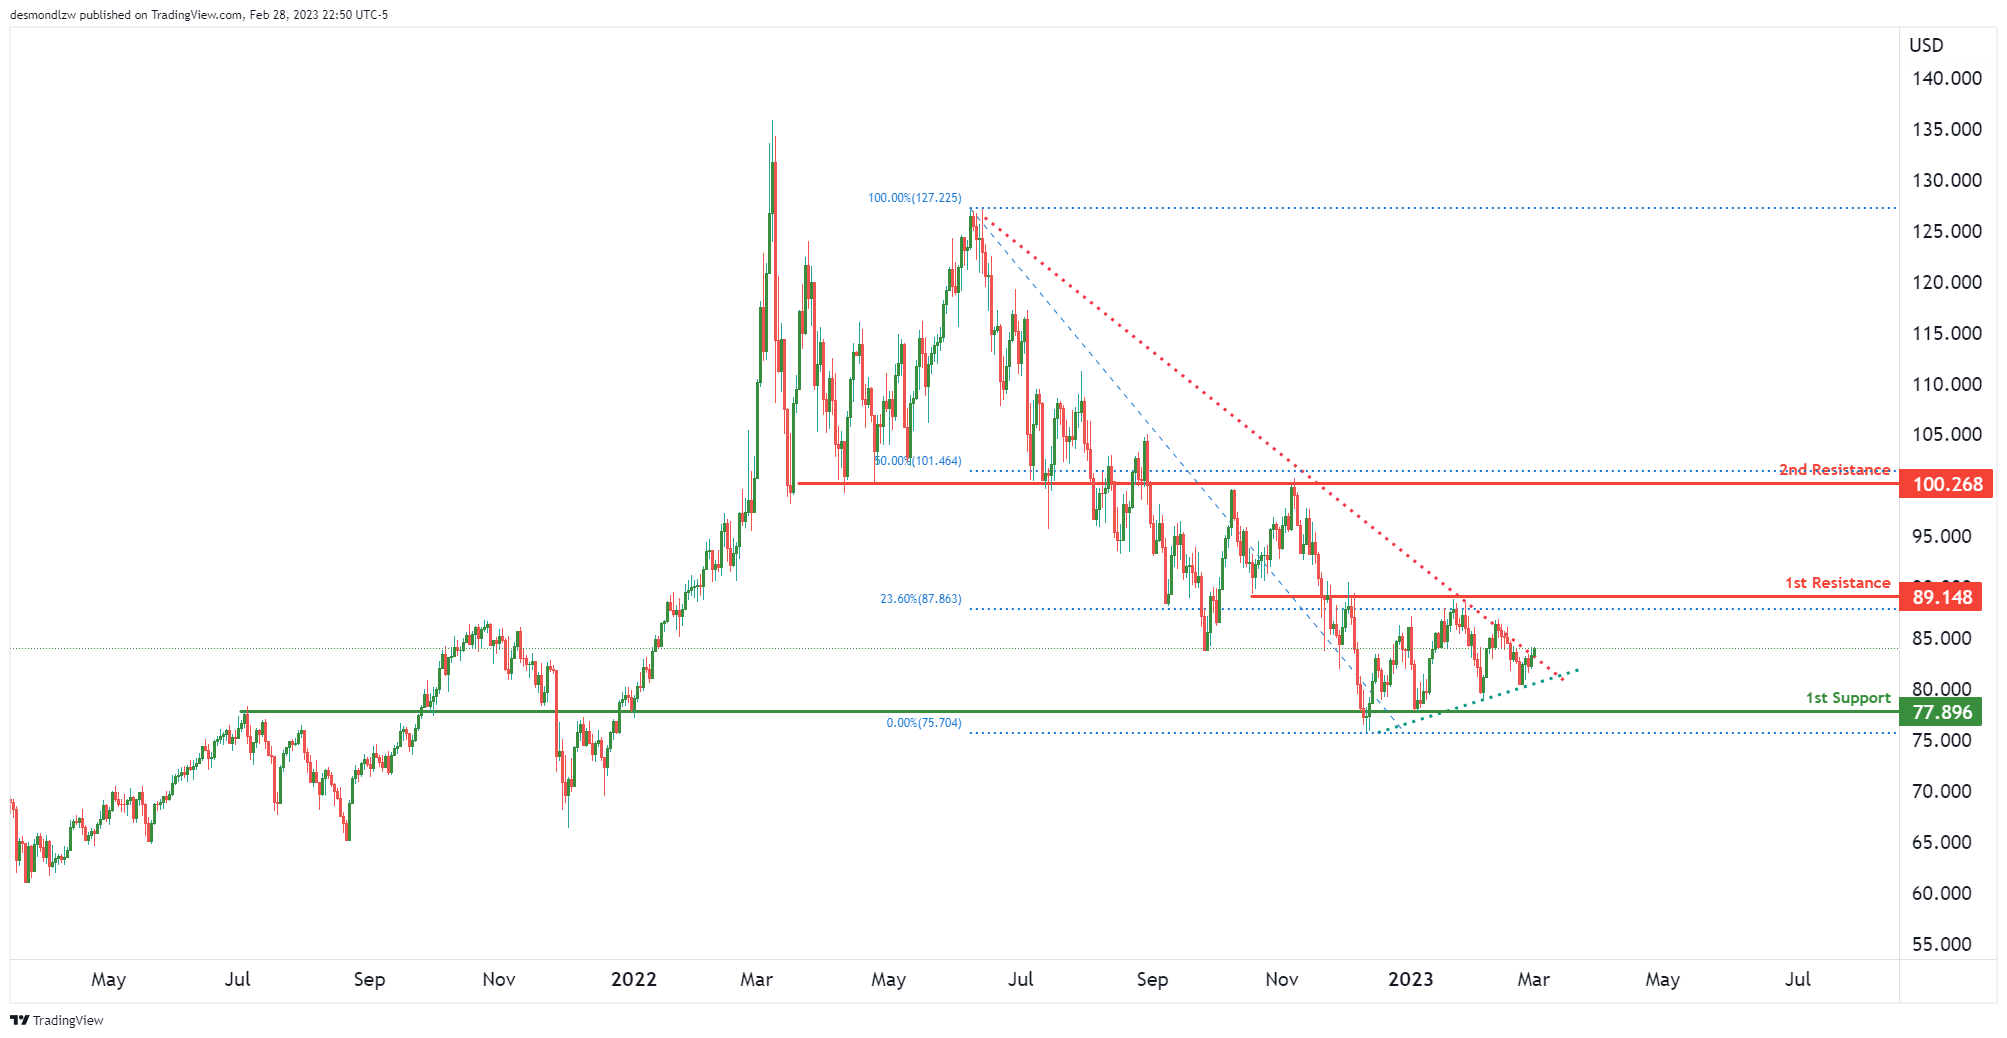
BCO/USD:
We’re seeing price being squeezed from an ascending support and a descending resistance. In terms of key levels, the 1st key resistance is at 89.14 which is an overlap resistance lining up with a 23.6% Fibonacci retracement. Breaking that level could suggest prices might make a push up to 2nd resistance at 100.26 which is the 50% Fibonacci retracement.
In terms of support levels, the key one we’re looking at is at 77.89 which is an overlap support.
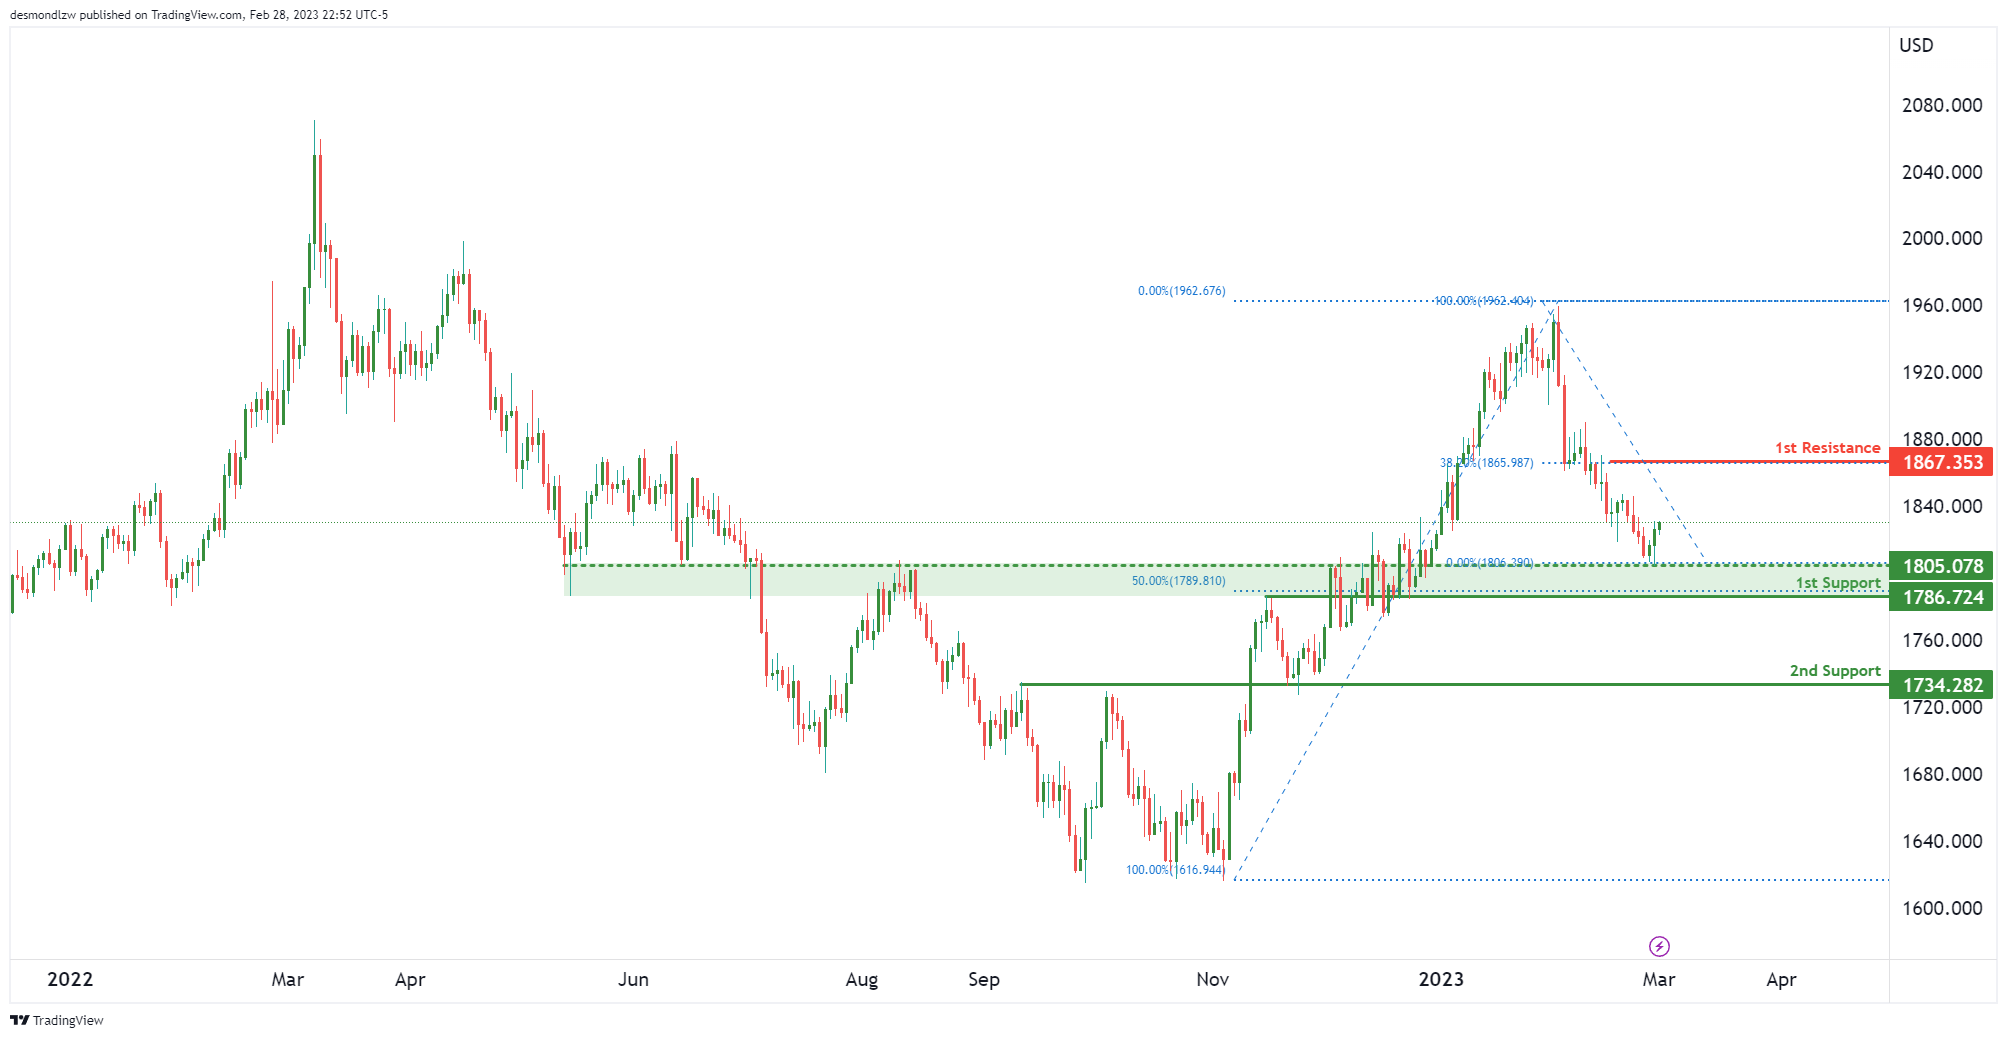
XAU/USD (GOLD):
Price is testing a key 1st support at 1786 area which is a 50% Fibonacci retracement lining up with an overlap support. If price were to bounce from here, it could potentially rise to 1st resistance at 1867 which is a 38.2% Fibonacci retracement.
Breaking the 1st support might trigger a move down to 2nd support at 1734 – this is an overlap support that is slightly below the key 61.8% Fibonacci retracement.
The accuracy, completeness and timeliness of the information contained on this site cannot be guaranteed. IC Markets does not warranty, guarantee or make any representations, or assume any liability regarding financial results based on the use of the information in the site.
News, views, opinions, recommendations and other information obtained from sources outside of www.icmarkets.com, used in this site are believed to be reliable, but we cannot guarantee their accuracy or completeness. All such information is subject to change at any time without notice. IC Markets assumes no responsibility for the content of any linked site.
The fact that such links may exist does not indicate approval or endorsement of any material contained on any linked site. IC Markets is not liable for any harm caused by the transmission, through accessing the services or information on this site, of a computer virus, or other computer code or programming device that might be used to access, delete, damage, disable, disrupt or otherwise impede in any manner, the operation of the site or of any user’s software, hardware, data or property.


