
A note on lower timeframe confirming price action…
Waiting for lower timeframe confirmation is our main tool to confirm strength within higher timeframe zones, and has really been the key to our trading success. It takes a little time to understand the subtle nuances, however, as each trade is never the same, but once you master the rhythm so to speak, you will be saved from countless unnecessary losing trades. The following is a list of what we look for:
- A break/retest of supply or demand dependent on which way you’re trading.
- A trendline break/retest.
- Buying/selling tails/wicks – essentially we look for a cluster of very obvious spikes off of lower timeframe support and resistance levels within the higher timeframe zone.
- Candlestick patterns. We tend to only stick with pin bars and engulfing bars as these have proven to be the most effective.
We search for lower timeframe confirmation between the M15 the H1 timeframes, since most of our higher-timeframe areas begin with the H4. Stops are usually placed 5-10 pips beyond confirming structures.
EUR/USD:
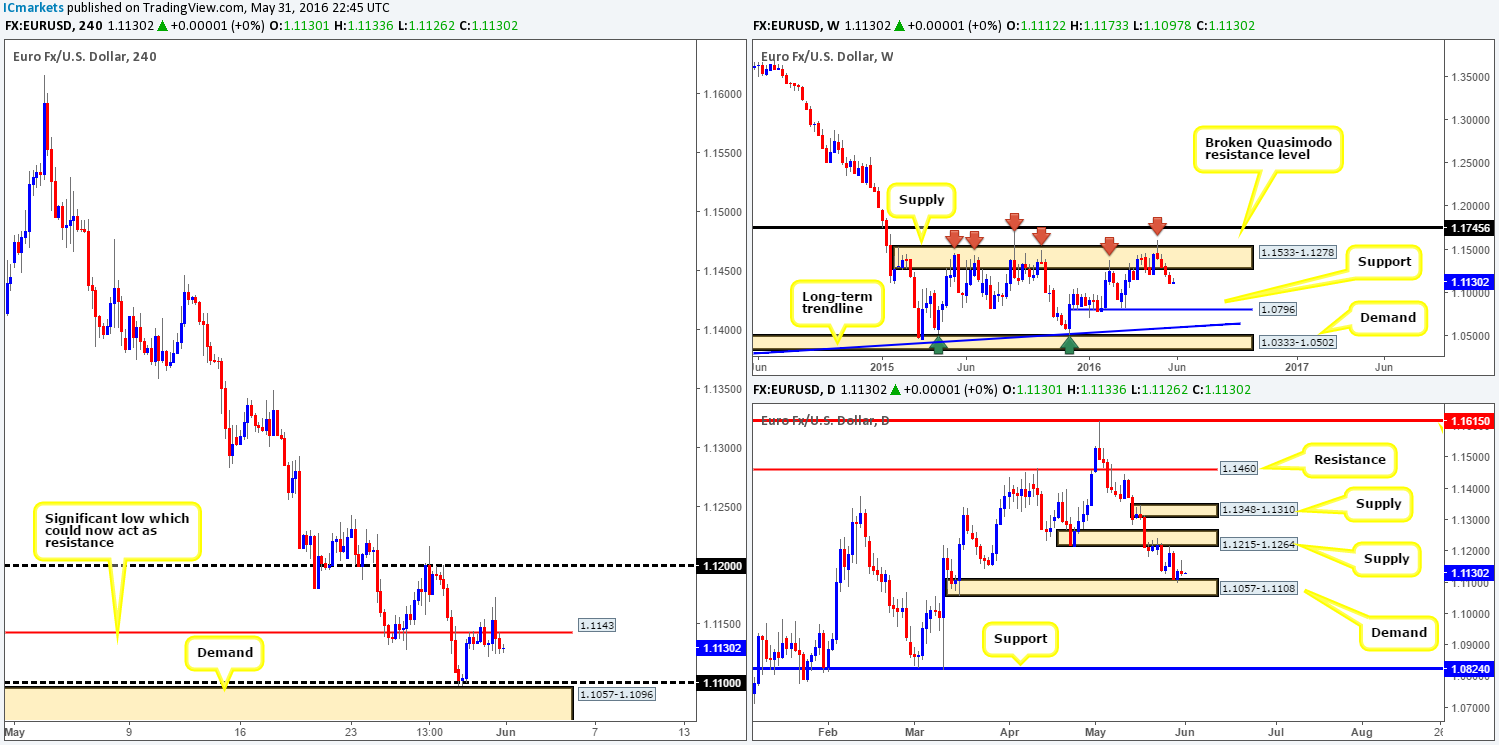
Starting from the top this morning, we can see that the EUR has been in a slump for the past four weeks since whipsawing through a major area of weekly supply at 1.1533-1.1278. Given that this weekly area has managed to cap upside in this market since May 2015, we feel further selling is possible down to weekly support drawn from 1.0796. Moving down a level, the daily chart shows a strong-looking selling wick took shape yesterday, following the bounce from daily demand at 1.1057-1.1108. This, as far as we see it, suggests that the buyers may be lacking here.
Stepping across to the H4 chart, yesterday’s action saw the EUR whipsaw through H4 resistance at 1.1143 amid the London/U.S. overlap, remaining below this line for the remainder of the day and closing with little change. Directly beneath current price, a H4 demand at 1.1057-1.1096 (sits within the extremes of the aforementioned daily demand) is seen, which is bolstered by the 1.11 handle. Above the current H4 resistance, the next objective to reach would likely be the 1.12 hurdle.
Our suggestions: In view of the above information, here are some areas you may want to consider today:
- With the USD/SEK trading from H4 support at 8.3108 (a market which is inversely correlated to the EUR/USD), and the EUR trading from H4 resistance at 1.1143, shorts could be possible down to H4 demand at 1.1057-1.1096.
- In the event that the bulls break above the present H4 resistance level, the path, at least on the H4 chart, appears clear up to the 1.12 mark. Taking a long trade on the break/retest of this H4 resistance would place one in-line with daily flow from demand at 1.1057-1.1108, but of course, against the current weekly selling (see above)!
- If price manages to connect with the current H4 demand today, longs are certainly something to keep in mind due to it sitting within the current daily demand base. However, take note that a buy from here puts you in direct conflict with weekly sellers.
For us personally, we are not impressed by the above, and as such will not be risking capital in this market today. Sometimes the best position of them all is to remain flat!
Levels to watch/live orders:
- Buys: Flat (Stop loss: N/A).
- Sells: Flat (Stop loss: N/A).
GBP/USD:
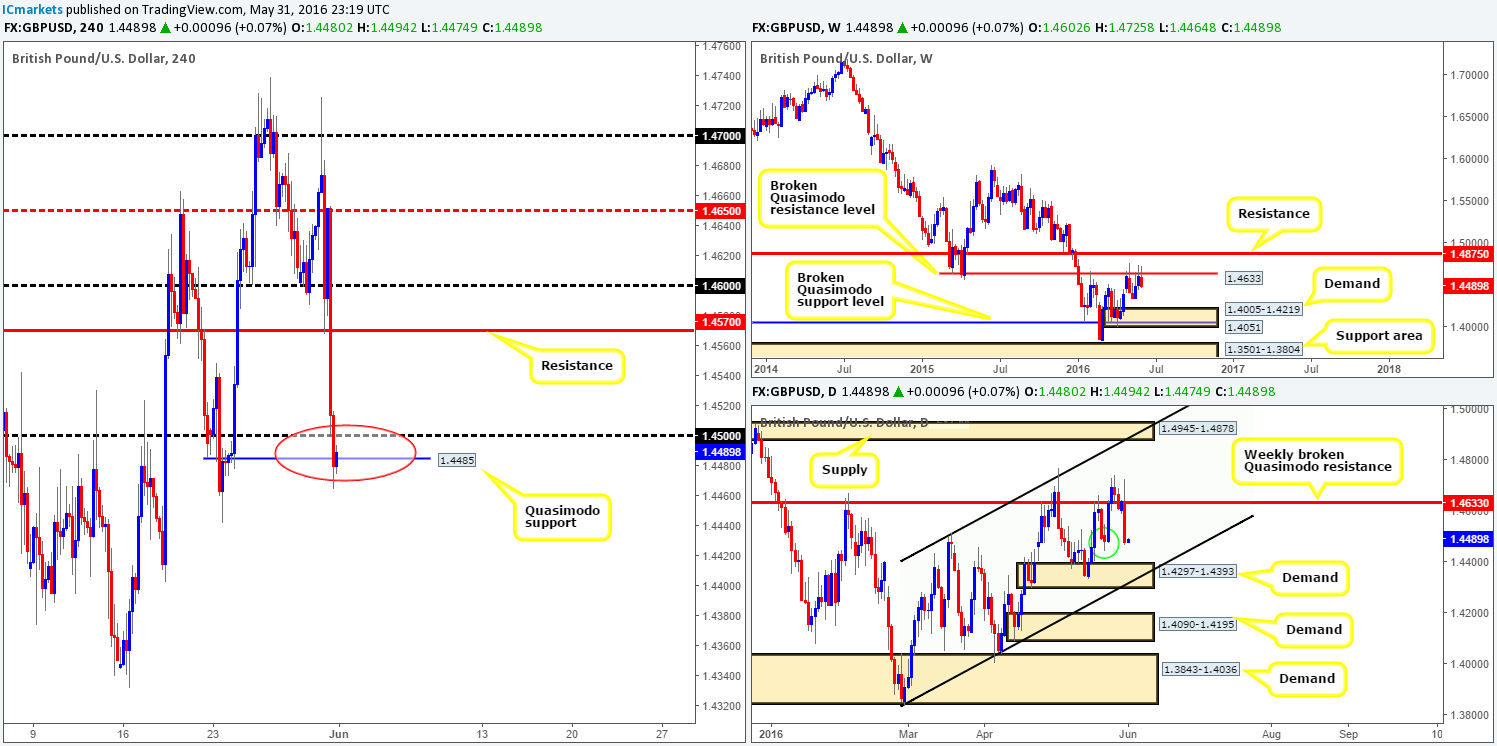
In recent sessions, Cable dived over 150 pips lower after the latest BREXIT polls showed the ‘leave camp’ gaining momentum. Through the simple lens of a technical trader, however, this drop should not really come as much of a surprise. Weekly action shows price has sold-off from a weekly broken Quasimodo barrier (BQM) seen at 1.4633 that has capped upside since the beginning of February. Nevertheless, for all the momentum traders out there looking to try and join this ‘trend’ today, we would advise caution! Check out the daily chart, price is, thanks to yesterday’s selling, now trading within a daily demand area seen marked with a green circle at 1.4442-1.4503. Furthermore, within this daily zone, we can see that there is a H4 Quasimodo support coming in at 1.4485, as well as the 1.45 handle lurking just above (red circle).
Our suggestions: Put simply, here is how we see things right now:
Watch for H4 price to close above the 1.45 handle. This would, in our book, suggest that the buyers are alert and, considering there is room to move above 1.45 to H4 resistance at 1.4570, a long on any retest seen at 1.45 may be something to consider. However, do bear in mind that lower timeframe confirmation would be required following a retest (see the top of this report for confirming techniques), due to what we’ve noted on the weekly picture (see above).
Levels to watch/live orders:
- Buys: Watch for price to consume 1.45 and then look to trade any retest seen thereafter (lower timeframe confirmation required).
- Sells: Flat (Stop loss: N/A).
AUD/USD:
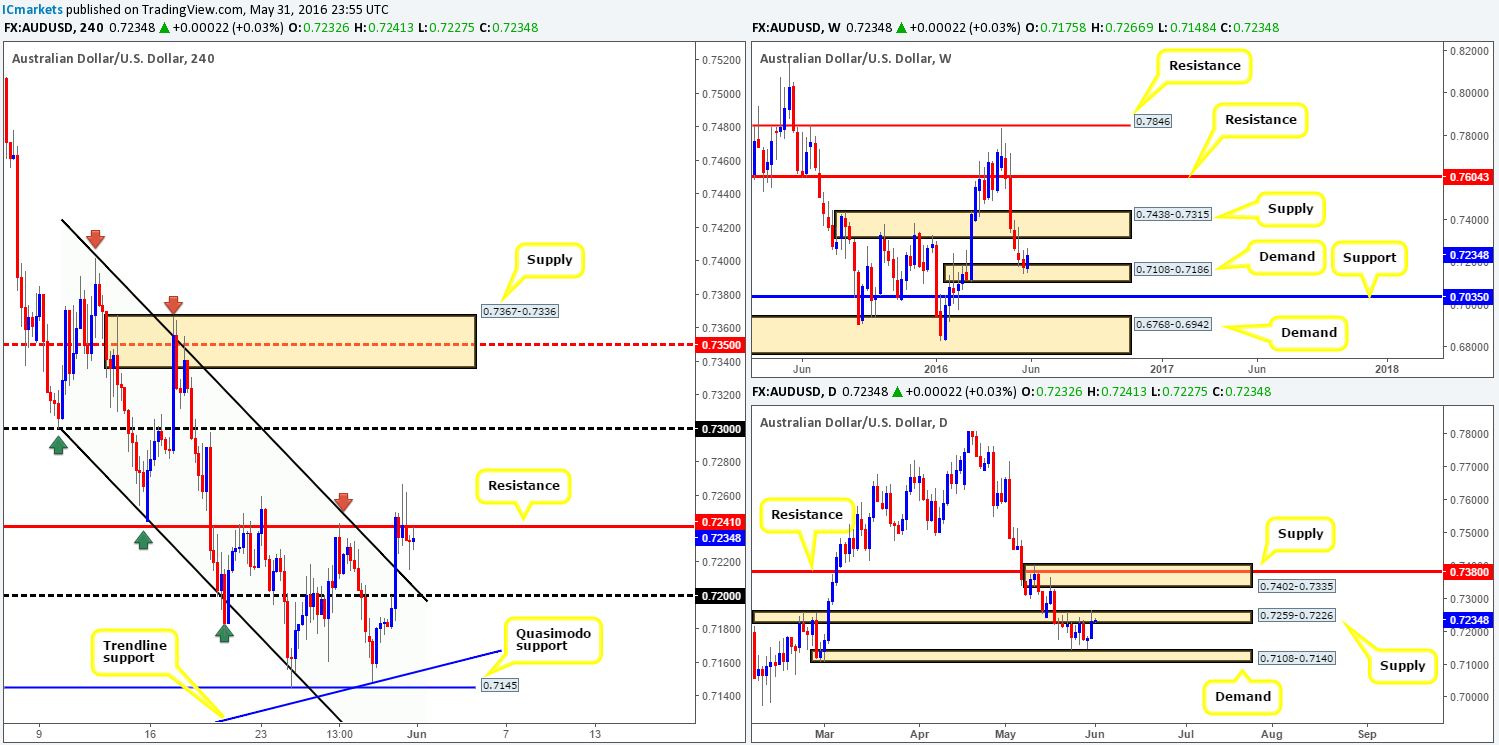
Coming at you directly from the pits of the weekly chart this morning, one can see that the bulls are beginning to wake up from weekly demand drawn from 0.7108-0.7186. In the event that this market continues to remain well-bid, we see little stopping the Aussie from connecting with weekly supply at 0.7438-0.7315. Sliding down into the daily chart, we can see that the recent buying seen from the aforementioned weekly demand area forced price to break above the daily supply zone carved from 0.7259-0.7226. However, it is still a little early to tell whether offers are drying up in this region. Let’s see what the H4 chart has to say on the matter…
The recent advance on the AUD has, as you can see, taken out H4 channel resistance (0.7402) and aggressively collided with offers around a H4 resistance barrier seen at 0.7241. Despite the clear back-to-back selling wicks visible here, our team has absolutely no interest whatsoever in shorting from here today. We will become interested in this level, however, if the market closes above this line!
Our suggestions: In light of the above points, today’s spotlight will firmly be focused on the H4 resistance 0.7241. A close above this level and subsequent retest will, in our opinion, set this market up for further buying. A close higher would not only demonstrate buying strength from the above said weekly demand, but it would also likely confirm offers have weakened within the current daily supply zone. Assuming the above setup plays out, we would, with a lower timeframe confirming signal, look to enter long, targeting the 0.73 handle (sits directly below weekly supply at 0.7438-0.7315 – the next upside target on that timeframe).
For ways of confirming a higher-timeframe level, in this case we’d simply look for an engulfed supply and subsequent retest, a trendline break and retest or even a collection of lower-timeframe buying tails around a lower-timeframe support line.
Levels to watch/live orders:
- Buys: Watch for price to consume 0.7241 and then look to trade any retest seen thereafter (lower timeframe confirmation required).
- Sells: Flat (Stop loss: N/A).
USD/JPY:
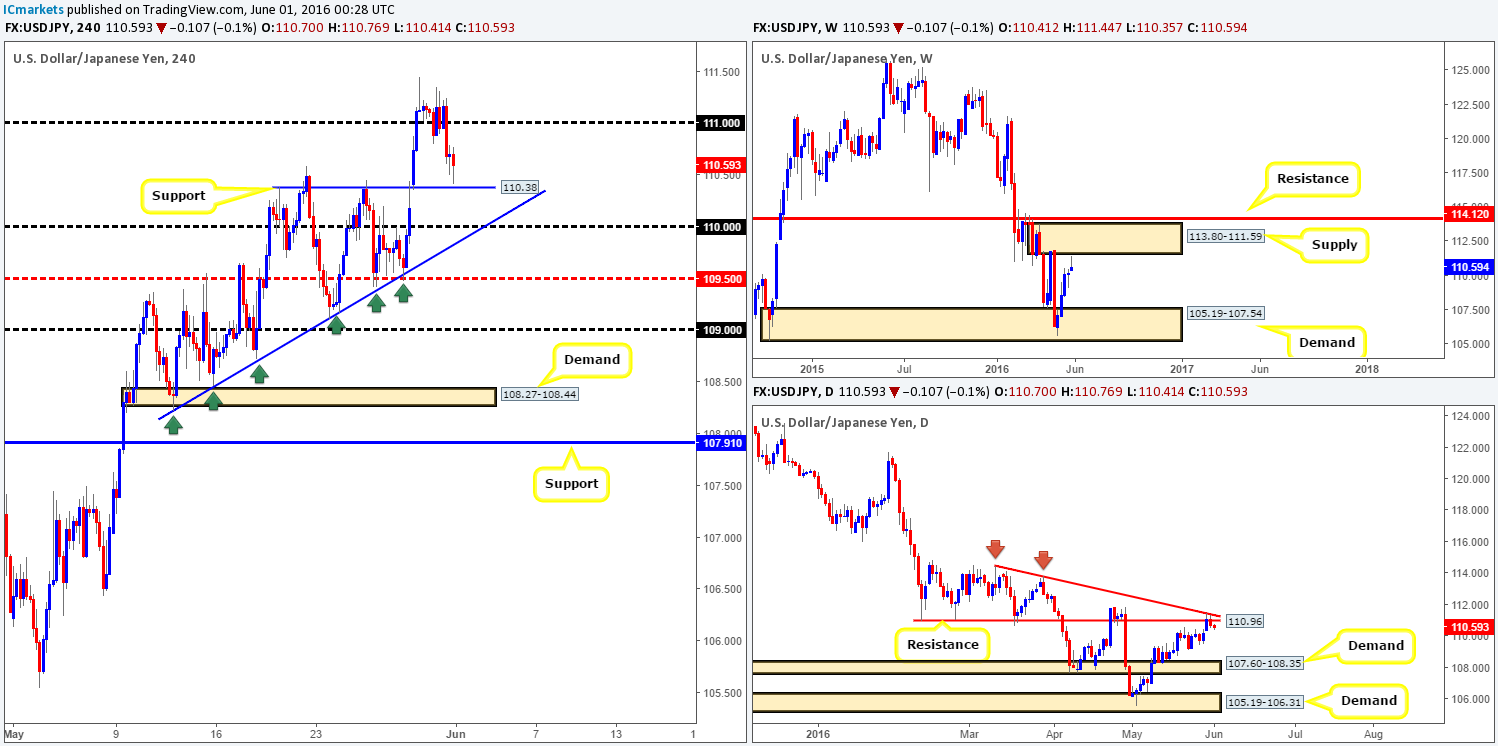
Following a bout of hesitation around the 111.00 band yesterday, the floor eventually gave way on lower-than-expected U.S. consumer confidence data and drove the market to lows of 110.50 on the day. With a H4 support seen at 110.38 now within touching distance, where does our team go from here?
Well, this recent selling, although supported by news data, was to be expected after price recently came within a few pips of connecting with weekly supply at 113.80-111.59 and also a daily resistance line at 110.96. Therefore, in regards to the current H4 support, we’re not expecting much more than a bounce from here.
Our suggestions: With the higher-timeframe picture in mind (see above), our team favors further selling in this market. As such, we will be closely watching price on this pair today for a break below both the 110.00 handle and the H4 trendline support extended from the low 108.22. If this comes to fruition, and price follows through with a retest of 110.00 as resistance, selling from here (preferably with lower timeframe confirmation – see the top of this report for information) down to the H4 mid-way support 109.50 is a high-probability move. Of course, do keep in mind that price can stretch much further than this thanks to where price is positioned on the higher timeframes.
Levels to watch/live orders:
- Buys: Flat (Stop loss: N/A).
- Sells: Watch for price to consume 110.00 and then look to trade any retest seen thereafter (lower timeframe confirmation required).
USD/CAD:
The USD/CAD rose to highs of 1.3133 yesterday, marking its third consecutive bullish day. An aggressive whipsaw was seen through H4 supply at 1.3076-1.3099, which could have been a move to take out stops to drive lower, since price is now trading within daily supply at 1.3218-1.3086. Therefore, it could be an idea to keep an eye on how the lower-timeframe action develops going forward from here for possible shorting opportunities down to the key 1.30 number.
Despite the recent advance, our team also has an alert placed around the H4 buy zone (yellow box) at 1.2970/1.30 due to the following converging structures:
- Daily support at 1.2970.
- The large psychological boundary 1.30.
- H4 trendline support extended from the low 1.2771.
- H4 61.8% Fibonacci support at 1.2978.
In regards to entering at this zone, however, waiting for lower-timeframe confirmation is still the more preferred route to take, as weekly price could jab lower to connect with weekly support at 1.2833 and essentially ignore our buy zone.
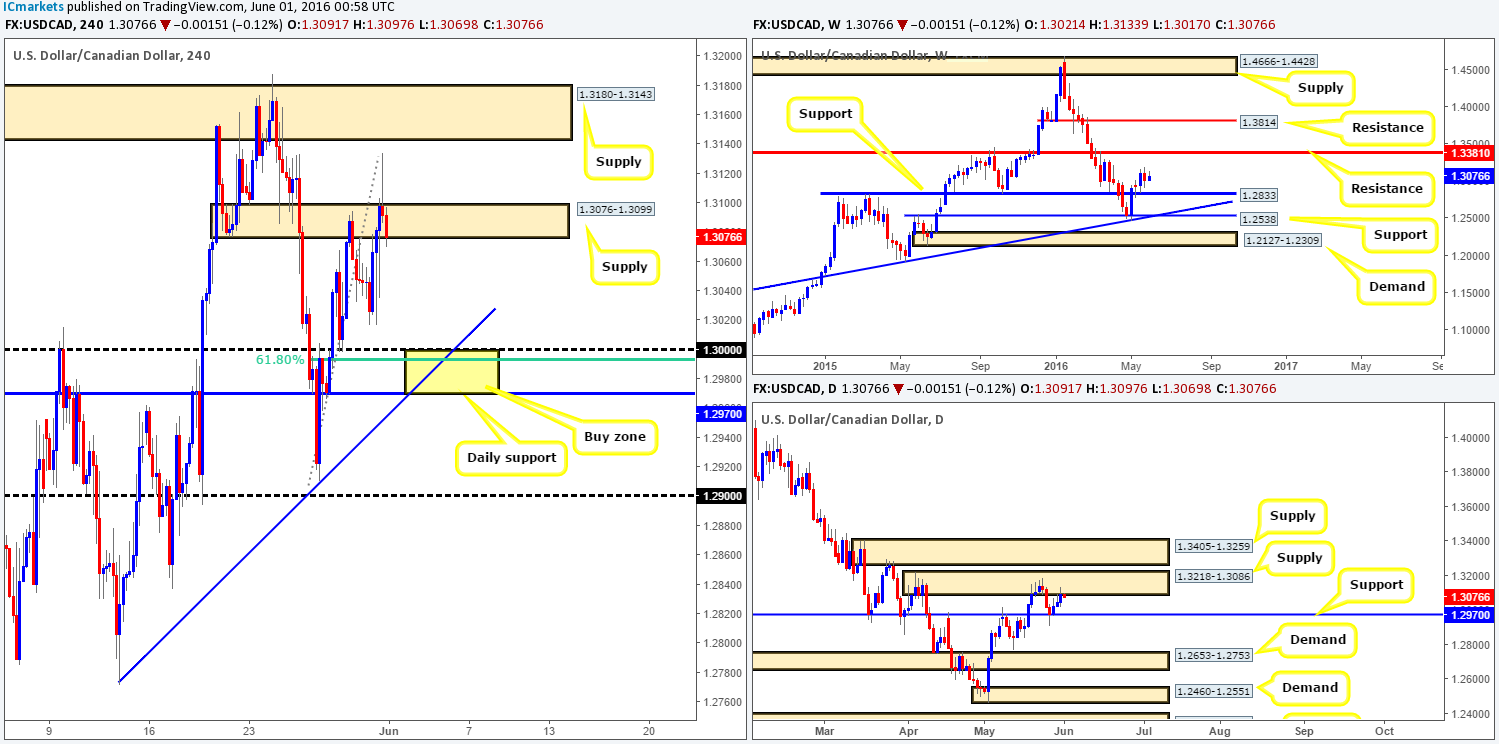
Levels to watch/live orders:
- Buys: 1.2970-1.3000 [Tentative – confirmation required] (Stop loss: dependent on where one confirms this area).
- Sells: 1.3076-1.3099 [Tentative – confirmation required] (Stop loss: dependent on where one confirms this area).
USD/CHF:
From the weekly chart this morning, we can see that the Swissy remains trading around the underside of a weekly supply area seen at 1.0092-0.9928. This area is quite large so there is a possibility that we may see further buying before sellers step in. Lower down on the daily chart, nevertheless, demand at 0.9913-0.9869 continues to hold this market higher. From this angle, the next upside target falls in at a daily Quasimodo resistance line at 1.0037, which is, as you can probably see, positioned beautifully within the above said weekly supply area. Stepping across to the H4 chart, the H4 mid-way resistance at 0.9950 has once again been brought into view, and is, at the time of writing, holding price lower as there are likely residual offers lurking around this region from Monday’s sell-off.
Our suggestions: In view of the above, here is what we have jotted down going forward:
- Watch for lower timeframe entries from 0.9950 today. This line is situated within the aforementioned weekly supply zone and saw a modest reaction on Monday, so there is a possibility this level may hold for a second time.
· Should 0.9950 fail, we’ll then focus on the daily Quasimodo resistance at 1.0037 coupled with 1.0000 (parity) to form a sell zone. Selling from here, you’d have both the weekly and daily structure alongside you (see above)! With that being said, our team would be comfortable entering at market from within this region (news dependent of course) with a stop placed above the apex of the current daily Quasimodo formation (1.0092).
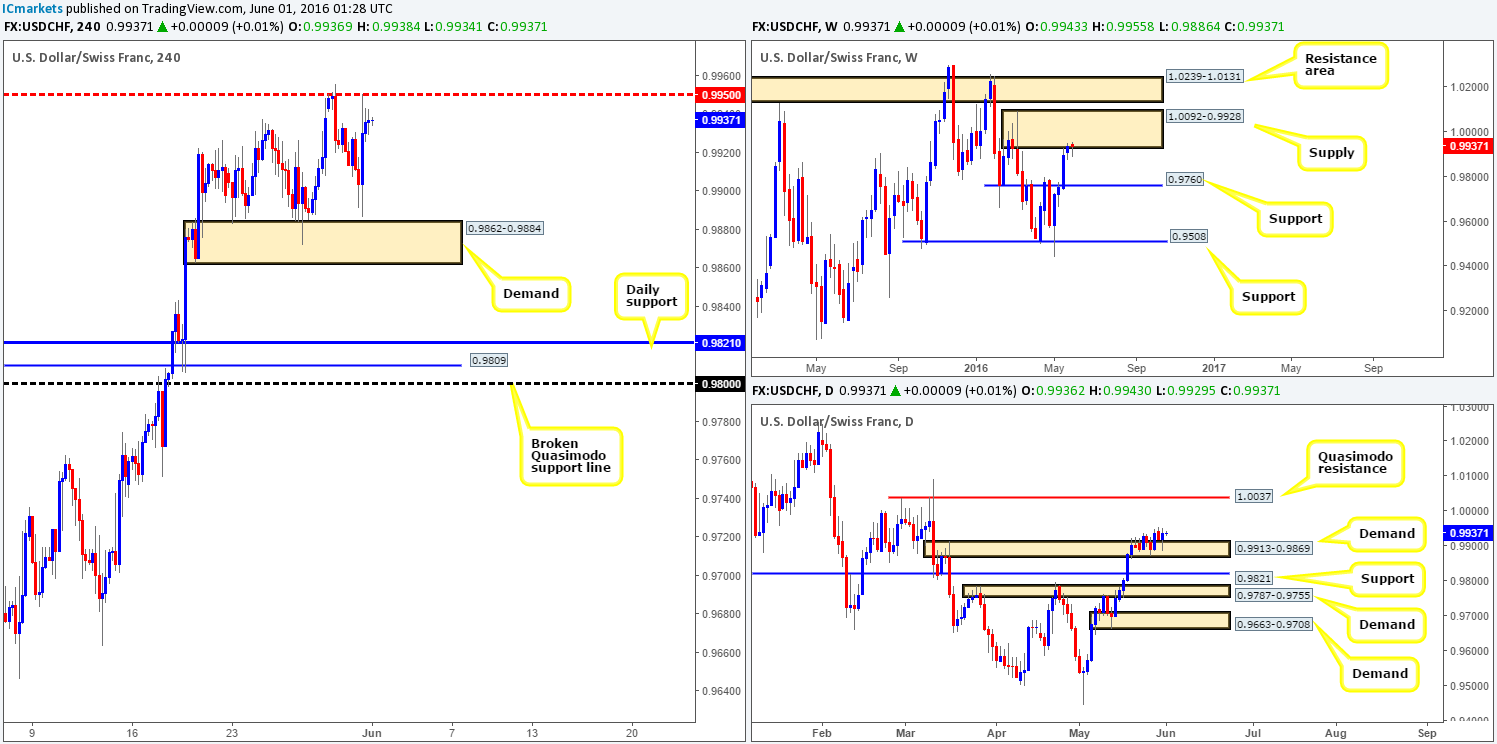
Levels to watch/live orders:
- Buys: Flat (Stop loss: N/A).
- Sells: 0.9950 region [Tentative – confirmation required] (Stop loss: dependent on where one confirms this area). 1.0037-1.0000 [Could possibly enter at market from this region – will depend on what news is due to be released] (Stop loss: dependent on how we decide to sell here, the safest stop placement, as we see it, would be above the apex of the daily Quasimodo formation).
DOW 30:
Going into the early hours of yesterday’s American session U.S. stocks fell sharply, consequently whipsawing through a H4 demand at 17801-17761. For those who read our previous report, this was a move to keep an eye on since price was also flirting with daily resistance at 17894! The only grumble of course was the fact that weekly price had just aggressively bounced from a weekly support area chalked up at 17446-17606. Well done to any of our readers who managed to jump aboard this one!
Pushing forward, this market remains a tricky beast. On the one hand, weekly bulls still appear in control and shows room to appreciate up to a weekly resistance area at 18365-18158. On the other hand, daily bears show room to extend lower down to daily demand coming in at 17396-17554. In addition to this, a H4 demand. As we just mentioned above, was just recently whipsawed, so lower prices could be on the horizon.
Our suggestions: As far as we see things, we have two options:
- On the assumption that bids are taken out from the H4 demand area at 17801-17761, traders could look for potential short trades from H4 supply at 17907-17872, which surrounds the daily resistance level mentioned above at 17894. We would still advise waiting for lower-timeframe confirmation here (see the top of this report for confirming techniques) since weekly buyers could continue to push higher (see above).
- In the event that the H4 supply fails, as well as its nearby H4 resistance above at 17920, this could provide an opportunity to trade long on any retest seen at this boundary, targeting the H4 Quasimodo resistance level at 18050 (located just below the daily supply zone at 18153-18073). From here you’d be trading in-line with weekly flow and have very little daily resistance to be concerned about!
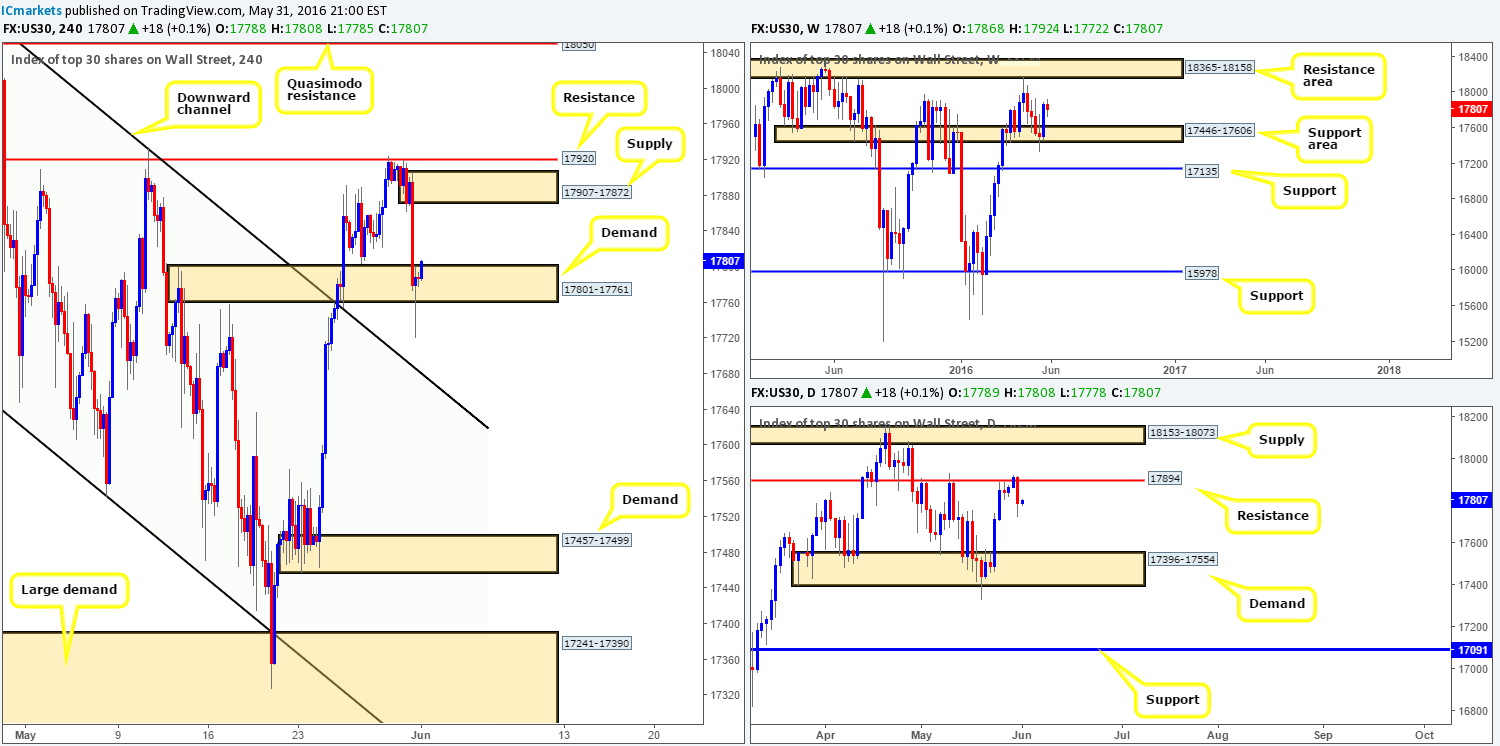
Levels to watch/live orders:
- Buys: Watch for price to consume 17920 and then look to trade any retest seen thereafter (lower timeframe confirmation required).
- Sells: 17907-17872 [Tentative – confirmation required] (Stop loss: dependent on where one confirms this area).
Gold:
The tables appear to be turning in the gold market right now as weekly bulls defend the weekly demand area penciled in at 1205.6-1181.2. This could, assuming the bulls remain in good form, potentially lift prices back up to weekly supply seen at 1307.4-1280.0. However, with daily action fast approaching a daily supply zone drawn from 1223.7-1233.3 and H4 price now lurking within H4 supply at 1216.4-1222.0, weekly buying could come to a halt very soon!
Similar to the U.S. DOW, gold is also a tricky beast right now with little agreement being seen from higher-timeframe structure at present.
Our suggestions: Should bullion decline in value and connect with H4 demand at 1181.6-1191.1, we would, however, be very interested in buying from here with our stops placed beyond this base at around the 1180.3 region. Reason being is this area sits just below daily support at 1191.40, and is also located within the depths of the above said weekly demand.
However, as we mentioned in yesterday’s report, neither a long nor short seems attractive at current prices.
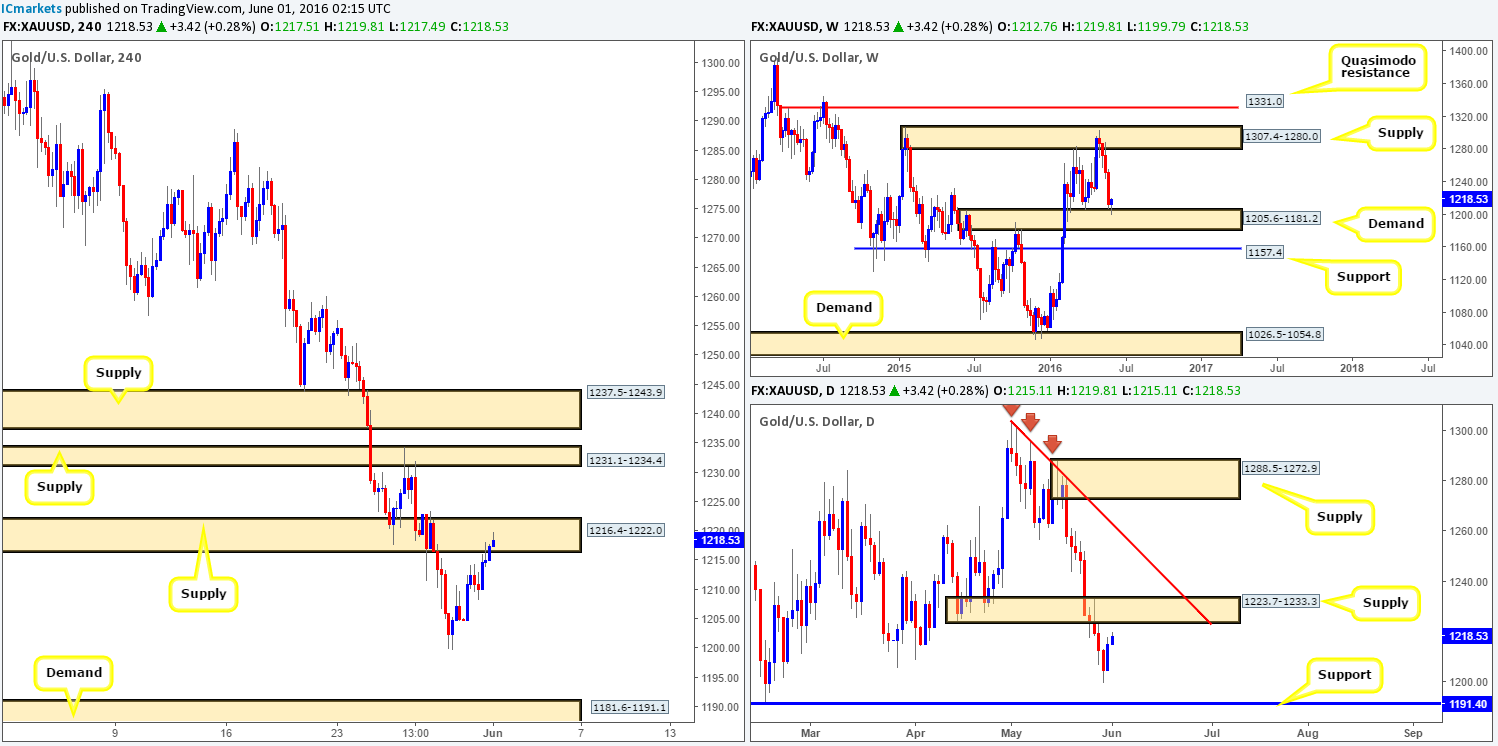
Levels to watch/live orders:
- Buys: 1181.6-1191.1 [Entering from here at market is a possibility] (Stop loss: 1180.3).
- Sells: Flat (Stop loss: N/A).


