
Key risk events today:
MPC Member Haskel Speaks; US ADP Non-Farm Employment Change; US ISM Manufacturing PMI; FOMC Meeting Minutes.
(Previous analysis as well as outside sources – italics).
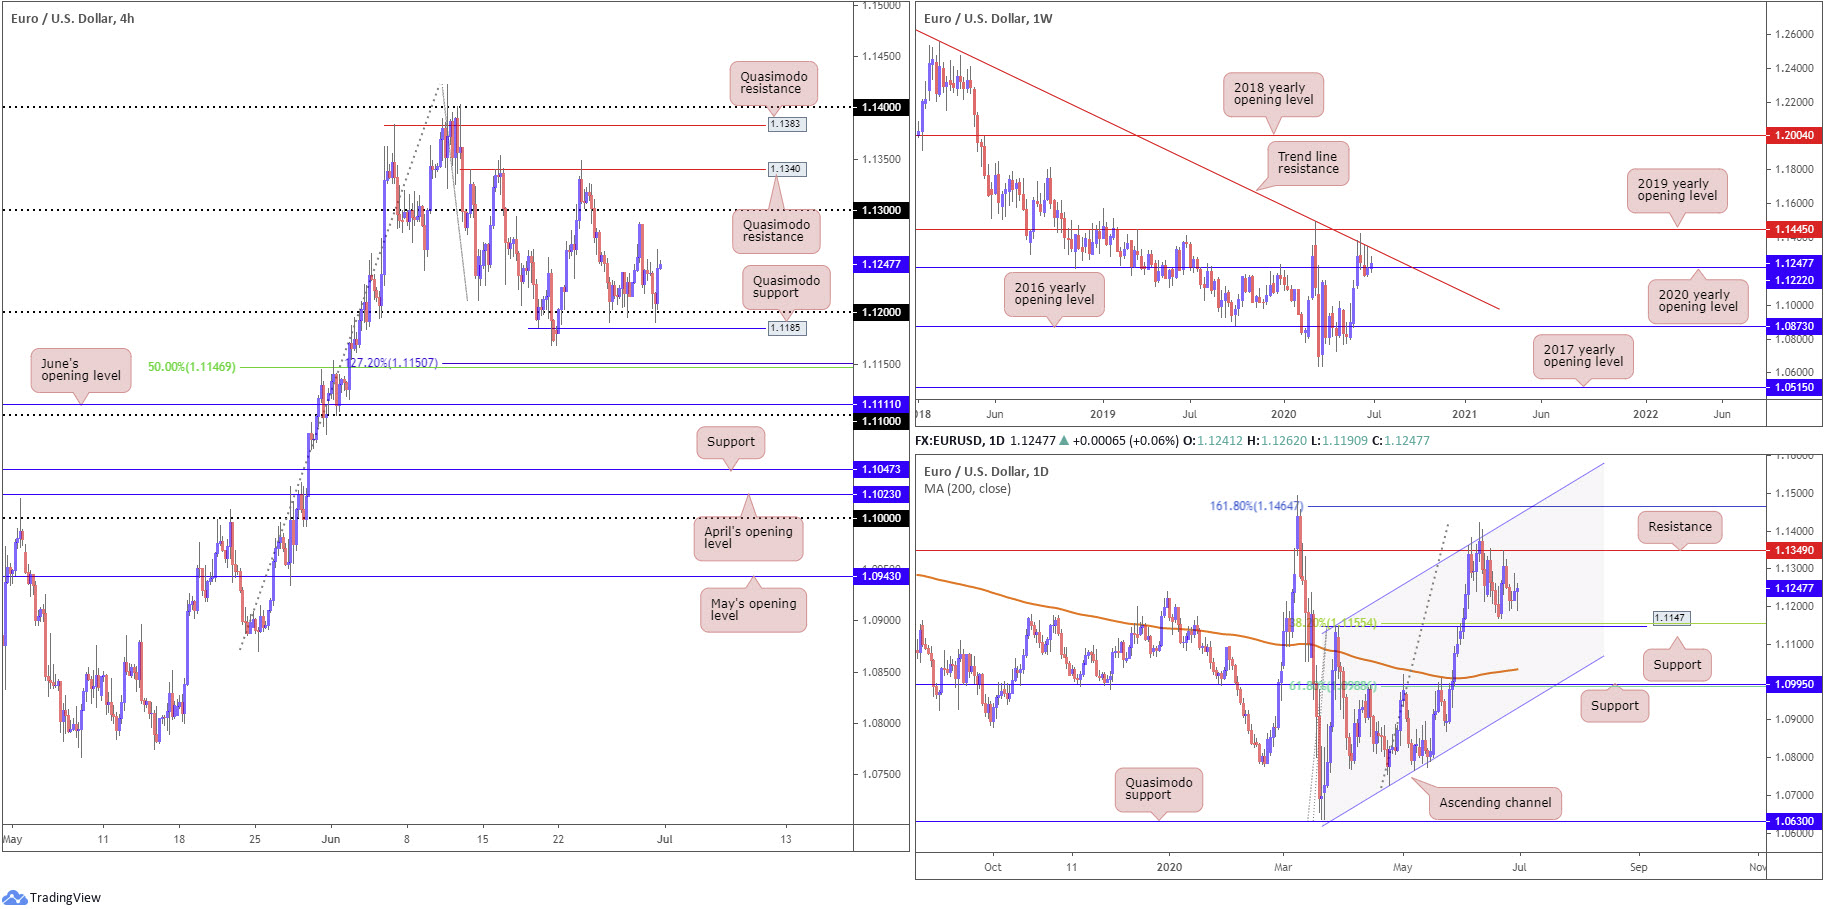
EUR/USD:
Led by a USD (DXY) decline across the board, Tuesday watched EUR/USD stage a rebound from territory just south of 1.12 on the H4 timeframe.
Higher-than-anticipated US consumer confidence failed to offer any respite. The Conference Board noted, the Consumer Confidence Index increased in June, after virtually no change in May. The Index now stands at 98.1 (1985=100), up from 85.9 in May.
1.12, therefore, remains a reasonably dominant intraday floor. H4 Quasimodo support at 1.1185 also remains in the crosshairs south of the round number, as does the 127.2% Fibonacci extension point at 1.1150 and 50.00% retracement ratio at 1.1146.
Further afield, trade is seen fading long-standing trend line resistance, taken from the high 1.2555, on the weekly timeframe. Consequently, the 2020 yearly opening level at 1.1222 is under fire. Any sustained move below the aforementioned barrier seats the 2016 yearly opening level at 1.0873 on the hit list, while a EUR/USD bid shifts focus on the possibility of reaching the 2019 yearly opening level at 1.1445.
The story on the daily timeframe, since the beginning of June, has price languishing south of resistance at 1.1349. Support derived from the 1.1147 27 March high, therefore, could soon become a reality, a level that merges closely with a 38.2% Fibonacci retracement ratio at 1.1155. Interestingly, breaching 1.1147 reveals the 200-day SMA (orange – 1.1034), closely followed by support at 1.0995 and a 61.8% Fibonacci retracement ratio at 1.0988.
Areas of consideration:
In light of recent support from 1.12 on the H4, buyers have likely tucked protective stop-loss orders under the round number, usually between 10-20 pips. This unlocks the door to a possible fakeout scenario today, involving a dip through 1.12 into H4 Quasimodo support at 1.1185. Not only would this move trip liquidity (stops) below 1.12, it would drag in any willing buyers off the Quasimodo formation. A H4 close back above 1.12 off 1.1185, therefore, would likely be a welcomed sight for buyers, perhaps targeting 1.13.
In addition, traders may also wish to acknowledge the 127.2% Fibonacci extension point at 1.1150 and 50.00% retracement ratio at 1.1146 on the H4 as a potential support area, in the event 1.1185 fails to hold. This area converges with daily support at 1.1147 and 38.2% Fibonacci retracement ratio at 1.1155.
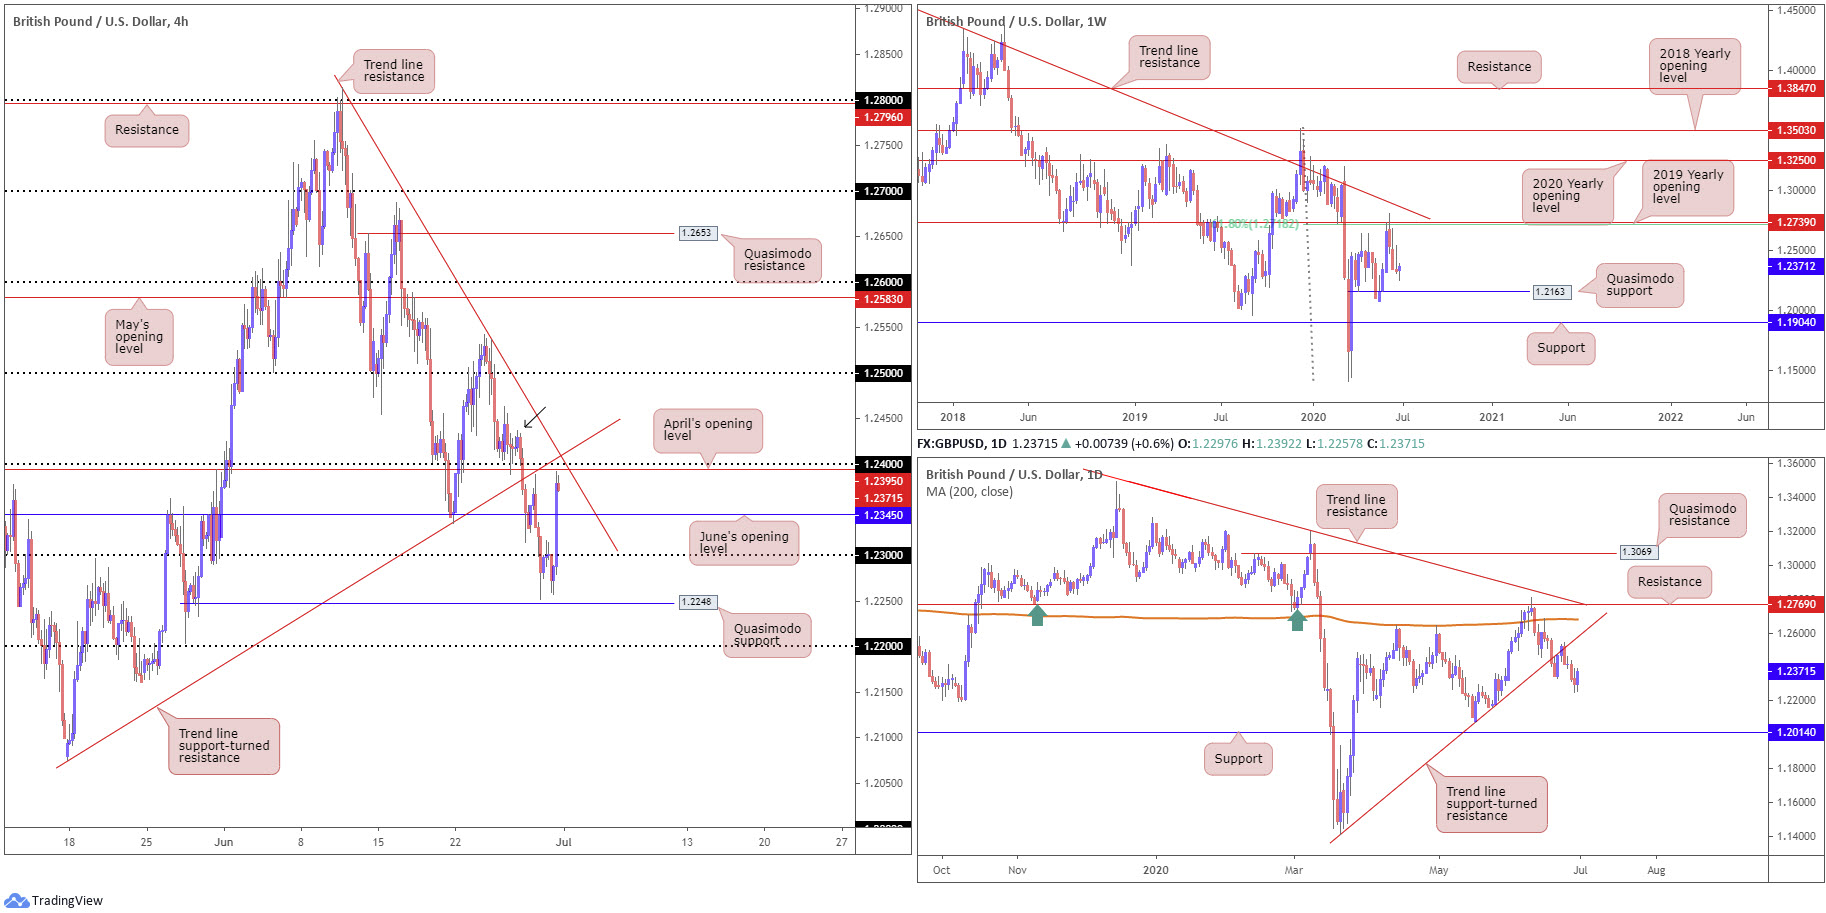
GBP/USD:
Sterling witnessed buyers strengthen their grip against the buck Tuesday, aided by the DXY dipping lower, as well as month-end rebalancing.
It was a one-sided market as GBP/USD overthrew the 1.23 handle and June’s opening level at 1.2345, structure based on the H4 timeframe. This led to a near-test of 1.24, a level merging with April’s opening level at 1.2395 and two trend line resistances (1.2075/1.2813).
Technical studies on the higher timeframes shows buyers making an appearance on the weekly timeframe, despite room to move lower to 1.2163 (Quasimodo support). To the upside, resistance continues to rest at a 61.8% Fibonacci retracement ratio at 1.2718 and 2019 yearly opening level at 1.2739.
The daily timeframe, meanwhile, closed a touch off best levels yesterday and snapped a two-day bearish phase. Resistance can be found at a trend line support-turned resistance, taken from the low 1.1409. Despite Tuesday’s upside bias, similar to the weekly timeframe, there’s room to explore lower levels towards support coming in at 1.2014, sited just south of the 1.2075 May 18 low. Before reaching this far south, though, weekly Quasimodo support must be absorbed at 1.2163.
Areas of consideration:
1.24 is an interesting resistance on the H4 timeframe right now. As mentioned above, the round number dovetails closely with April’s opening level at 1.2395 and two trend line resistances (1.2075/1.2813). Conservative sellers from this region, having seen the base offer little in the way of higher-timeframe confluence, may position protective stop-loss orders above 1.2437 (black arrow) – a supply zone resting on top of 1.24.
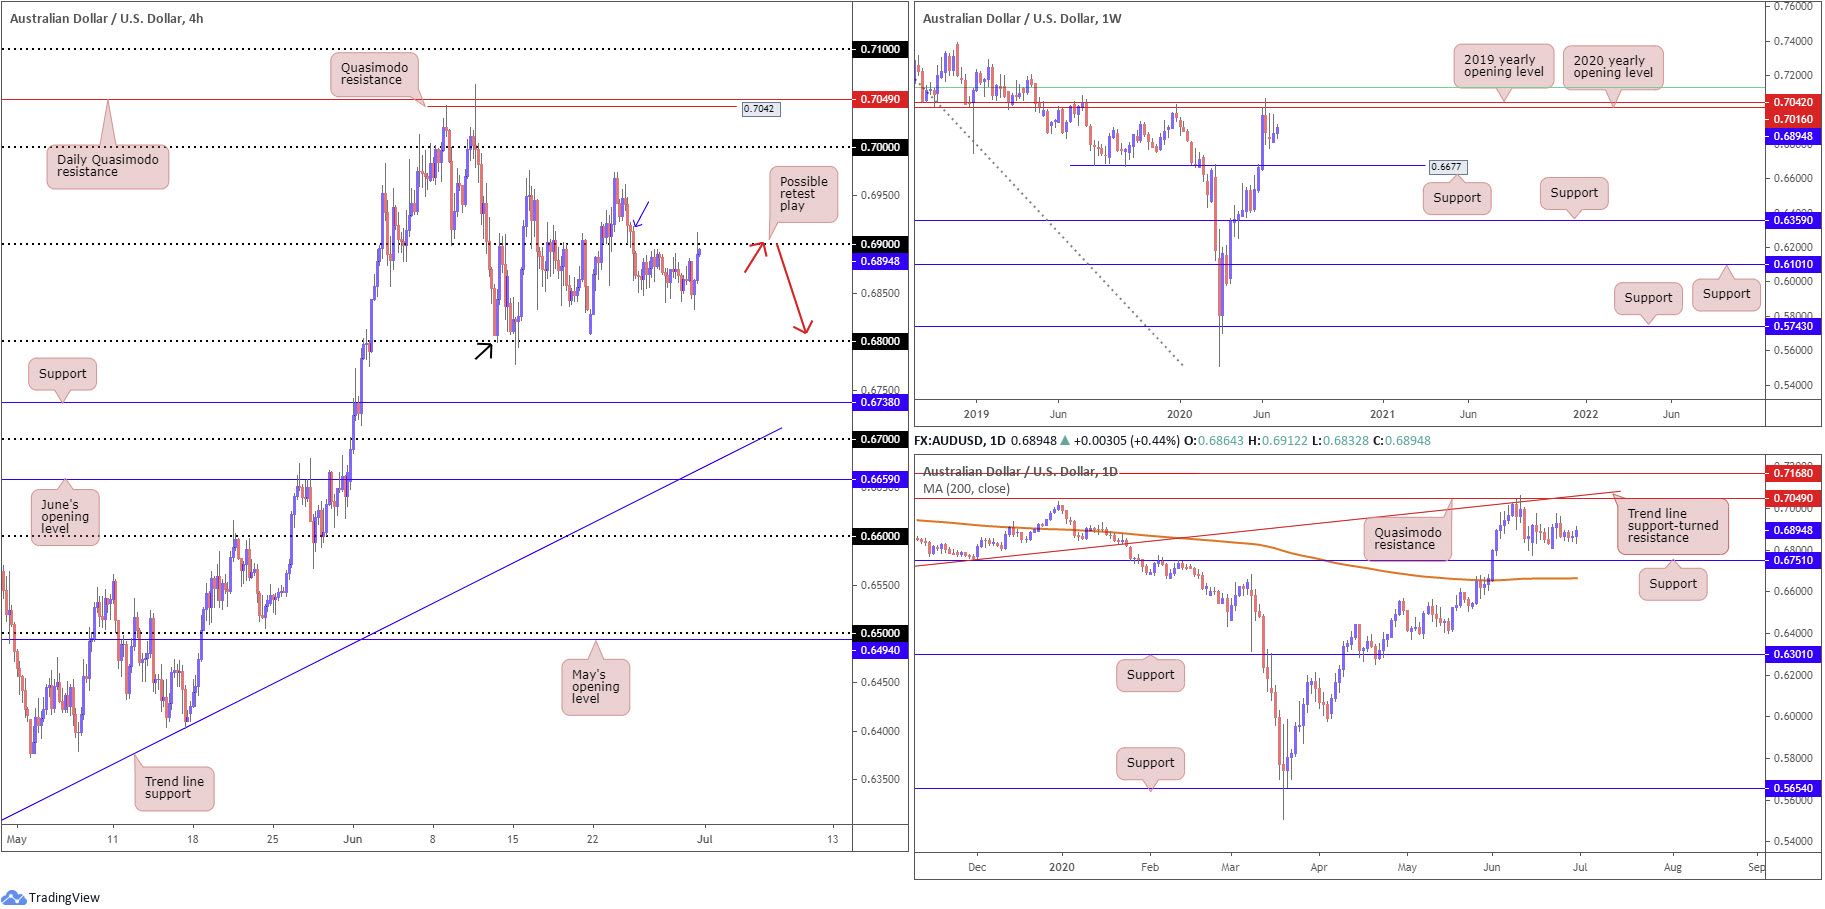
AUD/USD:
AUD/USD bottomed in early London Tuesday, reversing earlier declines to set fresh pinnacles above 0.69, based on the H4 timeframe.
With 0.69 recently entering the fight, it’s worth reminding ourselves downside also remains contained at 0.6850ish. Sidestepping 0.6850, the highway south seems clear until the 0.68 juncture. Technically speaking, this figure also throws across a Quasimodo support (black arrow denotes the left shoulder).
Despite recent movement, higher-timeframe action remains pretty much unchanged:
Resistance, forged in the shape of a 2020 yearly opening level and a 2019 yearly opening level, at 0.7016 and 0.7042, respectively, continues to offer a dominant presence on the weekly timeframe. It might also interest traders to note that just above the said resistances we have a 61.8% Fibonacci retracement ratio at 0.7128 (green). In terms of support, crosshairs are perhaps fixed on 0.6677.
From the daily timeframe, Quasimodo resistance at 0.7049 is in sight, merging closely with trend line support-turned resistance, taken from the low 0.6670. Attention on this timeframe also remains at support coming in from 0.6751. Interestingly, lurking beneath here we also have the 200-day SMA (orange – 0.6665), located close by weekly support mentioned above at 0.6677.
Areas of consideration:
For those who read Tuesday’s technical briefing you may recall the following (italics):
A retest at the underside of 0.69 (red arrows), one that preferably holds by way of a H1/H4 bearish candlestick pattern, would likely appeal to sellers, targeting the 0.68 neighbourhood.
As evident from the H4 chart, we are retesting 0.69 and holding for the time being. An alternative to waiting for additional candlestick confirmation off 0.69 may see some traders enter at current price and position protective stop-loss orders above 0.6922 (blue arrow), the top edge of a local supply resting above 0.69.
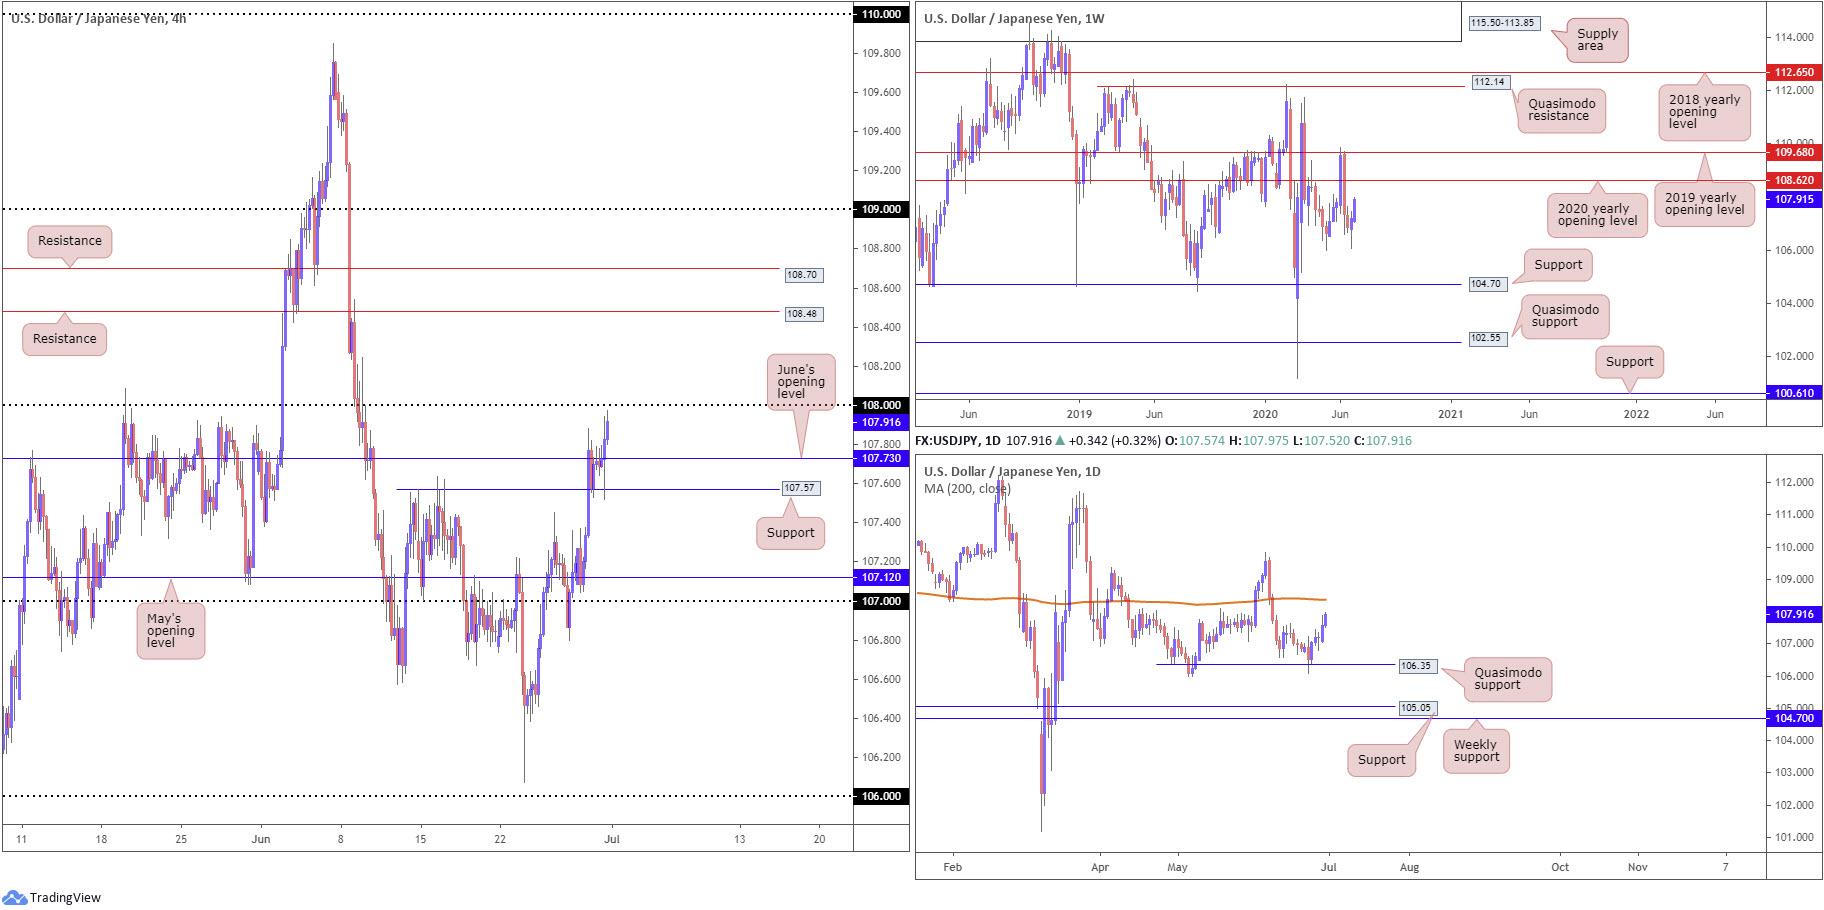
USD/JPY:
USD/JPY regained consciousness as we transitioned into US hours Tuesday, establishing a position off H4 support located at 107.57. Price action swiftly moved through June’s opening level at 107.73, consequently marking the 108 handle as the next visible upside target. Space above 108, according to the H4 timeframe, shows room to approach resistance at 108.48, closely shadowed by another layer of resistance at 108.70.
With the recent push north, ahead of the 105.98 6th May low, weekly price continues to climb its way back towards the 2020 yearly opening level at 108.62.
Quasimodo support at 106.35 on the daily timeframe nudged its way into the limelight last week and has so far delivered healthy upside. The possibility of further buying remains, with crosshairs fixed on the 200-day SMA (orange – 108.37) as an upside objective.
Areas of consideration:
Traders who read Tuesday’s technical briefing may recall the following (italics):
Having noted room for buyers to stretch their legs on both the weekly and daily timeframes, targeting 108.37 (daily) and 108.62 (weekly), the H4 support at 107.57 could hold ground and provide a platform to consider buying opportunities from. This would, of course, entail going up against H4 resistances at 107.73 and 108.
Well done to any readers who managed to jump aboard the rebound off 107.57.
Going forward, breaching 108 appears a likely route today, as daily buyers take aim at 108.37, and weekly buyers at 108.62. As such, intraday bullish scenarios north of 108 could be an option today.
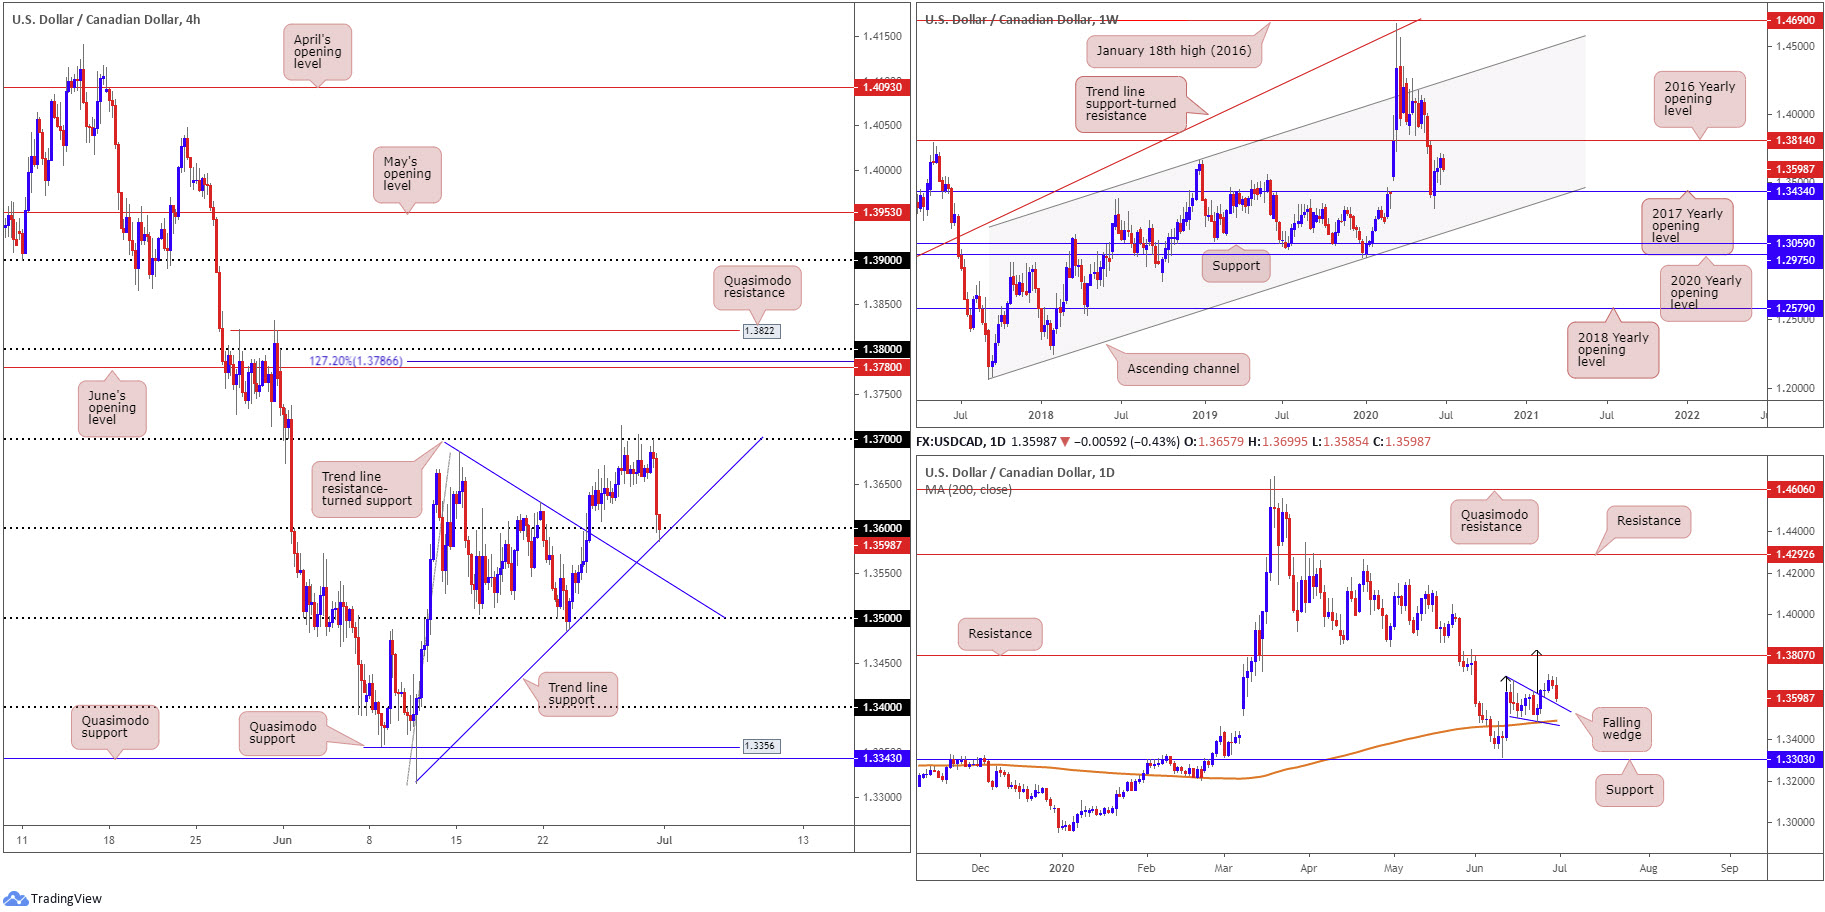
USD/CAD:
1.37 on the H4, despite numerous upside attempts, managed to hold off buyers and send USD/CAD to lower ground Tuesday. Price action shook hands with 1.36, marginally dipping a toe beneath the round number to trend line support, extended from the low 1.3315. On the date front, Canadian GDP data had little impact.
From the weekly timeframe, room to advance north of the 2017 yearly opening level at 1.3434 certainly remains a possibility. A potential hurdle to be aware of, though, falls in by way of the 2016 yearly opening level at 1.3814, with follow-through buying likely to try and tackle a dense block of supply between 1.4190/1.3912.
A closer examination of price action on the daily timeframe reveals the recent bout of selling has thrown a possible retest at the top edge of the current falling wedge pattern in the pot (1.3686/1.3504). Take-profit targets out of falling wedges can be measured by taking the base value and adding this figure to the breakout point (black arrows), which as you can see in this case, converges closely with the next daily resistance at 1.3807.
Areas of consideration:
Intraday players are likely licking their lips at the thought of a rebound occurring from 1.36, having seen H4 trend line support (1.3315) also coincide closely with the base.
Failure to hold 1.36 could draw in H4 trend line resistance-turned support, derived from the high 1.3686 (represents the upper edge of the daily failing wedge pattern).
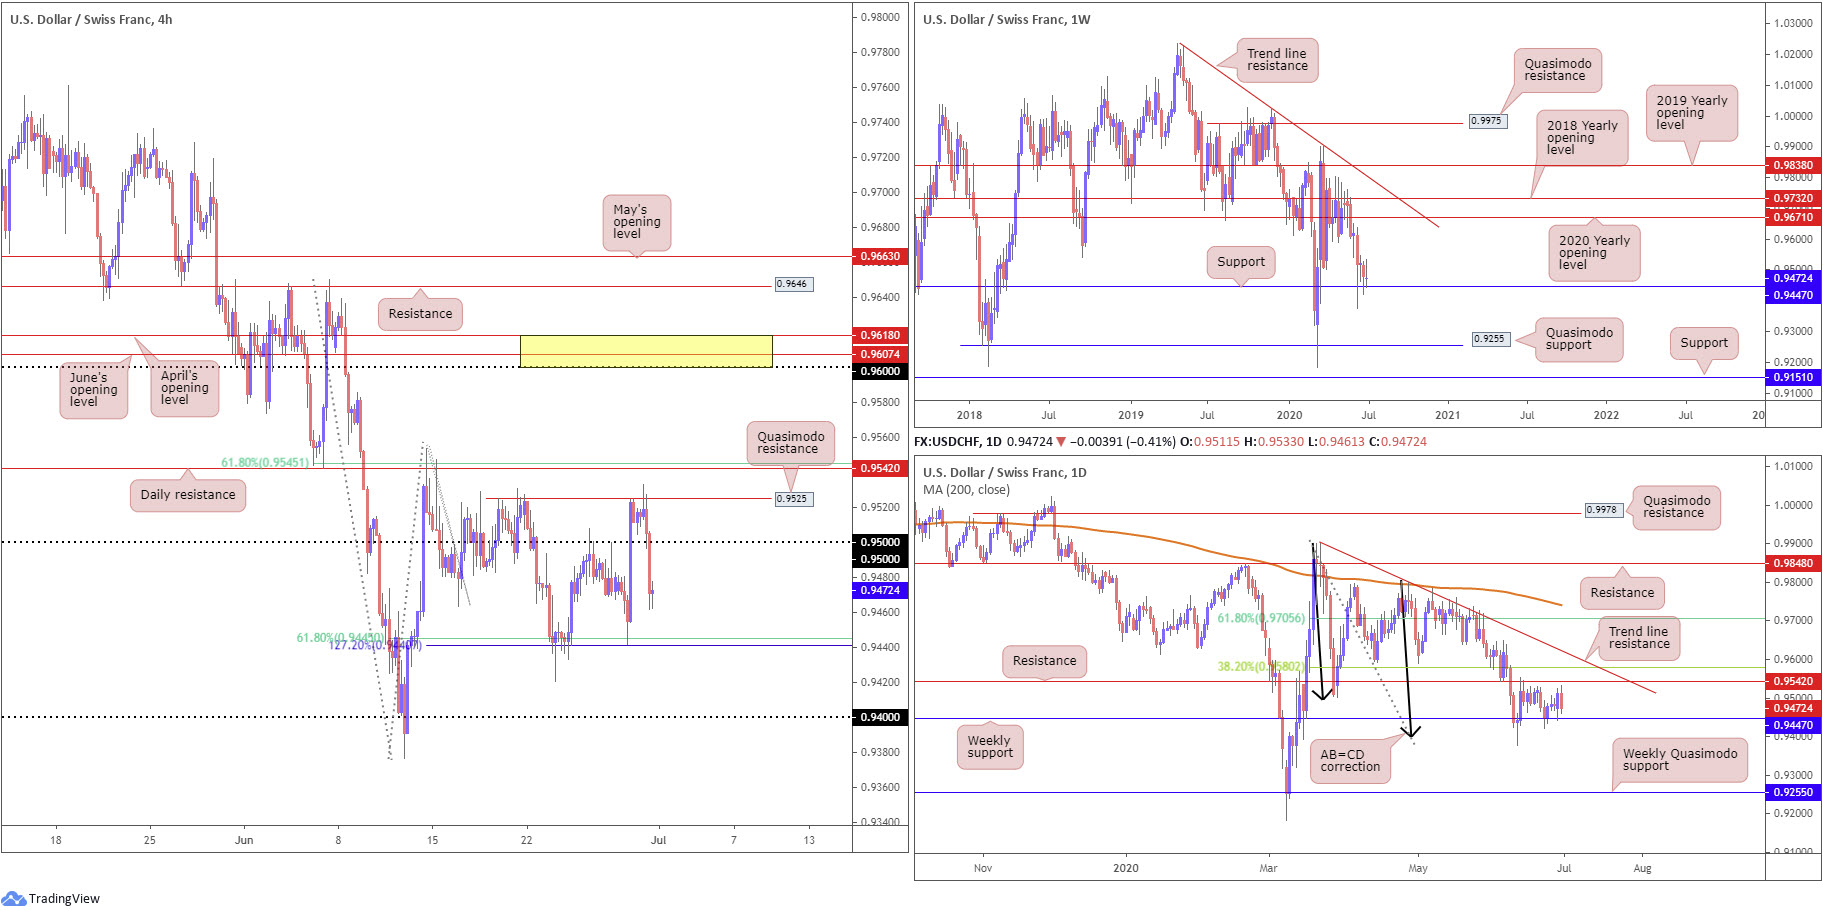
USD/CHF:
Tuesday observed the DXY hand back a large portion of earlier gains, unable to sustain upside north of session highs at 97.80. This helped guide USD/CHF lower from H4 Quasimodo resistance at 0.9525, ultimately engulfing 0.95 to the downside and throwing the 61.8% Fibonacci retracement ratio at 0.9445 and 127.2% Fibonacci extension point at 0.9440 in the pot as viable support today.
According to the weekly timeframe, price action recently made contact with support at 0.9447. Despite the lack of enthusiasm so far (current candle action trades indecisively), in the event we do see things turn around here the 2020 yearly opening level at 0.9671 is marked as the next resistance target, stationed close by the 2018 yearly opening level at 0.9732.
On the daily timeframe, the initial break of weekly support at 0.9447 (11 June) threw breakout sellers into a bear trap as daily buyers vigorously defended AB=CD structure (black arrows) at 0.9395. The initial upside target out of the daily AB=CD pattern, traditionally speaking, can be found at the 38.2% Fibonacci retracement ratio at 0.9580 (derived from legs A-D), positioned above resistance at 0.9542, which, as you can see, has so far done a superb job in holding back buyers. In the event we overrun 0.9542 and also 0.9580 we could, according to traditional measures, cross swords with the next AB=CD target at 0.9705, the 61.8% Fibonacci retracement ratio, also taken from legs A-D. This implies a push above trend line resistance, taken from the high 0.9901.
Areas of consideration:
As stated in recent reports, weekly support at 0.9447 continues to remain a watched level in this market. Consequently, until this level surrenders, bullish strategies may be the way forward.
With H4 exhibiting room to engage with the 61.8% Fibonacci retracement ratio at 0.9445 and 127.2% Fibonacci extension at 0.9440, these levels, coupled with weekly support mentioned above at 0.9447, puts forward active support worthy of attention. Combined, this area will likely see traders enter the market in search of bullish themes.
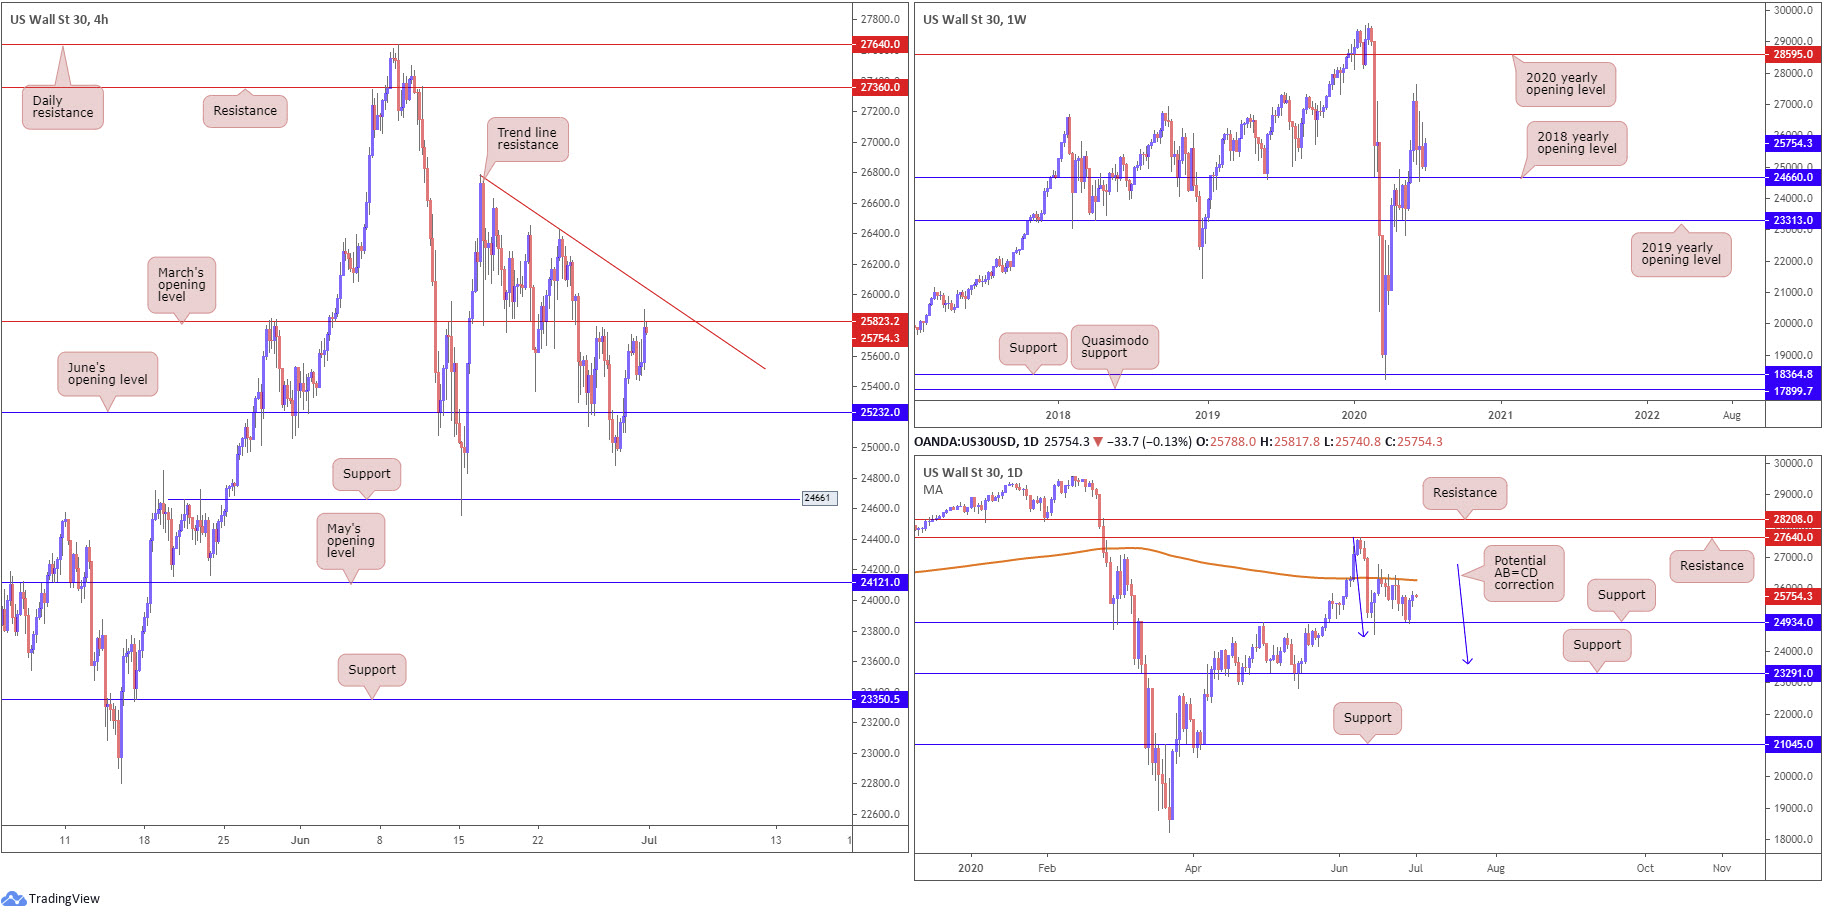
Dow Jones Industrial Average:
Major US stock indexes wrapped up higher Tuesday amid upbeat economic data. The Dow Jones Industrial Average added 217.08 points, or 0.85%; the S&P 500 jumped 47.05 points, or 1.54%, and the tech-heavy Nasdaq 100 concluded higher by 195.69 points, or 1.96%.
Following Monday making quick work of June’s opening level at 25232 on the H4, Tuesday’s extension ran into resistance, shaped by March’s opening level at 25823, closely followed by trend line resistance, taken from the high 26787.
The 2018 yearly opening level at 24660 remains an important base of support on the weekly timeframe. In the event buyers manage to keep their head above water here, we may eventually pull in the 27638 high, followed by the 2020 yearly opening level at 28595. Below 24660, however, traders’ crosshairs may be fixed on the 2019 yearly opening level at 23313.
Since June 16, the 200-day SMA (orange – 26274) has absorbed upside attempts, with recent trade bringing in support from 24934 on the daily timeframe and rebounding higher. In case buyers struggle here, dipping a toe in waters south of 24934 may see support at 23291 call for attention. Another key observation is a potential AB=CD correction (blue arrows) at 23553.
Areas of consideration:
Having seen buyers attempting to establish a position north of weekly support (2018 yearly opening level) at 24660 and also daily support at 24934, trying to fade March’s opening level at 25823 and trend line resistance on the H4 may be difficult.
Equally difficult, though, is entering into long positions above H4 trend line resistance, as the 200-day SMA lurks close by at 26274.
As a result of the above, neither a long nor short appears attractive at this time.
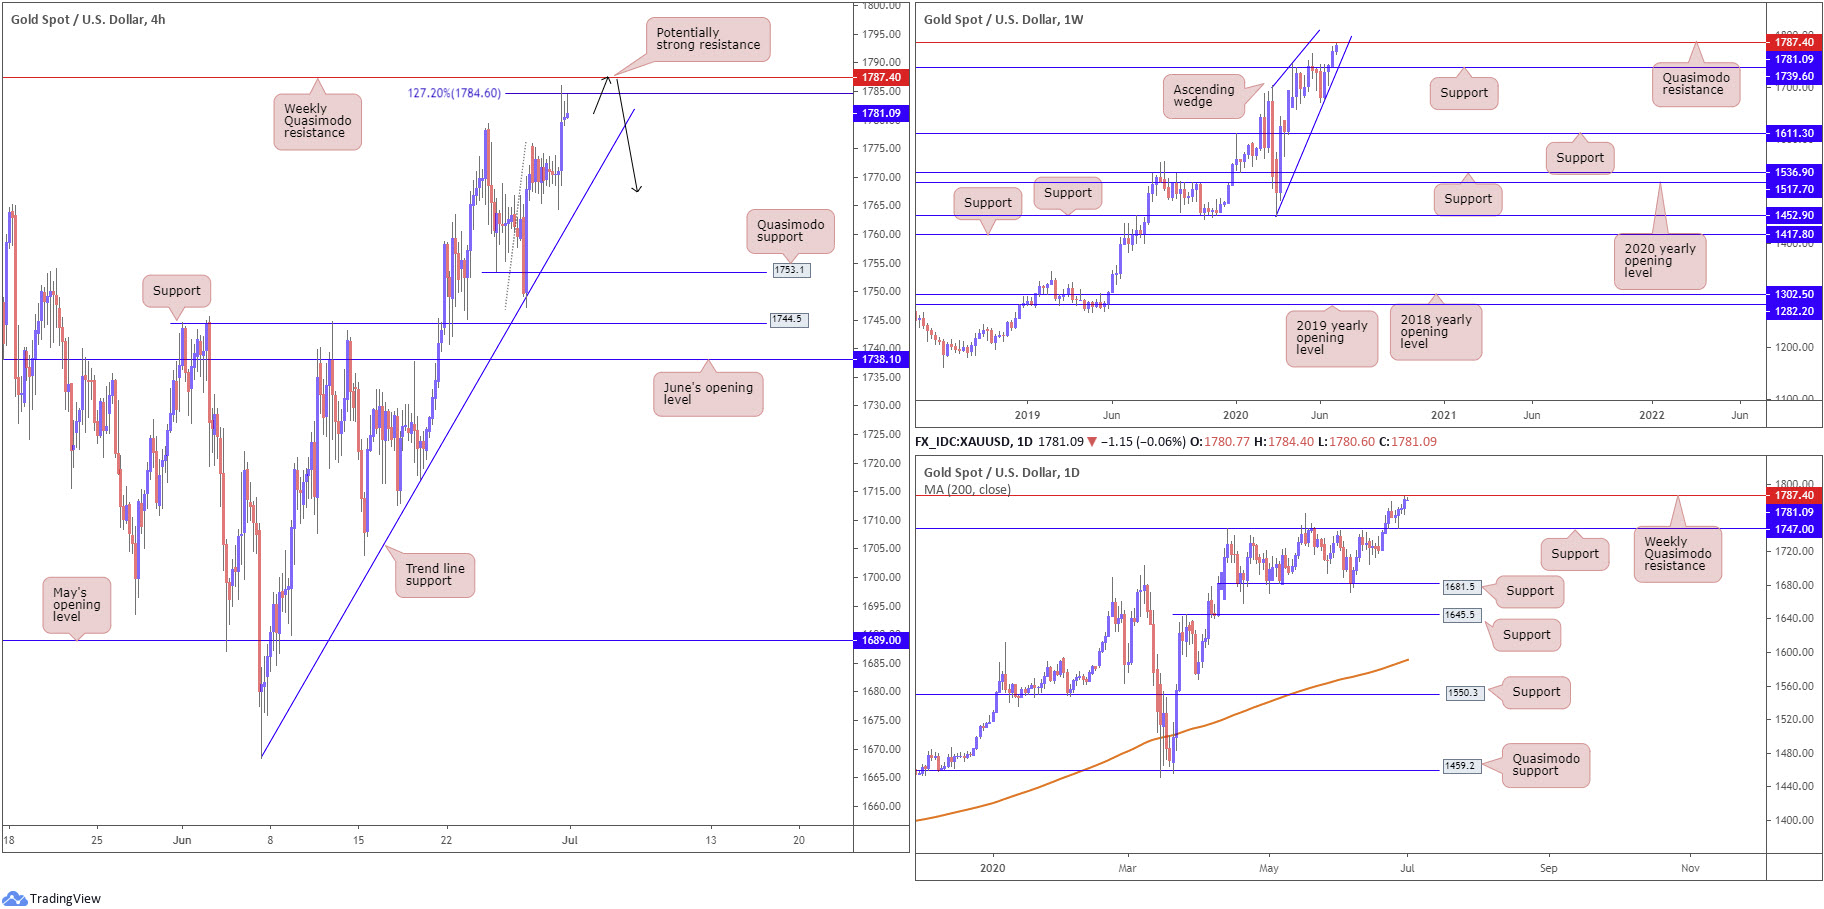
XAU/USD (GOLD):
Against the US dollar, gold finished higher Tuesday amid month-end flows, adding 0.63% by the close and recording fresh multi-year highs at 1786.0.
On all three timeframes, it is clear we’re trading within close proximity of a key resistance, a weekly Quasimodo formation at 1787.4. Also interesting on the weekly timeframe is a potential ascending wedge pattern between 1451.4/1703.6, perhaps serving as a reversal pattern.
Areas of consideration:
Bearish scenarios off weekly Quasimodo resistance at 1787.4 are possible today, targeting H4 trend line support, etched from the low 1668.3. A break of here serves as a sign we may then head for H4 Quasimodo support at 1753.1, followed by daily support at 1747.0.
The accuracy, completeness and timeliness of the information contained on this site cannot be guaranteed. IC Markets does not warranty, guarantee or make any representations, or assume any liability regarding financial results based on the use of the information in the site.
News, views, opinions, recommendations and other information obtained from sources outside of www.icmarkets.com.au, used in this site are believed to be reliable, but we cannot guarantee their accuracy or completeness. All such information is subject to change at any time without notice. IC Markets assumes no responsibility for the content of any linked site.
The fact that such links may exist does not indicate approval or endorsement of any material contained on any linked site. IC Markets is not liable for any harm caused by the transmission, through accessing the services or information on this site, of a computer virus, or other computer code or programming device that might be used to access, delete, damage, disable, disrupt or otherwise impede in any manner, the operation of the site or of any user’s software, hardware, data or property.


