
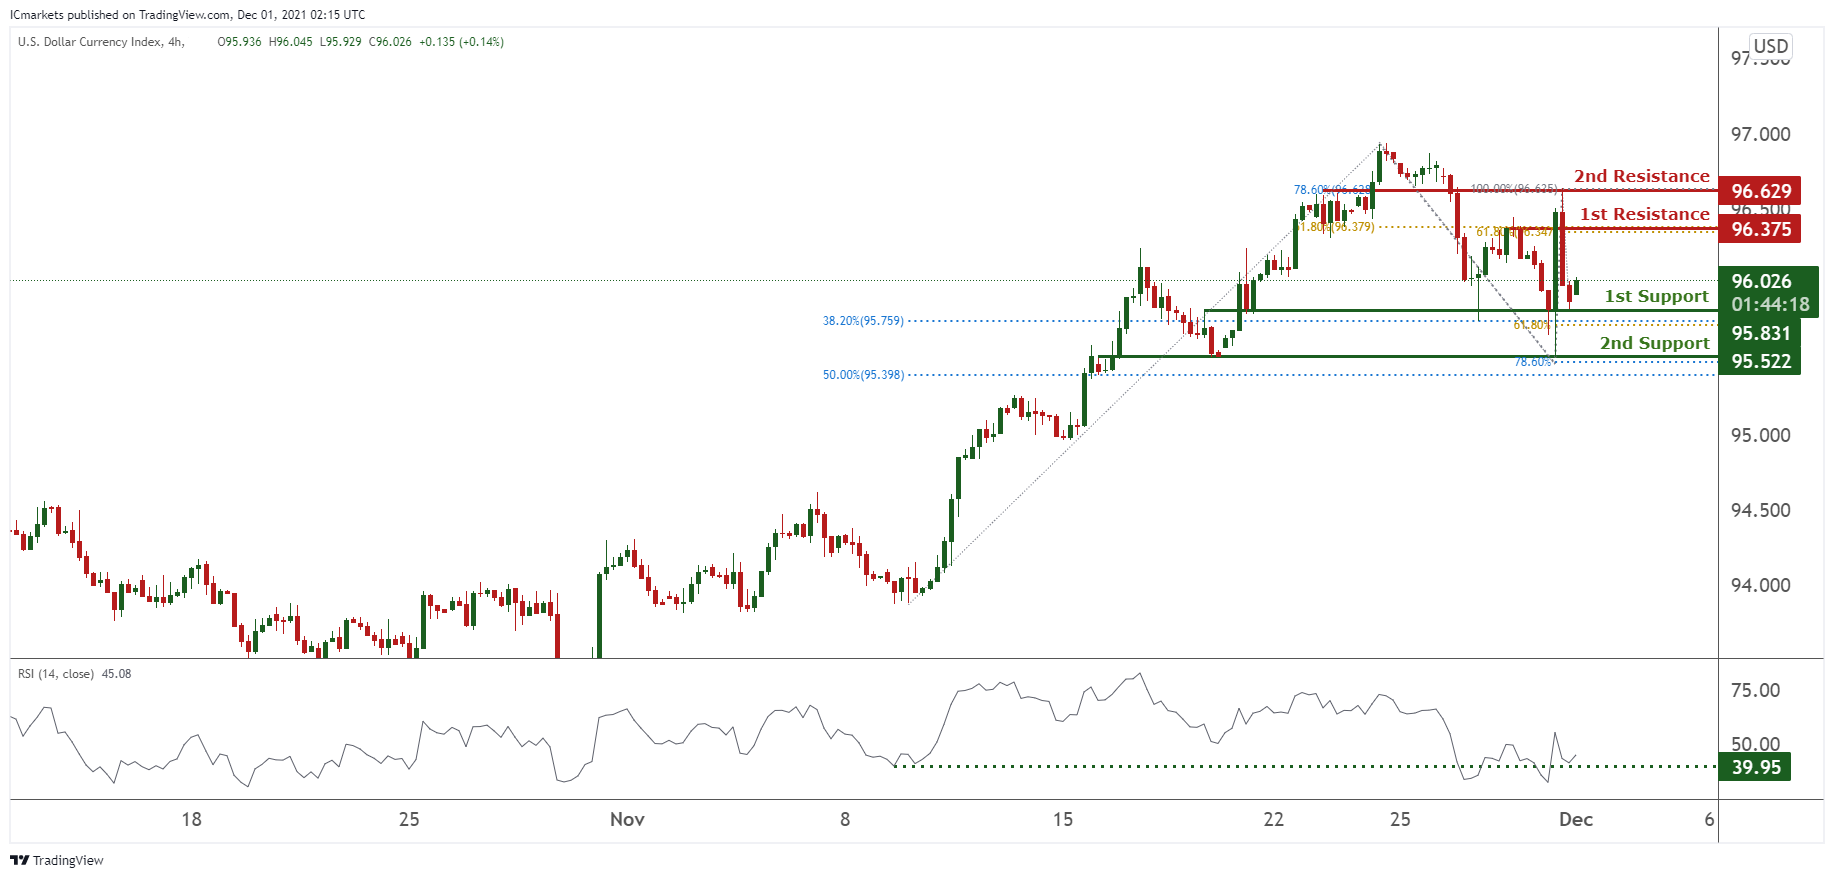
DXY:
On the H4 timeframe, prices have broken out of our bullish trendline and are on bearish momentum. We see the potential for a bounce from our 1st support at 95.831 in line with 38.2% Fibonacci retracement and 61.8% Fibonacci extension towards our 1st resistance at 96.375 in line with 61.8% Fibonacci extension Fibonacci retracement. Technical indicators are showing bullish momentum. Alternatively, prices might dip towards our 2nd support at 95.522 in line with 78.6% and 50% Fibonacci retracement.
Areas of consideration:
- H4 time frame, 1st resistance at 96.375
- H4 time frame, 1st support at 95.931
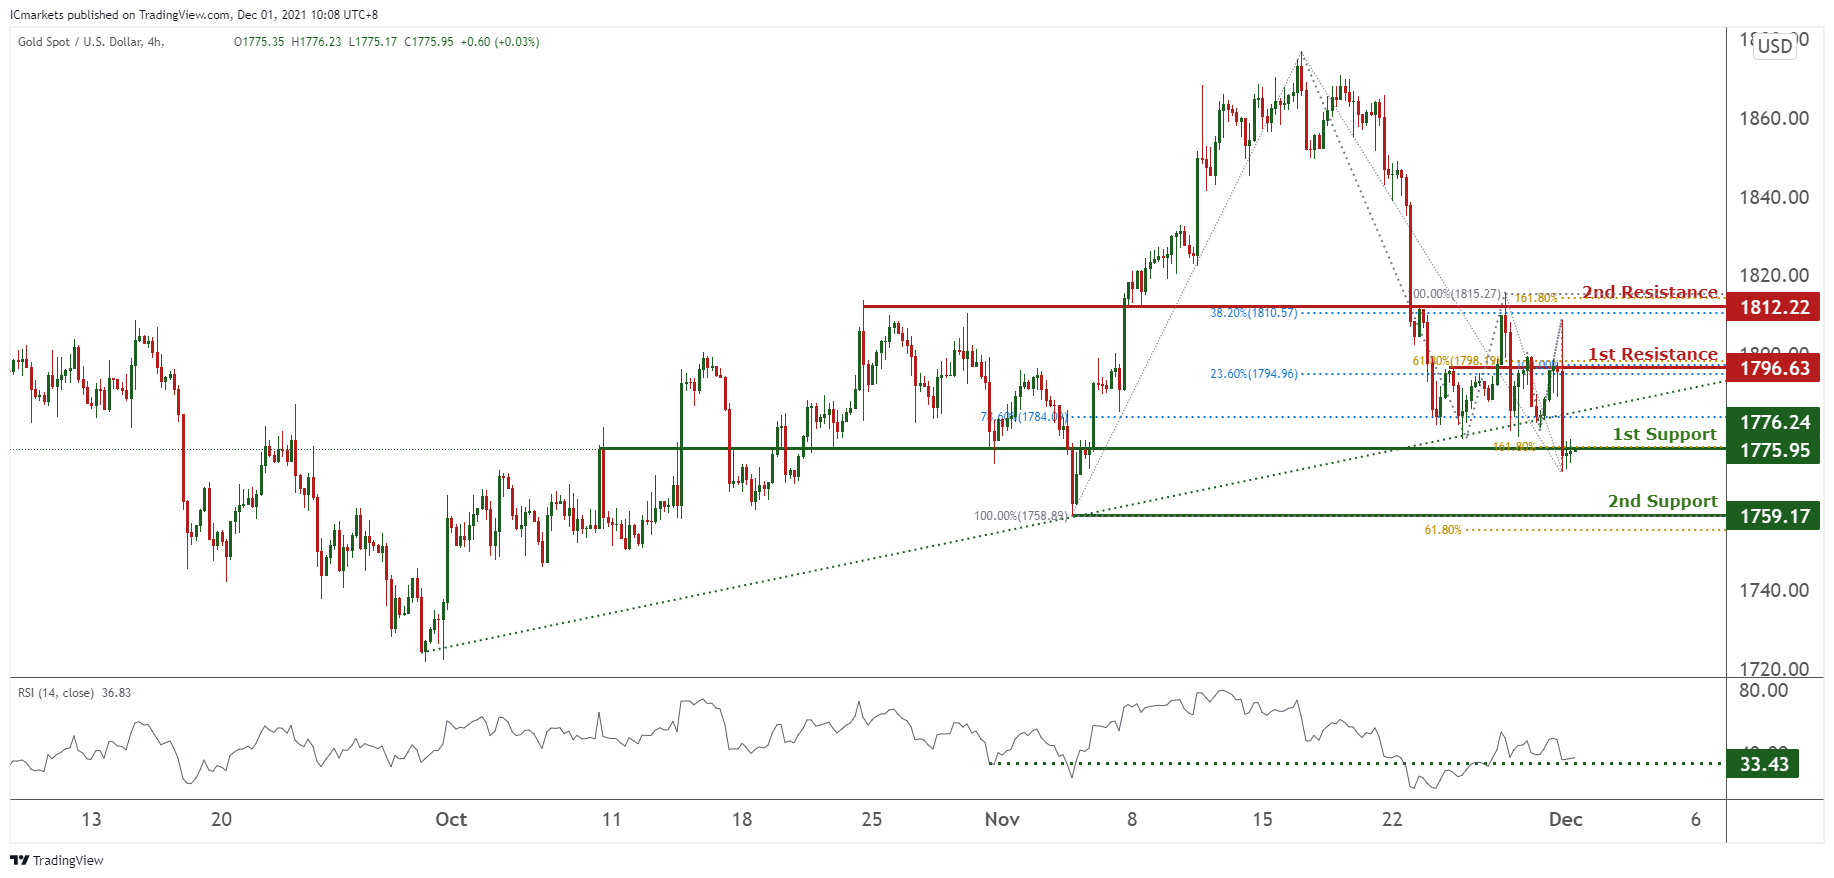
XAU/USD (GOLD):
On the H4 chart, prices have recently broken out of our ascending trendline. We see potential for a retest at our ascending trendline from our 1st support at 1775.95 in line with 161.8% Fibonacci projection towards our 1st resistance at 1796.63 which is a graphical overlap and also in line with 23.6% and 78.6% Fibonacci retracement. Technical indicators are showing bullish momentum. Alternatively, breaking our 1st support might find prices dipping further towards our 2nd support at 1759.17 in line with 61.8% Fibonacci extension and 100% Fibonacci retracement.
Areas of consideration:
- 4h 1st support at 1775.95
- 4h 1st resistance at 1796.63
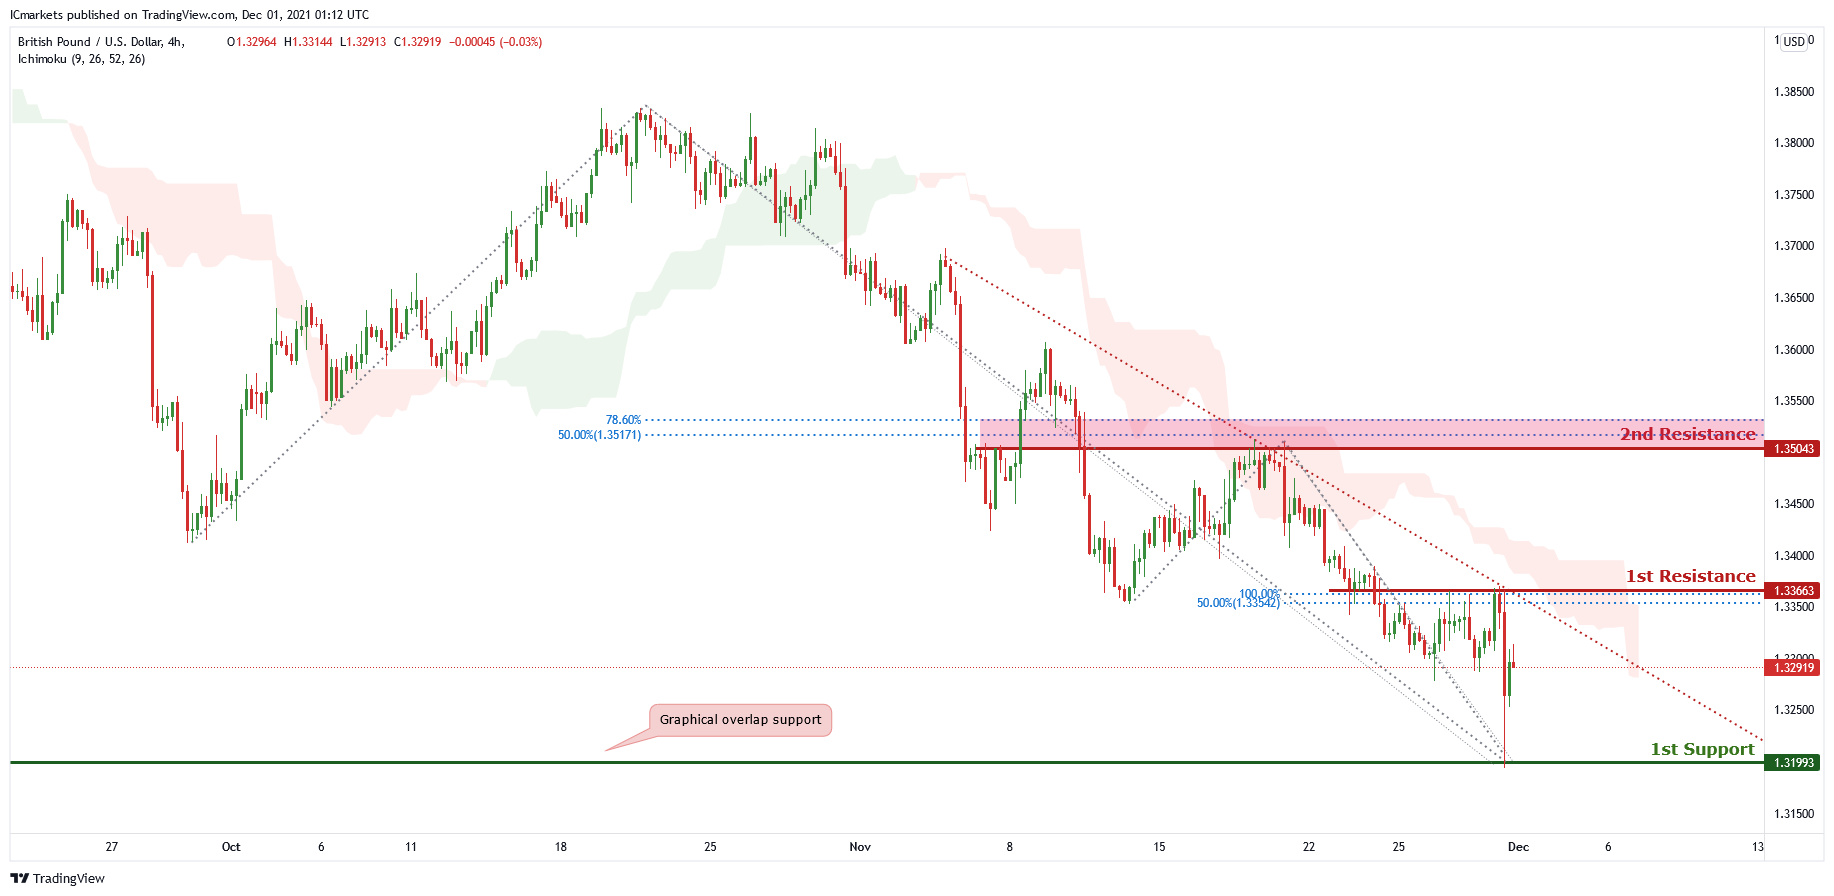
GBP/USD
On the H4 chart, price is trading on a descending trendline andis near the first resistance level of 1.33663 which is also 100% Fibonacci projection and 50% Fibonacci retracement. Price can potentially dip to the first support level of 1.31993 which is also the graphical overlap support level. Our bearish bias is supported by the ichimoku cloud indicator.
Areas of consideration :
H4 first resistance – 1.33663
H4 first support – 1.31993
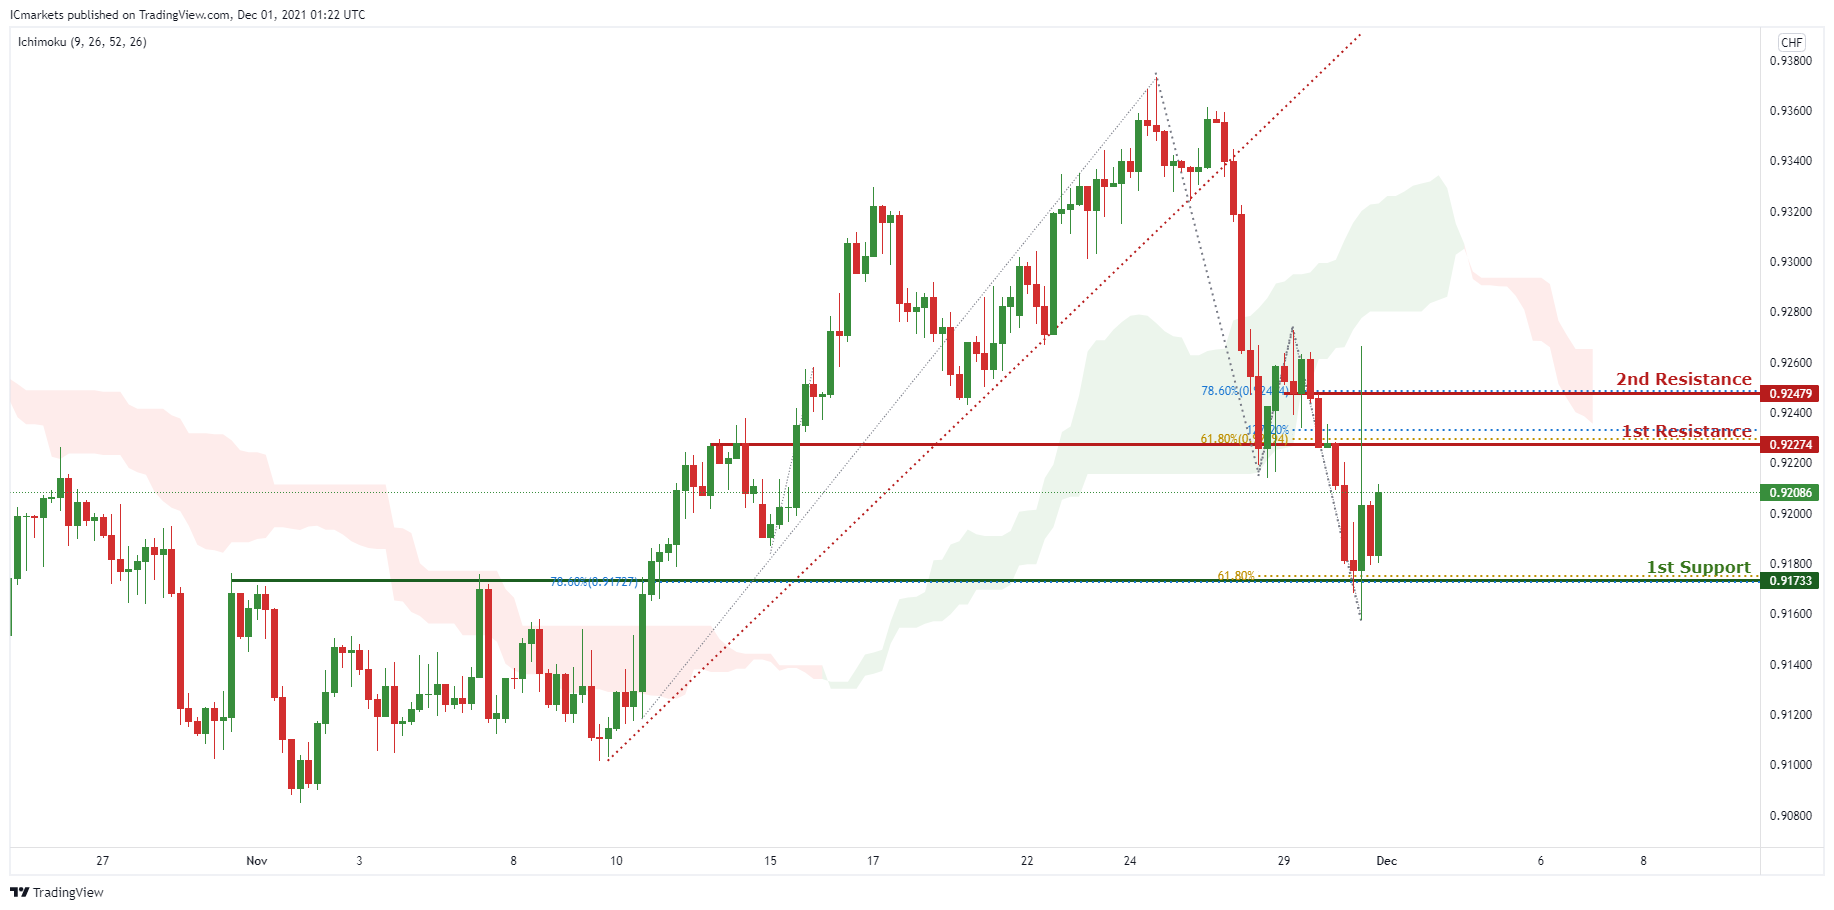
USD/CHF:
On the H4 timeframe, price broke out of the ascending trendline support, signifying an overall bearish momentum. We can expect price to drop from 1st Resistance in line with 127.2 % Fibonacci projection and 61.8% Fibonacci retracement towards 1st Support in line with 61.8% Fibonacci projection and 78.6% Fibonacci retracement. Our bearish bias is further supported by the price holding below the Ichimoku Cloud.
Areas of consideration:
- Watch 1st Support at 0.91733
- Watch 1st Resistance at 0.92274
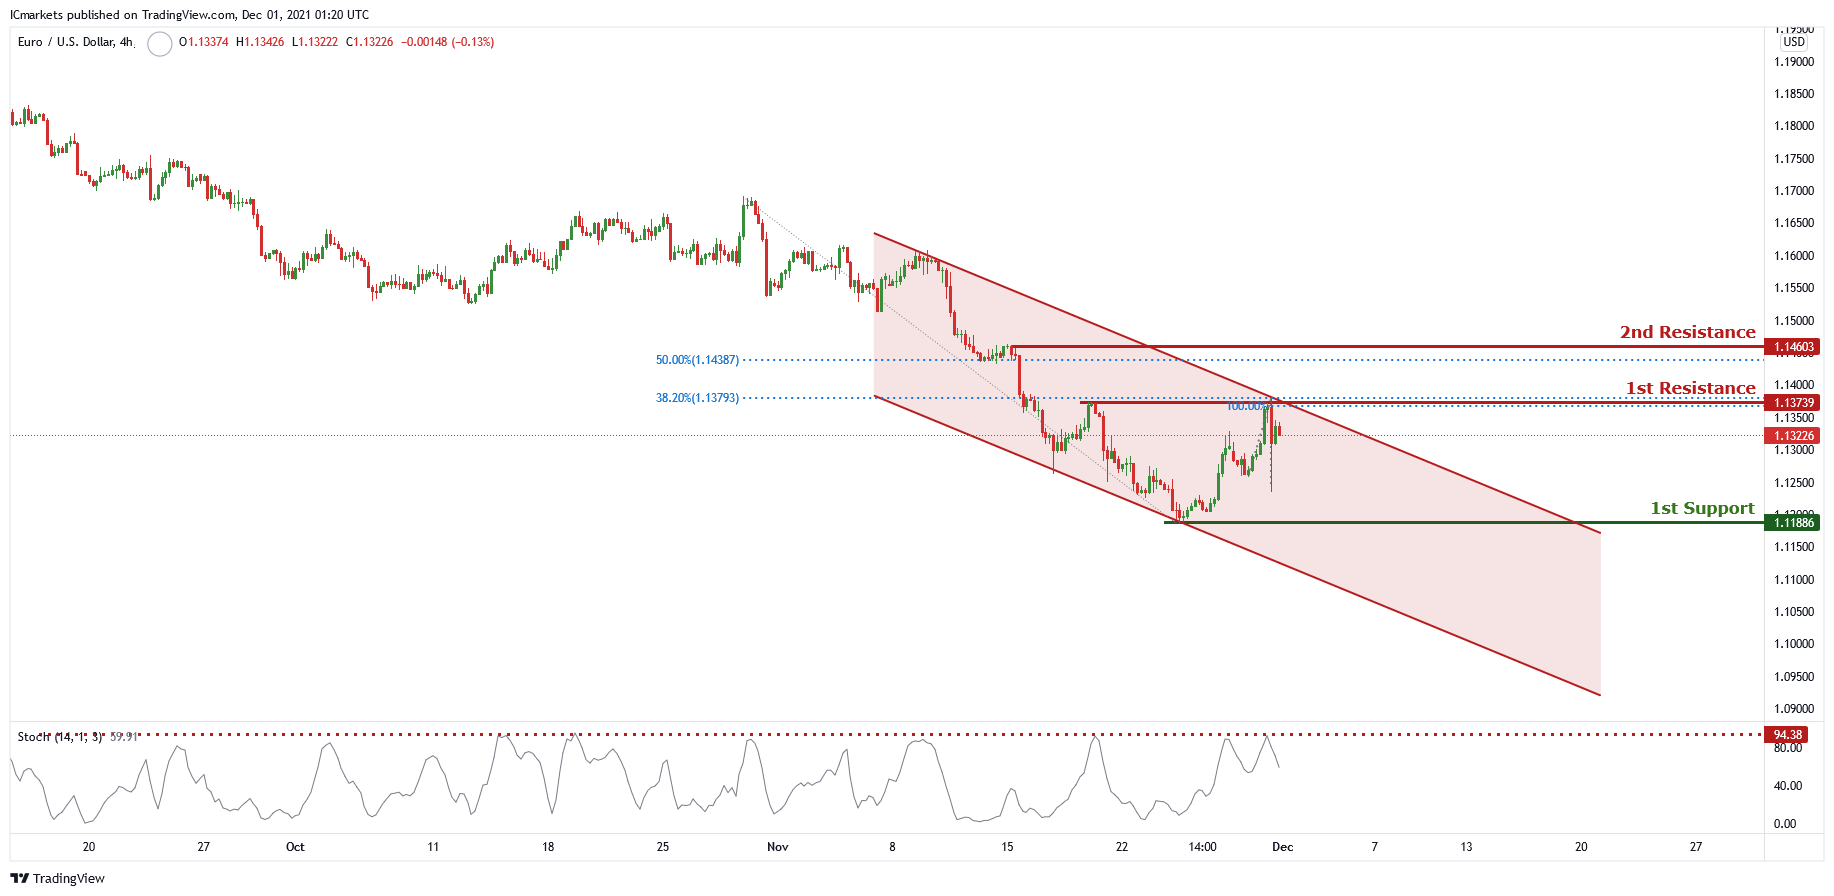
EUR/USD :
Price is trading in a descending channel and is near the first resistance level of 1.13739 which is also 38.2% Fibonacci retracement and 100% Fibonacci projection. Price can potentially dip to the first support level of 1.11886 which is also the graphical swing low level. Our bearish bias is supported by the stochastic indicator as it is at resistance level.
Areas of consideration
1st resistance – 1.13739
1st support – 1.11886
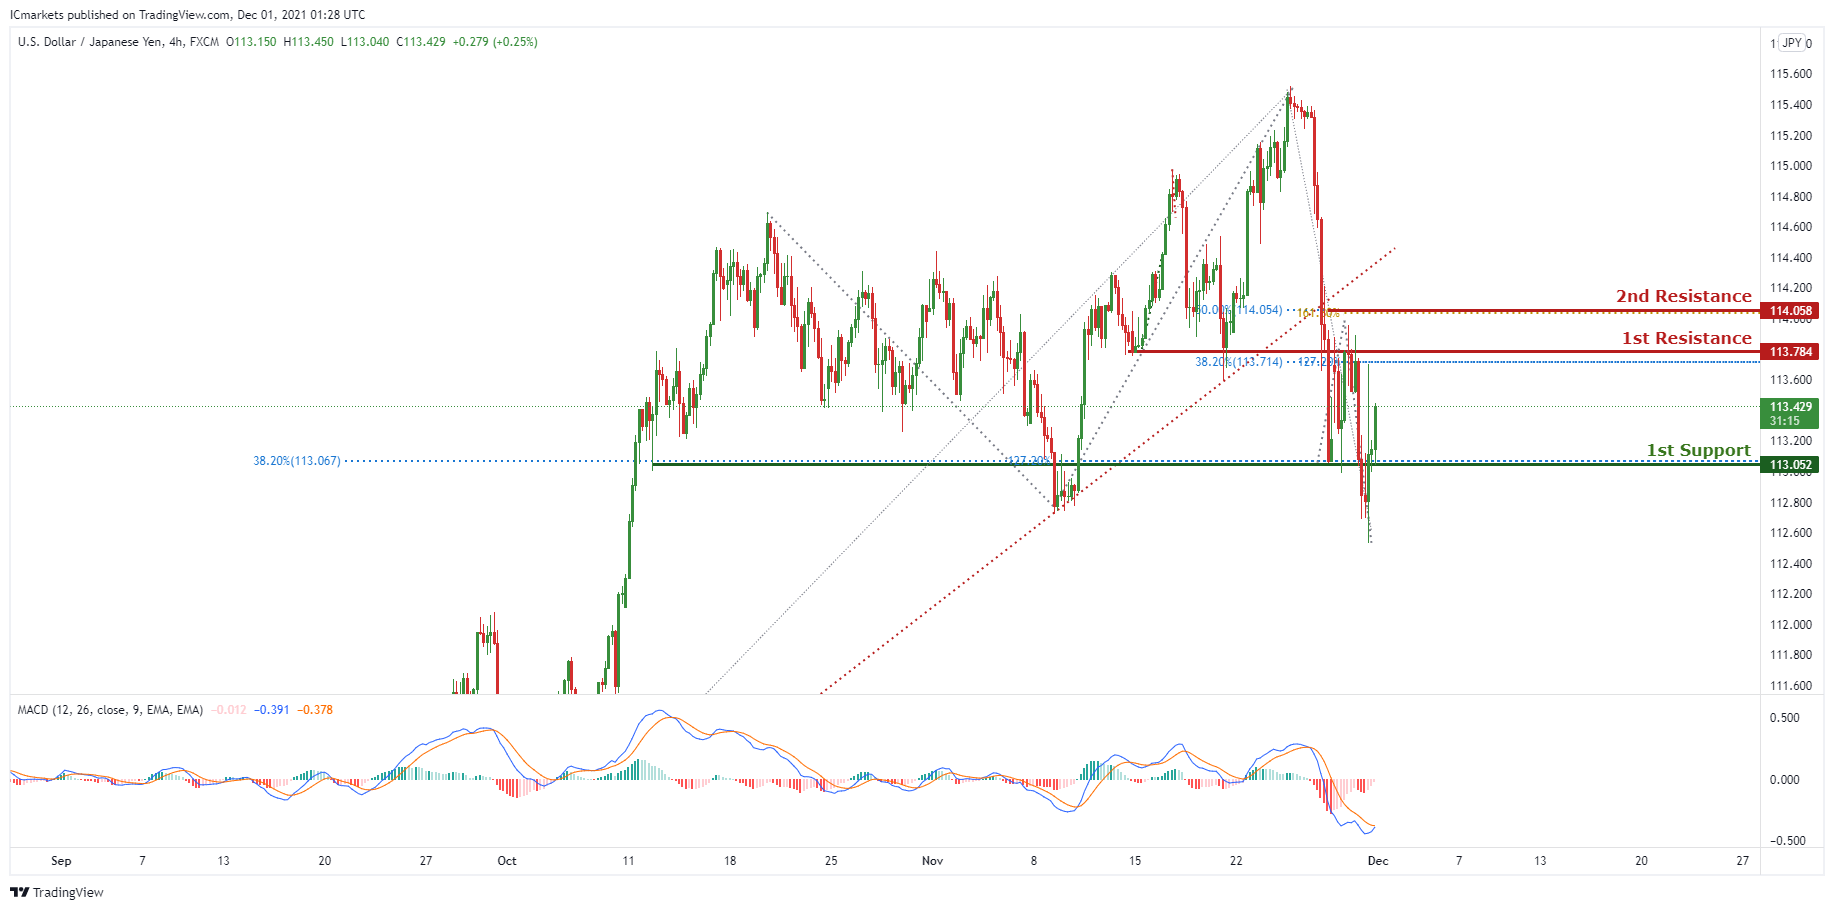
USD/JPY:
In reference to yesterday’s analysis, price indeed reached the 1st Support @ 113.052. On the H4 timeframe, price broke out of the ascending trendline support, signifying a bearish momentum. We can now expect price to drop from 1st Resistance in line with 38.2% Fibonacci retracement and 127.2% Fibonacci projection towards 1st Support in line with 127.2% FIbonacci projection and 38.2% Fibonacci retracement. Our bearish bias is further supported by the MACD indicator where the signal line crossed over the MACD line.
Areas of consideration:
- H4 1st resistance level 113.784
- H4 1st support level 113.052
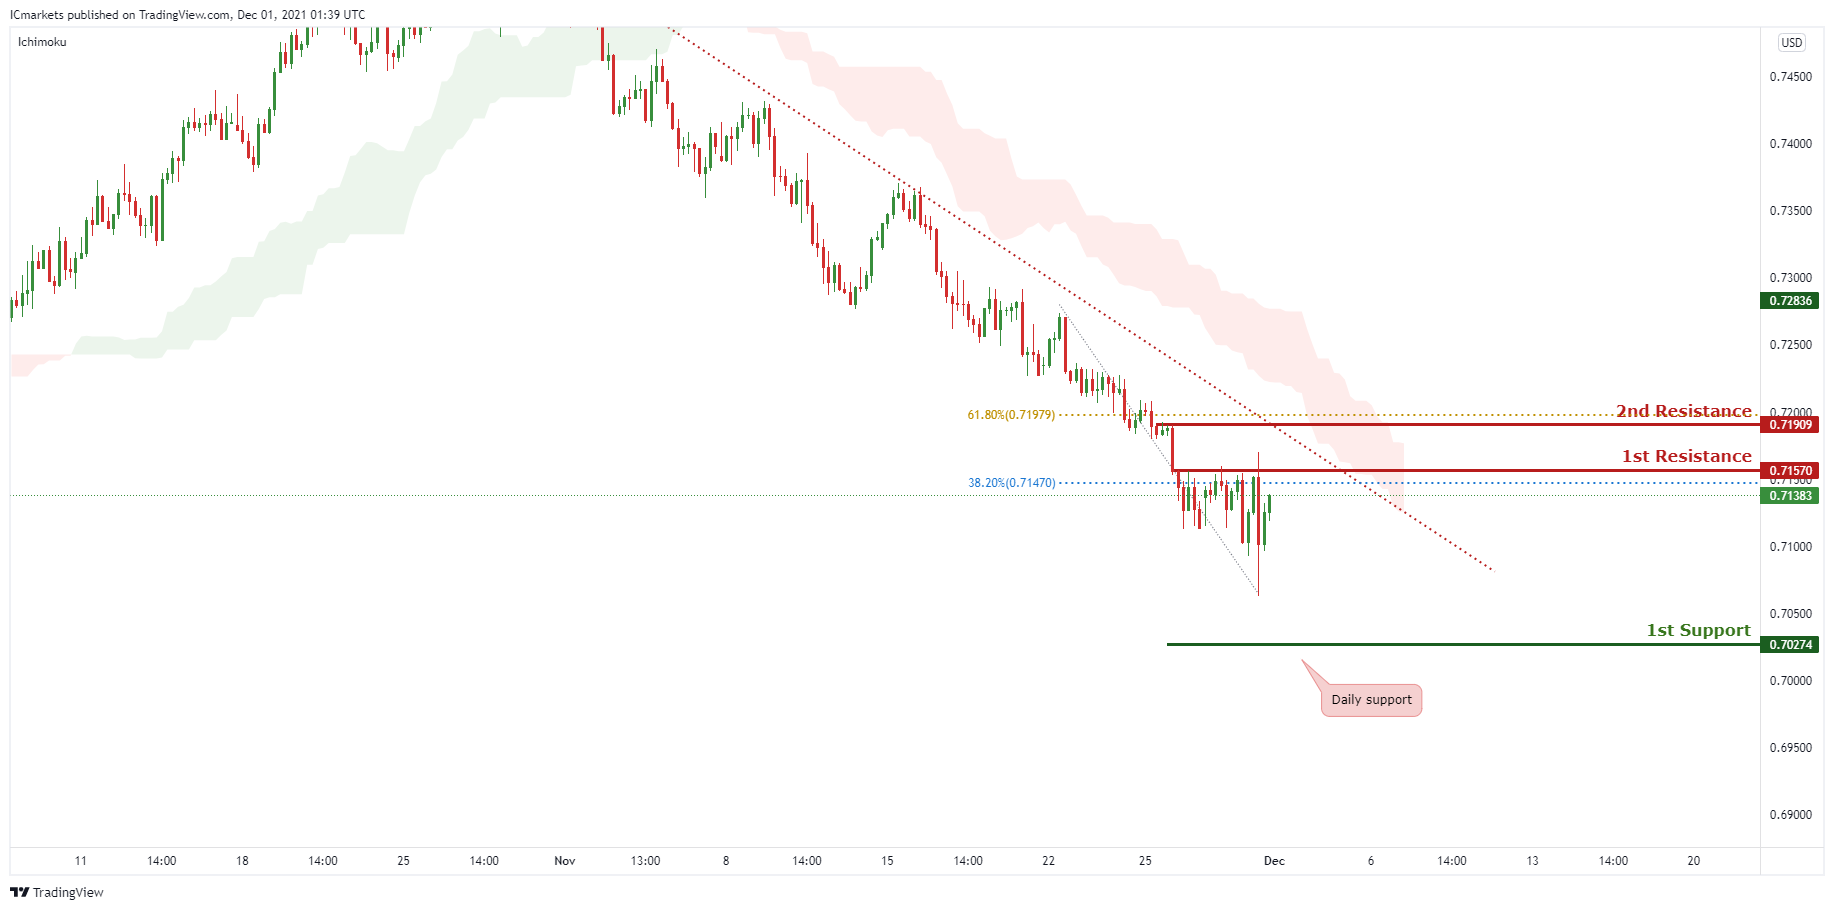
AUD/USD:
In reference to yesterday’s analysis price indeed reached the 1st Resistance level @ 0.71779. On the H4, price is abiding to the descending trendline resistance, signifying bearish momentum. We can expect the price to drop from 1st Resistance 38.2% Fibonacci retracement towards 1st Support in line with daily support. Our bearish bias is further supported by the Ichimoku cloud indicator where price is holding below it.
Areas of consideration:
- H4 1st resistance level 0.71570
- H4 1st support level 0.70274
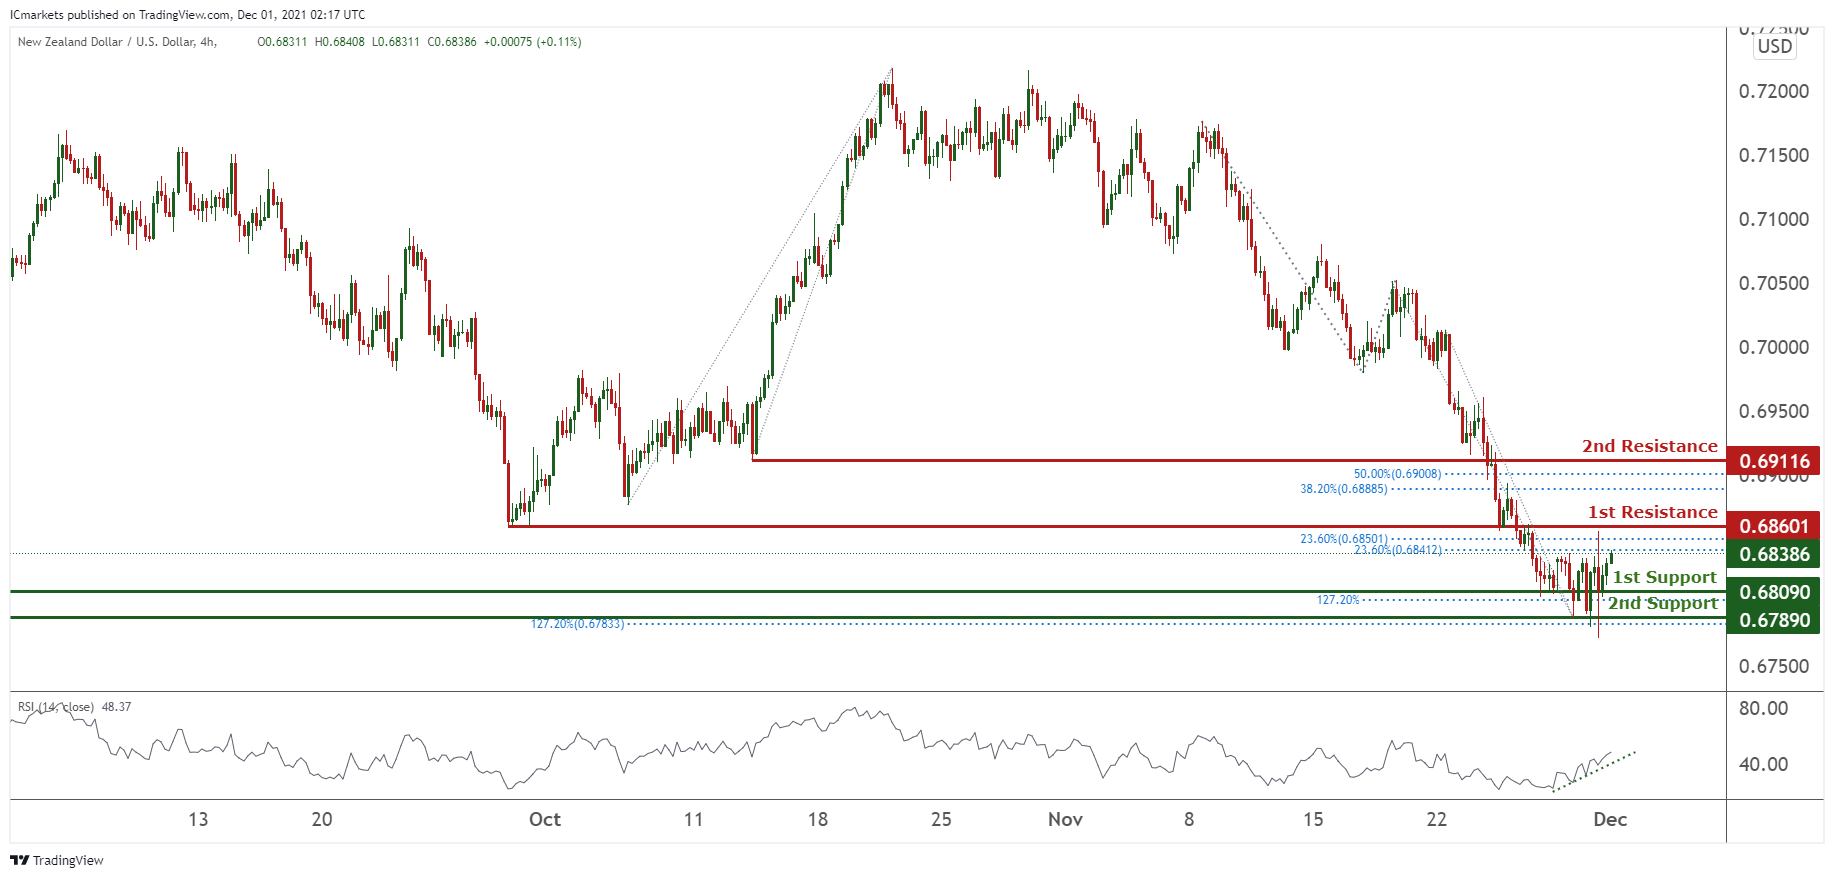
NZD/USD:
On the H4 timeframe, prices have recently experienced a reversal and are on bullish momentum. We see a potential for a bounce from our 1st support at 0.68090 in line with 127.2% Fibonacci extension towards our 1st resistance at 0.68601 in line with 23.6% and 23.6% Fibonacci retracement. Technical indicators are showing bullish momentum. If prices break our 1st support, prices can potentially dip further towards our 2nd support at 0.67890 which is in line with 127.2% Fibonacci extension and also a daily support.
Areas of consideration:
- H4 time frame, 1st resistance at 0.68601
- H4 time frame, 1st support at 0.68090
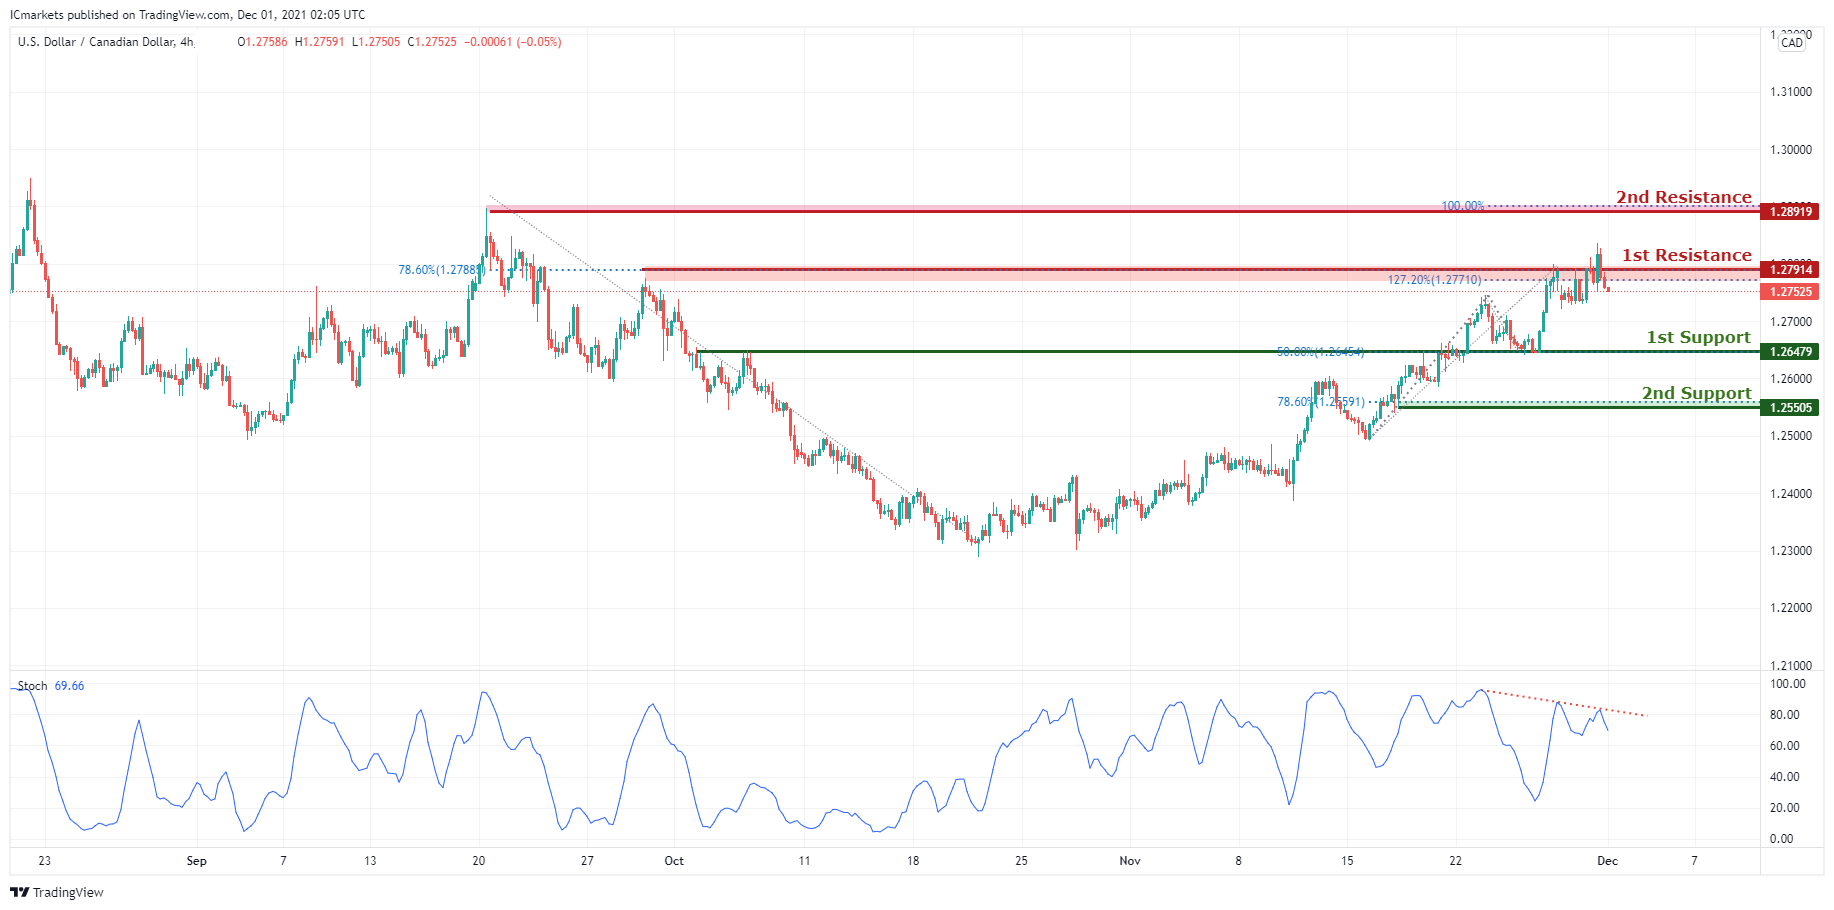
USD/CAD:
On the H4, with price approaching the resistance on the stochastics indicator, we have a bearish bias that price will drop to 1st support at 1.26479 in line with the graphical overlap support and 50% Fibonacci retracement and possibly to 2nd support at 1.25505 in line with the graphical swing low support and 78.6% Fibonacci retracement from 1st resistance at 1.27914 in line with the horizontal swing high resistance and 127.2% Fibonacci extension level. Alternatively, we may see price break 1st resistance structure and head for 2nd resistance at 1.28919 in line with the horizontal swing high resistance and 100% Fibonacci projection.
Areas of consideration:
- H4 time frame, support at 26479
- H4 time frame, resistance at 1.27914
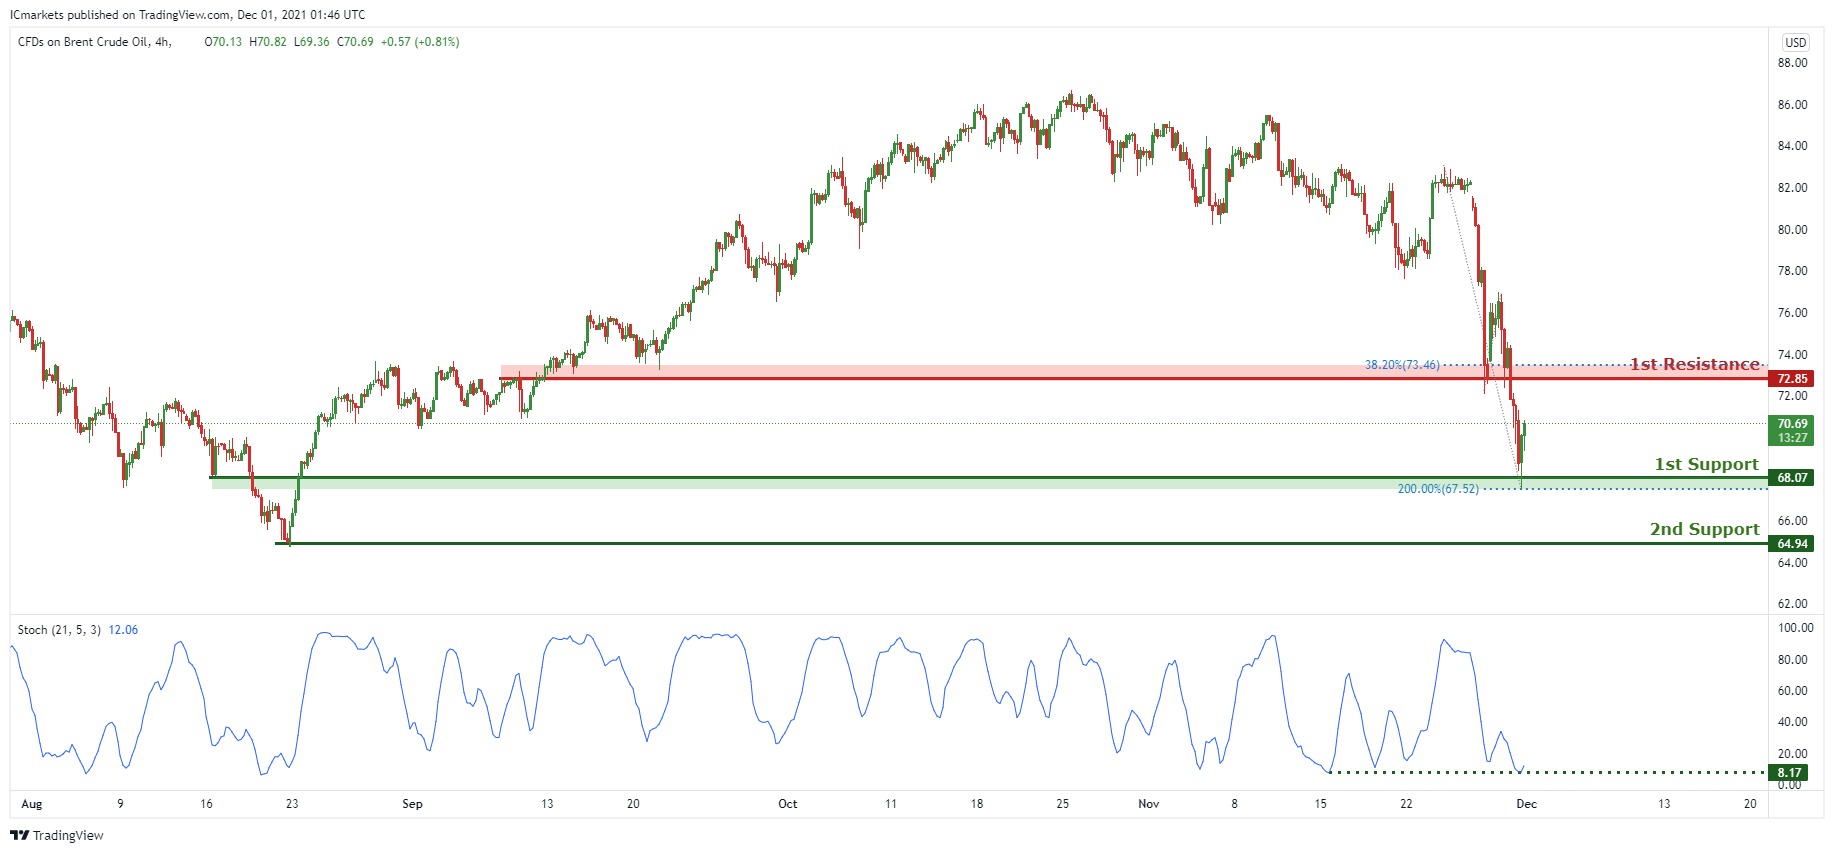
OIL:
On the H4 timeframe, with price rejecting the support on the stochastics indicator and the horizontal graphical level, we have a bias that price will rise from 1st support at 68.07 in line with the 200% Fibonacci projection and horizontal overlap support to 1st resistance at 72.85 in line with the horizontal overlap resistance and 38.2% Fibonacci retracement. Alternatively, price may break 1st support structure and head for 2nd support at 64.94 in line with the horizontal swing low support.
Areas of consideration:
- H4 time frame, 1st resistance of 72.85
- H4 time frame, 1st support of 07
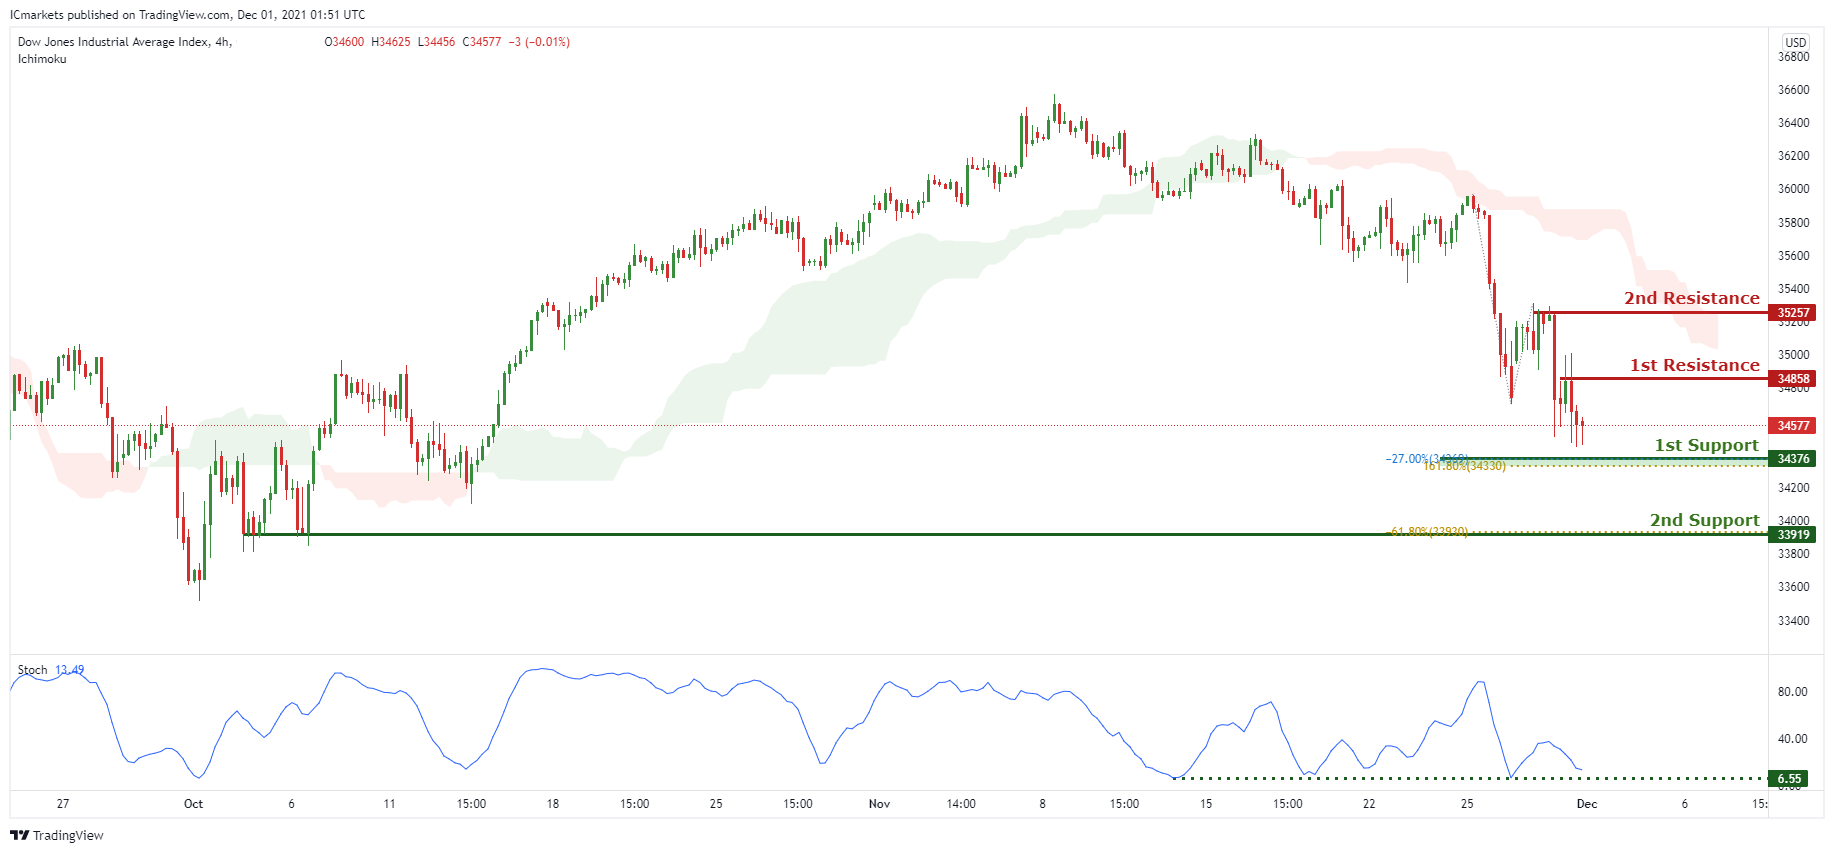
Dow Jones Industrial Average:
On the H4, with price moving below the ichimoku cloud and approaching the support of the stochastics indicator, we are bias that price still have some room for a bearish move and will drop to 1st support at 34376 in line with the -27% Fibonacci expansion and 161.8% Fibonacci extension. We then expect to see a possible bounce from 1st support to 1st resistance at 34858 in line with the horizontal swing high resistance and possible to 2nd resistance at 35257 in line with the horizontal swing high resistance. Alternatively, price may break 1st support structure and head for 2nd support at 33919 in line with the horizontal swing low resistance and 61.8% Fibonacci retracement.
- 4H resistance at 34858
- 4H support at 34376
The accuracy, completeness and timeliness of the information contained on this site cannot be guaranteed. IC Markets does not warranty, guarantee or make any representations, or assume any liability regarding financial results based on the use of the information in the site.
News, views, opinions, recommendations and other information obtained from sources outside of www.icmarkets.com.au, used in this site are believed to be reliable, but we cannot guarantee their accuracy or completeness. All such information is subject to change at any time without notice. IC Markets assumes no responsibility for the content of any linked site.
The fact that such links may exist does not indicate approval or endorsement of any material contained on any linked site. IC Markets is not liable for any harm caused by the transmission, through accessing the services or information on this site, of a computer virus, or other computer code or programming device that might be used to access, delete, damage, disable, disrupt or otherwise impede in any manner, the operation of the site or of any user’s software, hardware, data or property.


