
Key risk events today:
US ADP Non-Farm Employment Change; US ISM Manufacturing PMI.
(Previous analysis as well as outside sources – italics).
EUR/USD:
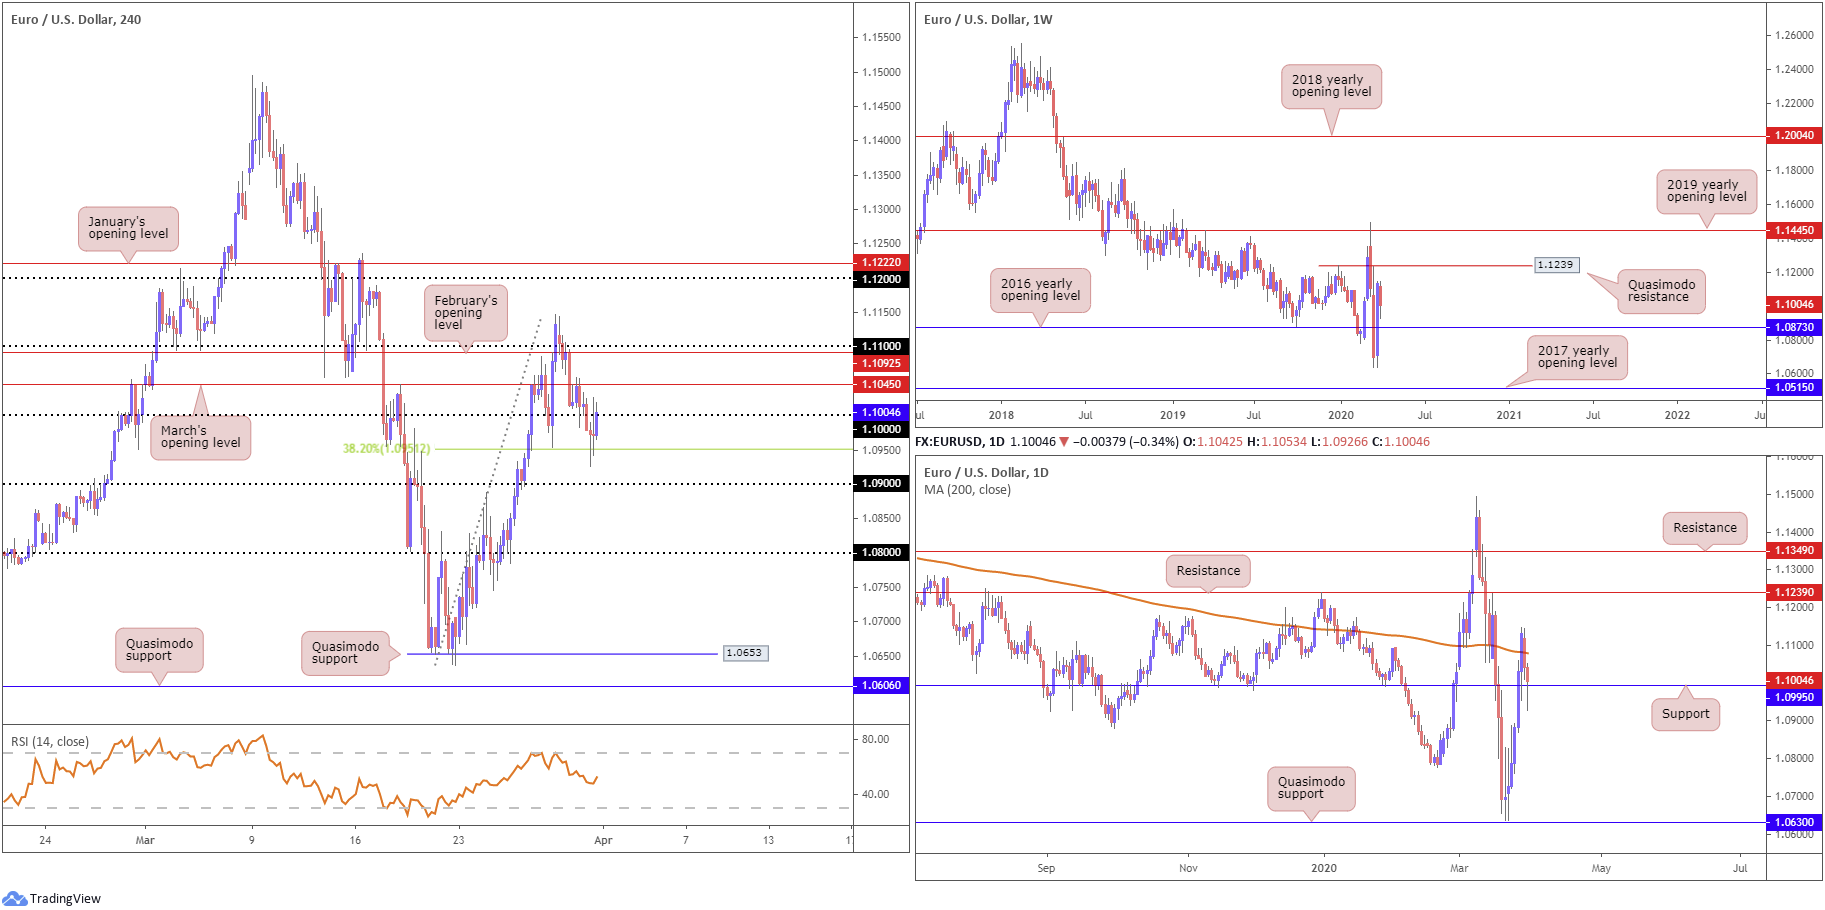
The US dollar index failed to glean much impetus from better-than-expected Chicago PMI or US consumer confidence (dropped to 120 in March from 132.6 in February despite stronger-than-expected reading) measures Tuesday, after topping a shade under the 100.00 handle. EUR/USD clocked session lows of 1.0926 a few hours ahead of US trade, whipsawing through Friday’s low at 1.0953 and rebounding off the 38.2% Fibonacci retracement ratio at 1.0951. Later in the session, price revisited the underside of the 1.10 key figure, with a break highlighting March’s opening level at 1.1045, followed by February’s opening level at 1.1092 and the 1.11 handle.
On a wider perspective, weekly flow continues to meander between Quasimodo resistance at 1.1239 and the 2016 yearly opening level at 1.0873. This comes after an impressive recovery off multi-year lows at 1.0635 last week. The story on the daily timeframe shows price failed to sustain gains above the 200-day SMA (orange – 1.1079), recently shaking hands with support coming in at 1.0995. This, assuming the level takes hold, may pave the way for gains to resistance at 1.1239, essentially denoting the same level as the weekly Quasimodo resistance highlighted above. A break of 1.0995, however, may unlock the door for moves to the 2016 yearly opening level at 1.0873, mentioned above on the weekly timeframe.
Areas of consideration:
In the event the day ends by way of a hammer candlestick pattern (considered a bullish signal at troughs) on the daily timeframe, the rebound from daily support at 1.0995 could be meaningful, targeting moves north of the 200-day SMA towards daily resistance at 1.1239. As already noted, this level also resembles a weekly Quasimodo resistance base.
Additional short-term long entries appear feasible north of 1.11 on the H4 timeframe, with upside potentially clear to 1.12, followed by January’s opening level at 1.1222.
GBP/USD:
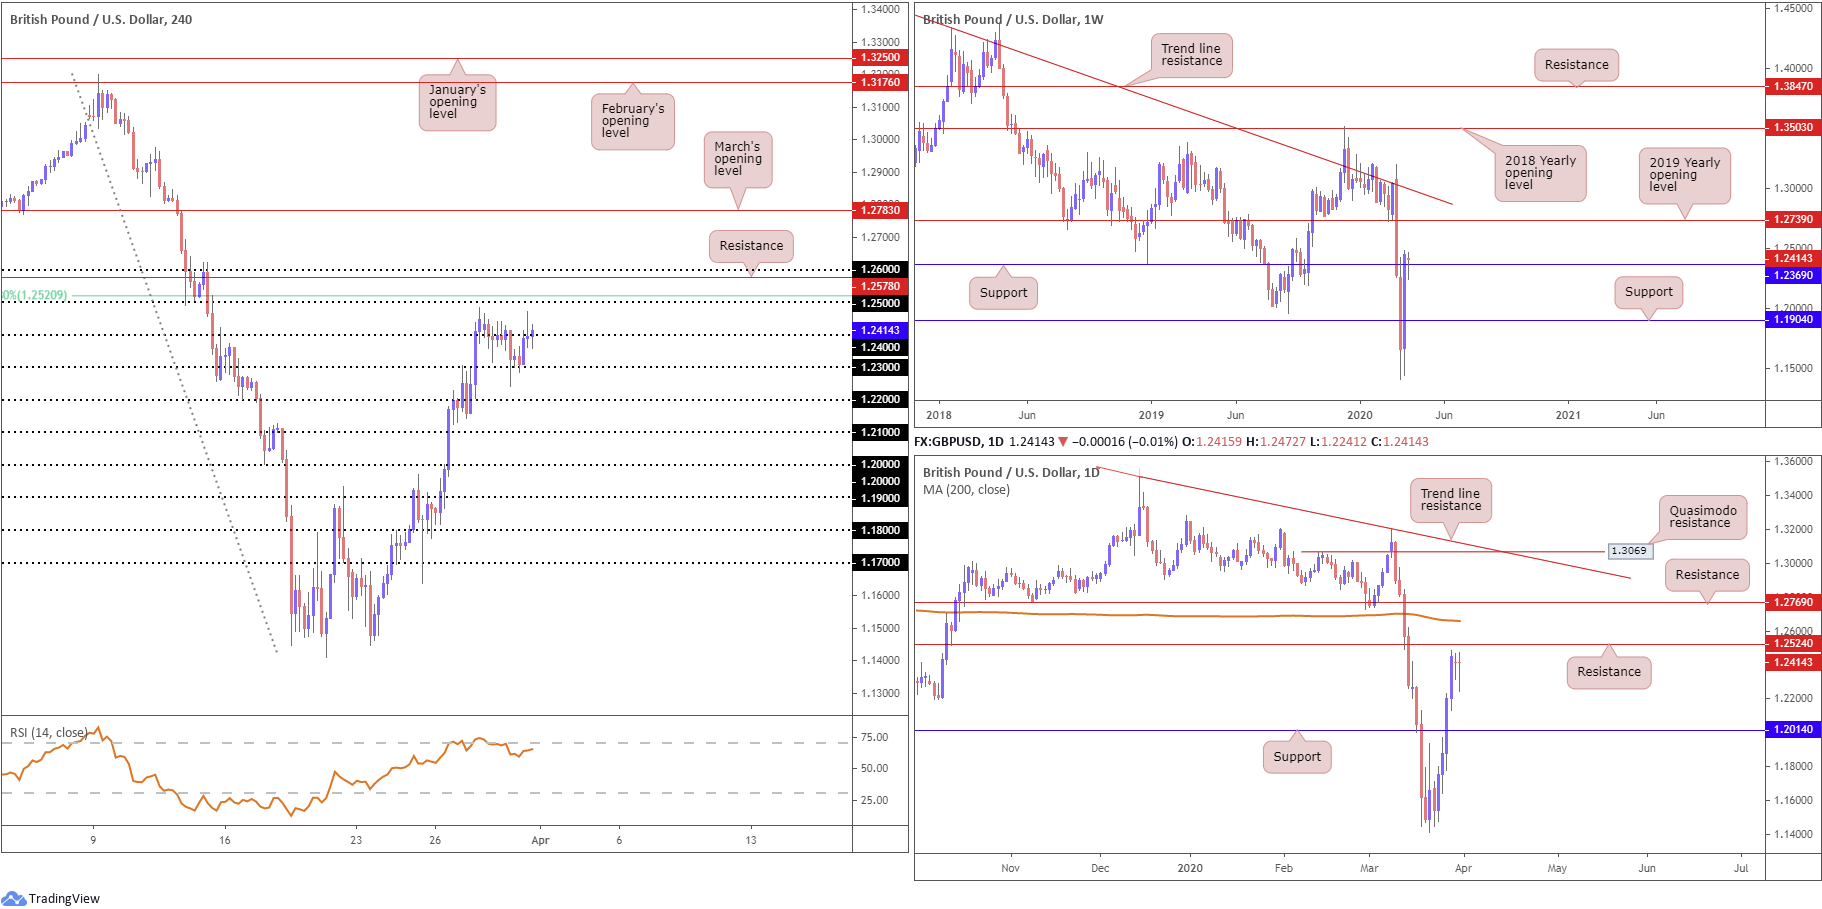
A run to the downside Tuesday saw price glide through 1.23 to lows of 1.2241, before regrouping and reclaiming 1.23+ status. Opening hours in London invited a retest at 1.23 as support, consequently lifting price more than 150 points to highs of 1.2473, before returning to 1.24ish into the closing hours.
Should 1.24 echo a supportive tone today, traders are urged to key in the 1.25 handle and 61.8% Fibonacci retracement ratio at 1.2520. A violation of this region could also persuade further gains to resistance at 1.2578, taken from July 2019, and the round number 1.26. It may also interest some traders to note the relative strength index (RSI) is seen engaging nearby overbought levels.
Nothing standout in terms of movement on the bigger picture. Last week’s vigorous climb firmed above weekly resistance at 1.1904 and 1.2369, with the latter currently being retested as support. The next upside target falls in around the 2019 yearly opening level at 1.2739, with a break exposing long-term weekly trend line resistance, taken from the high 1.5930.
After crossing daily resistance at 1.2014 (now a serving support), resistance lies in wait around the 1.2524 neighbourhood, trailed closely by the 200-day SMA (orange – 1.2661). Traders will also note Tuesday’s action printed its second consecutive indecision candle.
Areas of consideration:
Higher-timeframe projections on the weekly timeframe forecasts additional gains until shaking hands with 1.2739. Daily resistance at 1.2524 may throw a spanner in the works, however.
There’s not much (technical) evidence to suggest we’re heading beneath 1.24. 1.25 is the more likely destination, owing to its surrounding confluence from a 61.8% H4 Fibonacci ratio at 1.2520 and daily resistance at 1.2524. Therefore, this zone could be an area countertrend traders look to fade, targeting 1.24.
The next port of resistance falls in around the 1.26 handle on the H4 timeframe, enhanced by a H4 resistance level plotted at 1.2578, with the possibility of a fakeout seen to the 200-day SMA at 1.2660.
AUD/USD:
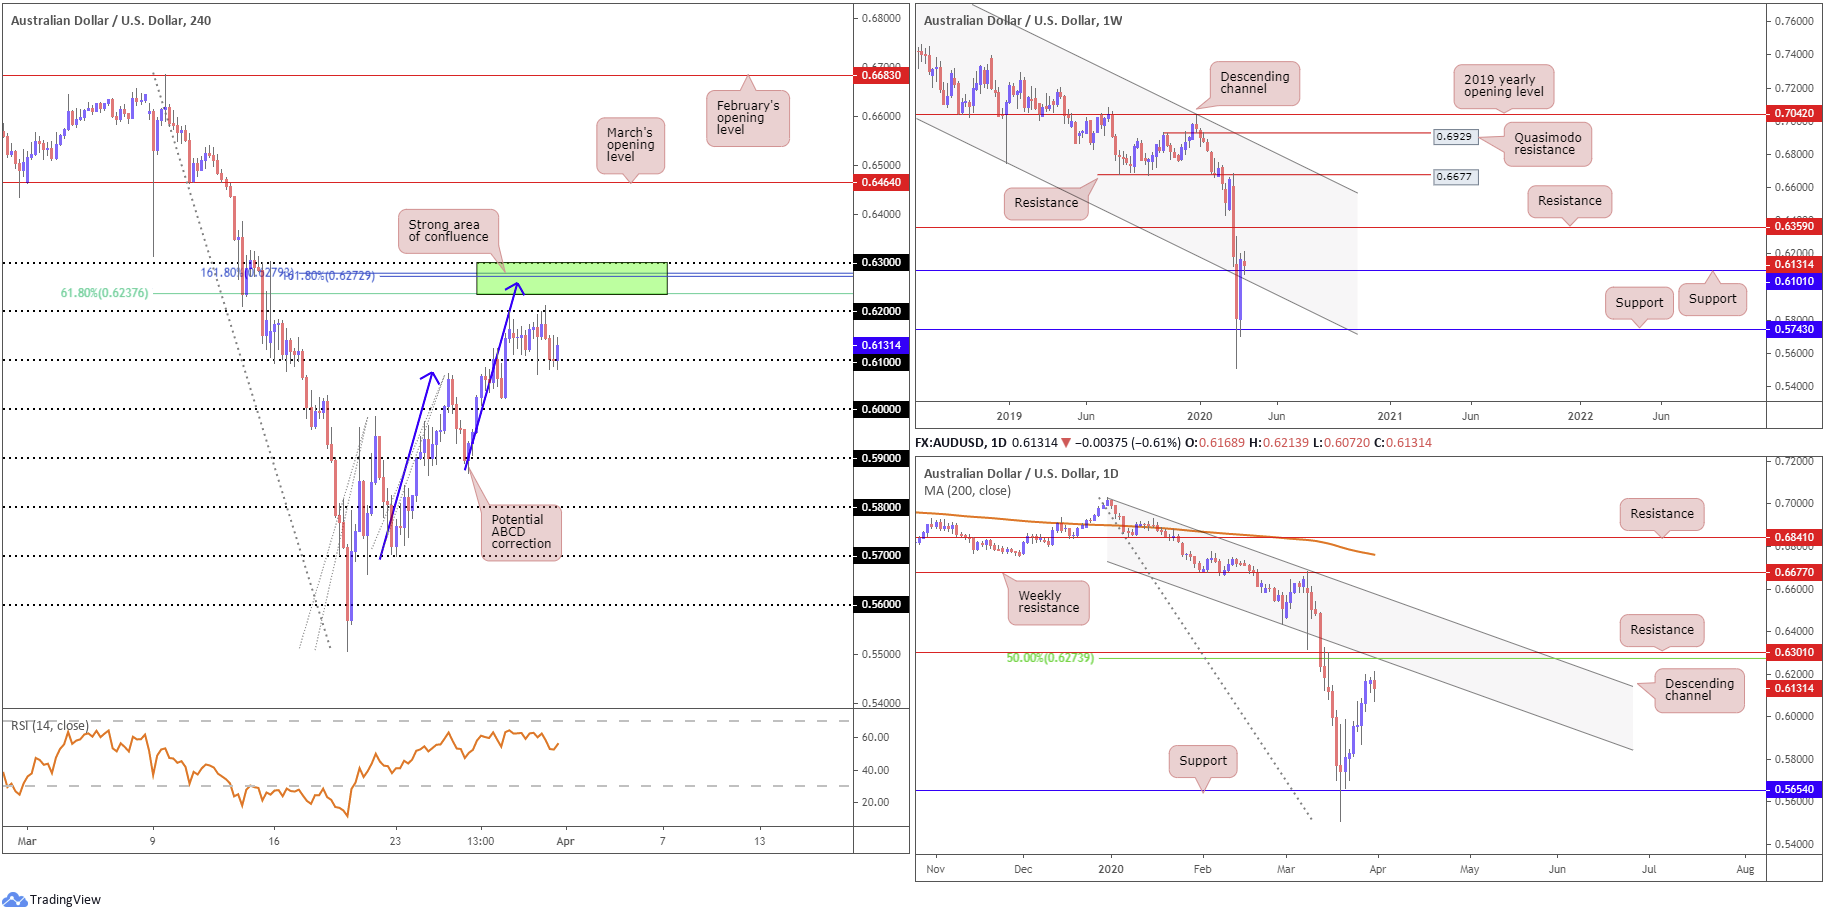
Post China manufacturing data observed AUD/USD latch onto a healthy bid in early trade Tuesday, exploring waters north of the 0.62 threshold, though failed to maintain an upside presence given the USD flexing its financial muscle into London’s session. As of current price, H4 movement is seen establishing a ‘floor’ off 0.61 with the possibility of revisiting 0.62 and, with a little oomph, potentially beyond.
Higher up on the curve, technical research has weekly price retesting support coming in at 0.6101, following last week’s vigorous upside. Resistance on this scale falls in around 0.6359.
Focus on the daily timeframe has shifted to resistance at 0.6301, despite yesterday’s activity producing a bearish outside day pattern. Joined closely with a 50.0% retracement ratio carved in at 0.6273 and a channel support-turned resistance, extended from the low 0.6433, this area could be an issue for buyers off the current weekly support.
Aside from H4 activity establishing ground above 0.61, what’s also notable from a technical perspective is a potential ABCD correction (blue arrows), terminating at 0.6255. Joining this region is the 0.63 handle, two 161.8% Fibonacci extensions at 0.6279 and 0.6272, a 61.8% Fibonacci retracement at 0.6237 and daily resistance at 0.6301 (green). The relative strength index (RSI), for those who follow momentum-based indicators, continues to struggle around 65.00, a touch south of traditional overbought ground.
Areas of consideration:
Traders’ crosshairs are likely fixed on 0.63/0.6237 as an upside target for any long positions off 0.61.
Further to this, 0.63/0.6237 represents a potential spot to consider bearish setups, in view of supporting structure. Conservative traders will likely seek additional confirmation from this neighbourhood, however, owing to the possibility of a whipsaw through 0.63 – common viewing around psychological numbers.
USD/JPY:
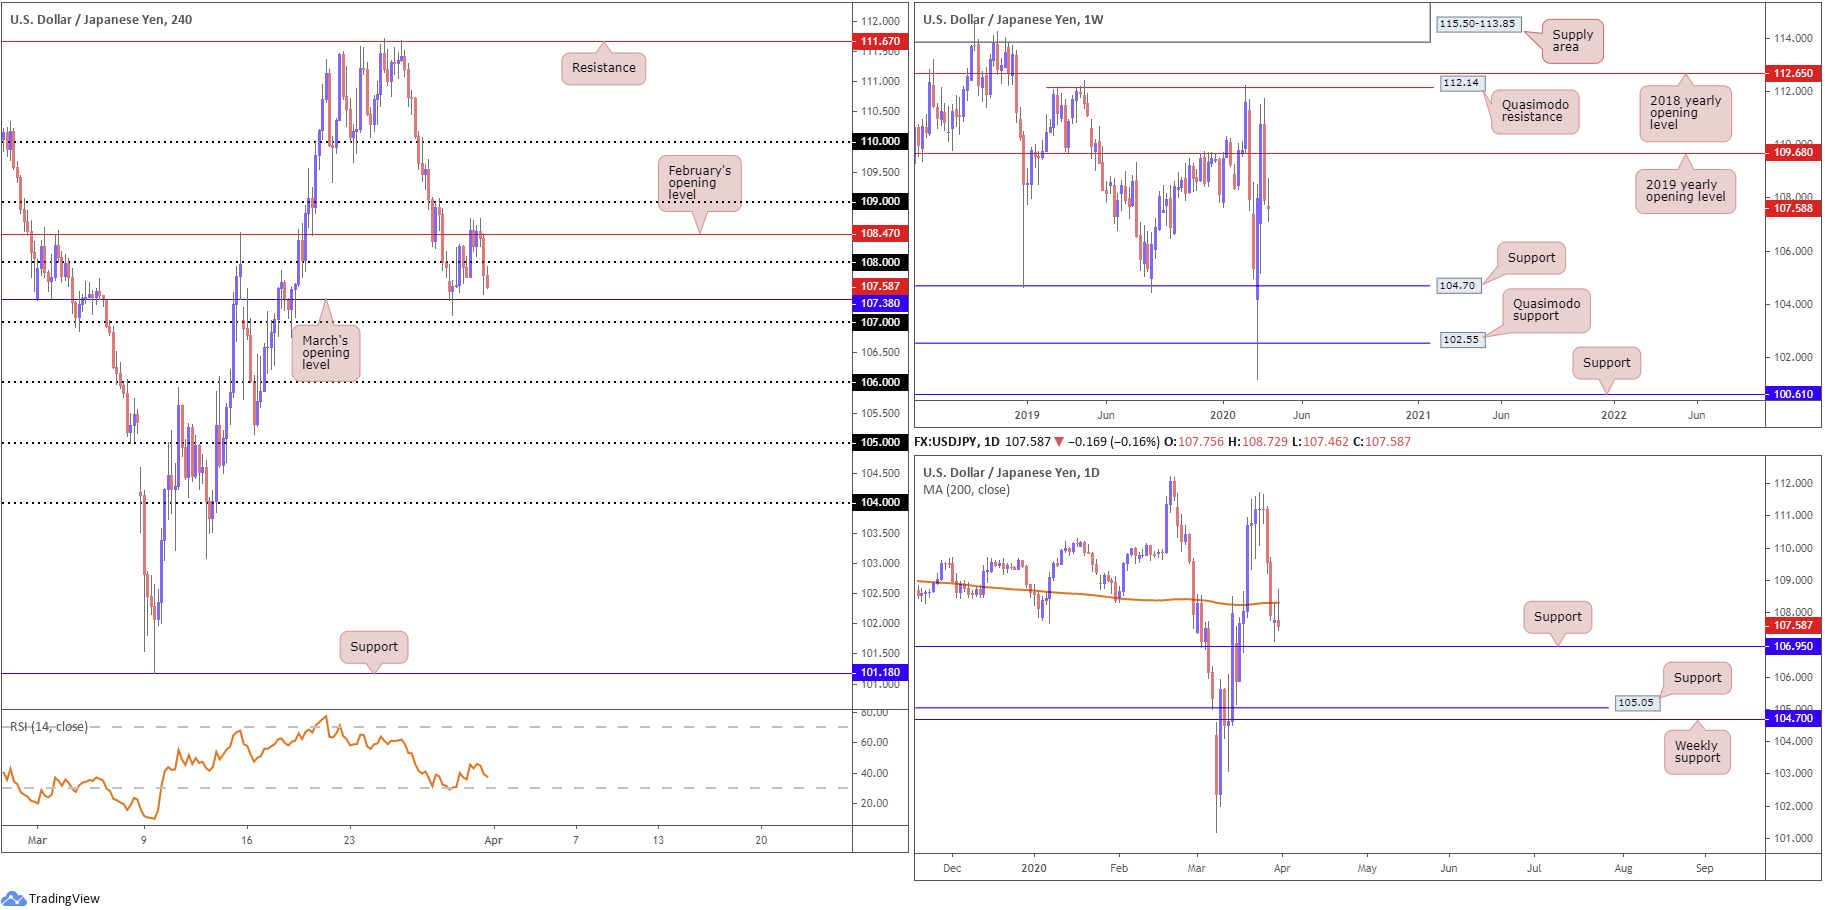
Buyers lost grip ahead of US trade Tuesday, unable to breach February’s opening level at 108.47. In lockstep with the US dollar index, USD/JPY erased intraday gains, conquering 108 to the downside with price action poised to tackle March’s opening level at 107.38, sited a few points above 107.
Beyond 108.47 we have 109 in sight, whereas a push through 107 underlines 106 as feasible support. The relative strength index (RSI) is seen holding oversold terrain, currently circulating the 40.00ish region.
Technical action on the weekly timeframe left Quasimodo resistance at 112.14 unopposed, and pared a large portion of the prior-week’s gains last week, wiping off more than 280 points. Sustained downside on this timeframe is free to navigate lower levels until touching gloves with a familiar area of support coming in at 104.70. It might also interest some traders to note 104.70 denotes the lower boundary of a multi-month range between Quasimodo resistance mentioned above at 112.14.
Friday, based on the daily timeframe, surrendered considerable ground, with USD/JPY eventually dipping its toes south of the 200-day SMA (orange – 108.30) and exposing support off 106.95 (a prior Quasimodo support level – September 2019). Note price continues to test the underside of the said SMA value, ending Tuesday in the shape of a shooting star candlestick formation (considered a bearish signal at troughs).
Areas of consideration:
Having noted room to explore lower levels on the weekly timeframe, as well as daily price testing the underside of its 200-day SMA value, the 107 handle is likely the next port of call on the H4 timeframe, given it merges with daily support at 106.95 (the next downside target on the daily timeframe).
While a retest at 108 is desirable for potential shorting opportunities, March’s opening level at 107.38 on the H4 timeframe could still be problematic. Though given Monday’s deep test of the level, likely clearing the majority of buy orders, the path is perhaps clear for a run to 107.
USD/CAD:
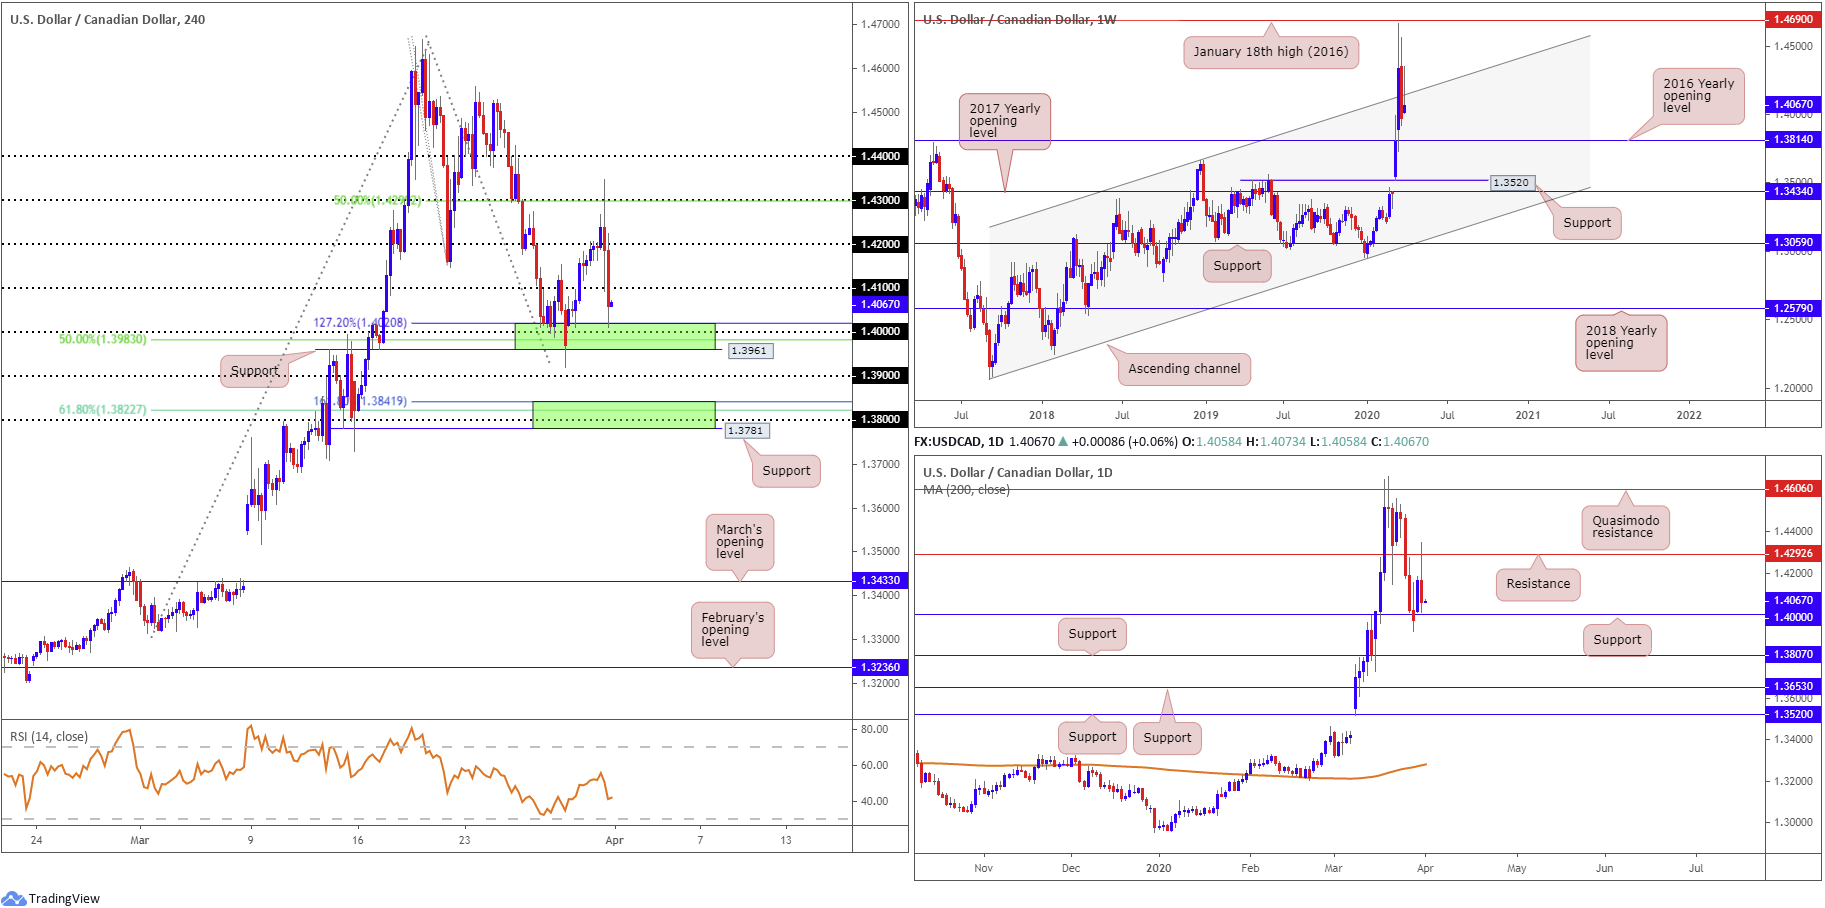
Kicking things off from the weekly timeframe this morning, we can see the current candle holding ground beneath channel resistance, extended from the high 1.3661, despite a sizeable move to levels just ahead of January 18th high at 1.4690 (2016) in recent trading. Support on this scale can be seen reasonably close by at the 2016 yearly opening level from 1.3814.
A closer reading of price action on the daily timeframe reveals notable rejection off resistance at 1.4292 yesterday, positioning price action within close proximity of support coming in at 1.4000. Support is seen at 1.3807, in the event we push lower.
Across the page on the H4 timeframe, 1.43, coupled with a 50.0% retracement ratio, held firm Tuesday, guiding USD/CAD through 1.42 and 1.41 to a 127.2% Fibonacci extension base at 1.4020. This marks the top edge of a familiar area of support, made up of the round number 1.40, a 50.0% retracement at 1.3983 and support coming in at 1.3961.
Levels beyond 1.3961/1.4020, assuming we overthrow 1.39, points towards 1.3781/1.3841 (lower green), comprised of H4 support at 1.3781, the 1.38 handle, a 61.8% Fibonacci retracement at 1.3822 and a 161.8% Fibonacci extension point at 1.3841.
Areas of consideration:
Weekly price suggests an extension to the downside might be in store to the 2016 yearly opening level at 1.3814. Daily support at 1.4000, however, may hamper downside on the weekly scale.
1.3961/1.4020 could hold a second time, with longs likely expecting a break above 1.41.
1.3781/1.3841 will also likely be interpreted as a potential reversal zone, not only due to its H4 confluence, but also given weekly and daily support reside within the area as well (1.3814/1.3807).
USD/CHF:
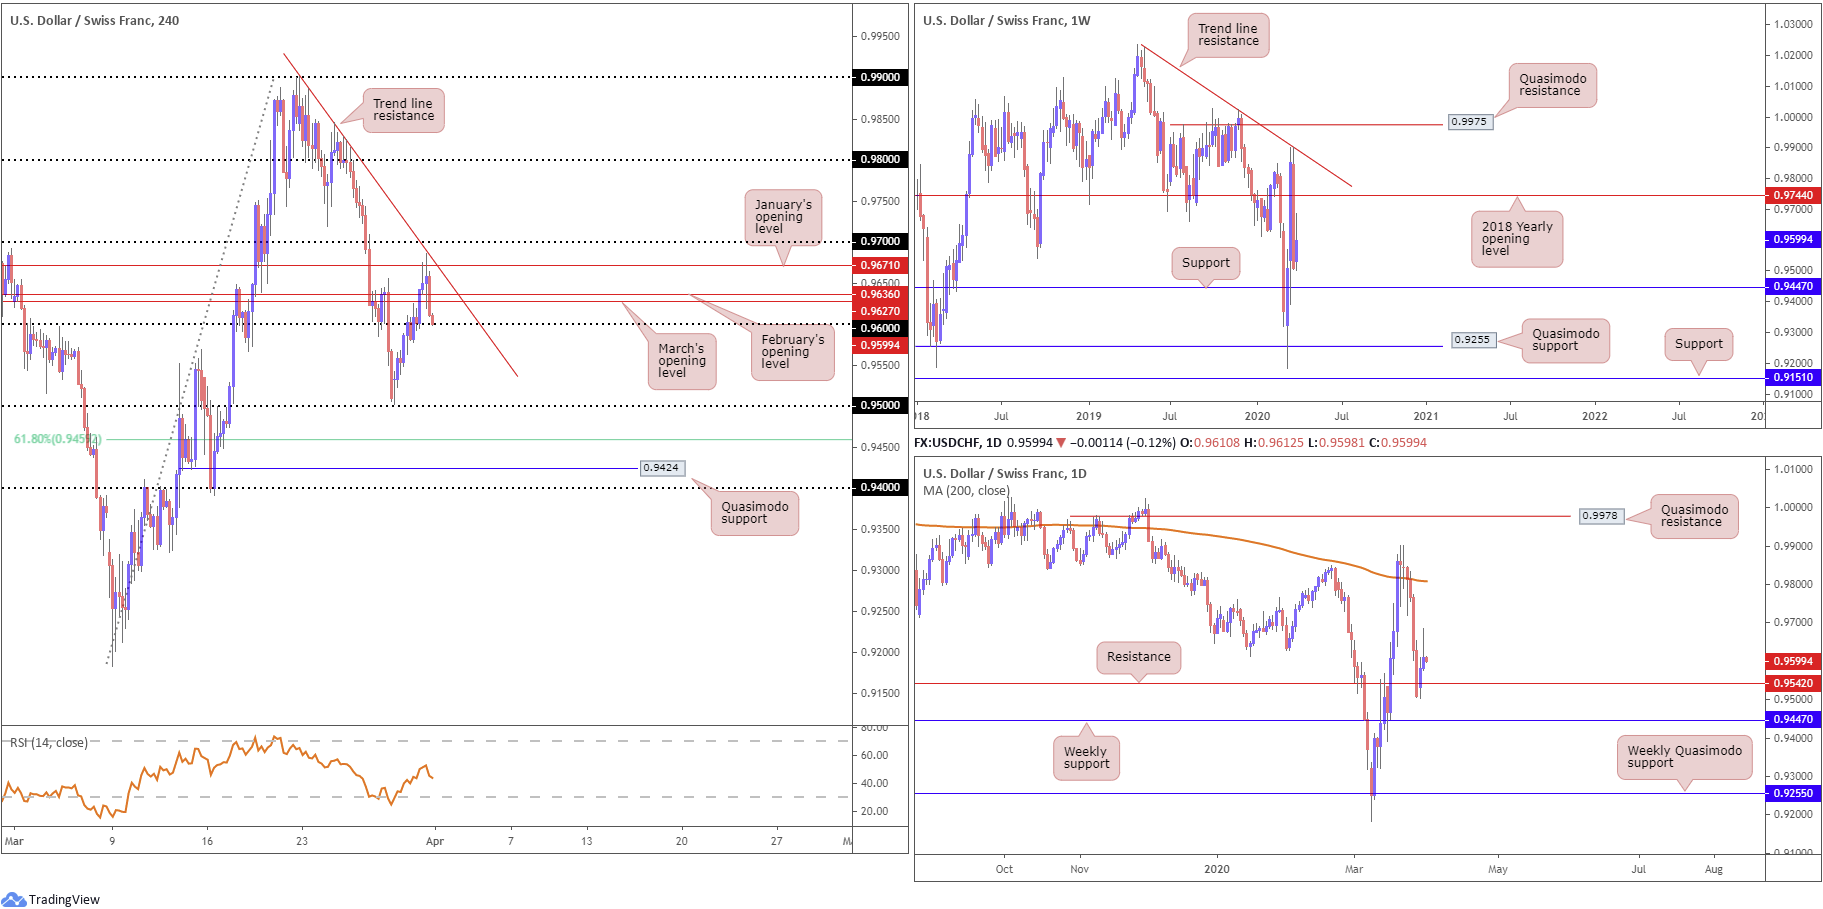
Early US hours Tuesday witnessed price action fade session highs off January’s opening level at 0.9671, a few points south of trend line resistance, extended from the high 0.9900, and the 0.97 handle. Both February and March’s opening levels at 0.9636 and 0.9627 came under fire, with 0.96 now in the firing range.
Chart studies show buyers making little effort off 0.96 as of current price action, inviting the possibility of a break lower and consequently shining the spotlight on 0.95 as the next support target.
Technical development from the weekly timeframe has the unit trading beneath the 2018 yearly opening level at 0.9744, after fading trend line resistance, etched from the high 1.0236, last week. The outlook on the weekly timeframe appears prepped for additional loss to support at 0.9447, with a break exposing Quasimodo support at 0.9255.
After failing to sustain upside north of the 200-day SMA (orange – 0.9808) on the daily timeframe, support coming in at 0.9542 entered the fight. Monday chalked up a reasonably positive rebound, though Tuesday faltered at highs from 0.9577, forming the basis for a shooting star bearish candlestick configuration.
Areas of consideration:
Given both weekly and daily timeframes point to lower levels, moves under 0.96 on the H4 scale should not surprise.
In the event we print a H4 close south of 0.96, therefore, breakout selling may emerge. Conservative sellers here may opt to wait and see if a retest at 0.96 occurs before committing, targeting daily support at 0.9542 as the initial take-profit zone.
Dow Jones Industrial Average:
Tuesday had US equities trade lower into the quarter’s end, as investors faced the biggest quarterly drop for US stocks since the financial crisis. The Dow Jones Industrial Average declined 410.32 points, or 1.84%; the S&P 500 also erased 42.06 points, or 1.60%, and the tech-heavy Nasdaq 100 concluded lower by 75.51 points, or 0.96%.
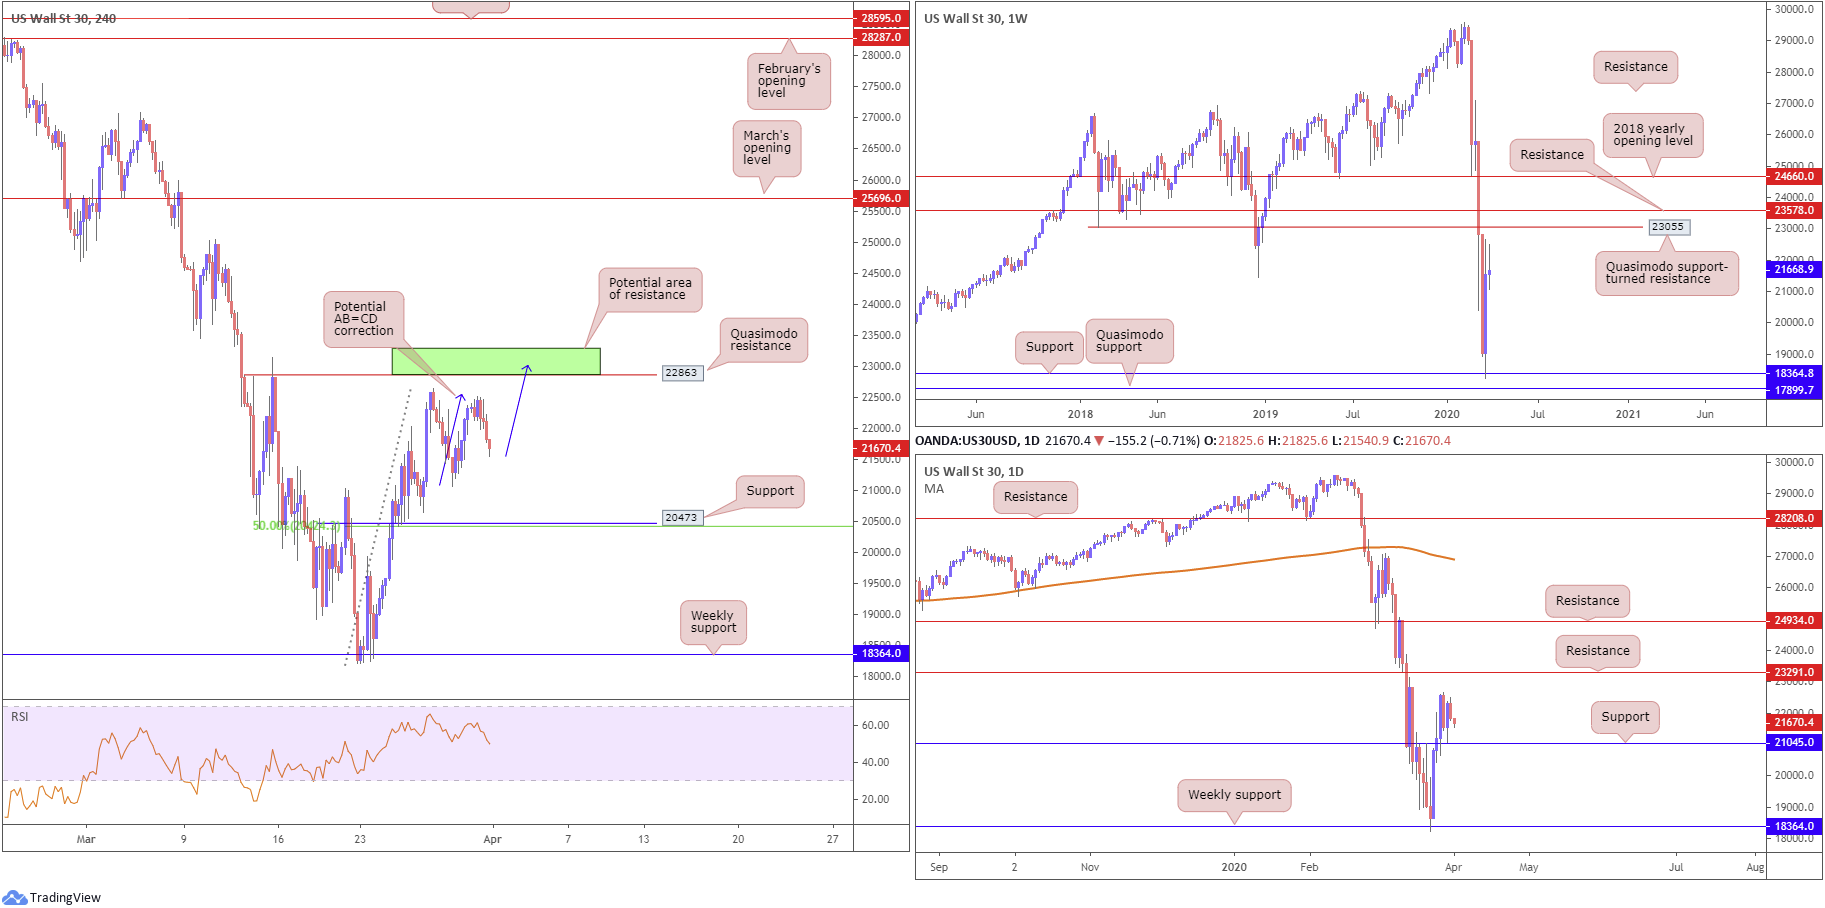
From a technical perspective, weekly price continues to languish beneath Quasimodo support-turned resistance at 23055, following last week’s enthusiastic recovery off support at 18364. Daily price, on the other hand, is seen establishing ground just ahead of support at 21045, threatening the possibility of an approach to resistance pencilled in from 23291.
Across the page on the H4 timeframe, we can see price action hovering ahead of Quasimodo resistance at 22863. Also of interest is a possible AB=CD (black arrows) bearish pattern forming at 23046. In terms of support on this timeframe, we have 20473, alongside a 50.0% retracement at 20433, though before reaching this far south, daily support at 21045 is in sight.
Areas of consideration:
The reaction nearby daily support at 21045 may be enough to entice additional bullish sentiment, targeting daily resistance at 23291.Therefore, lower-timeframe entries long into this market may be an option.
23291/22863 (green) on the H4 timeframe also remains worthy of the watchlist as a potential resistance zone, comprised of weekly resistance around 23055, daily resistance at 23291 and H4 Quasimodo resistance at 22863.
XAU/USD (GOLD):
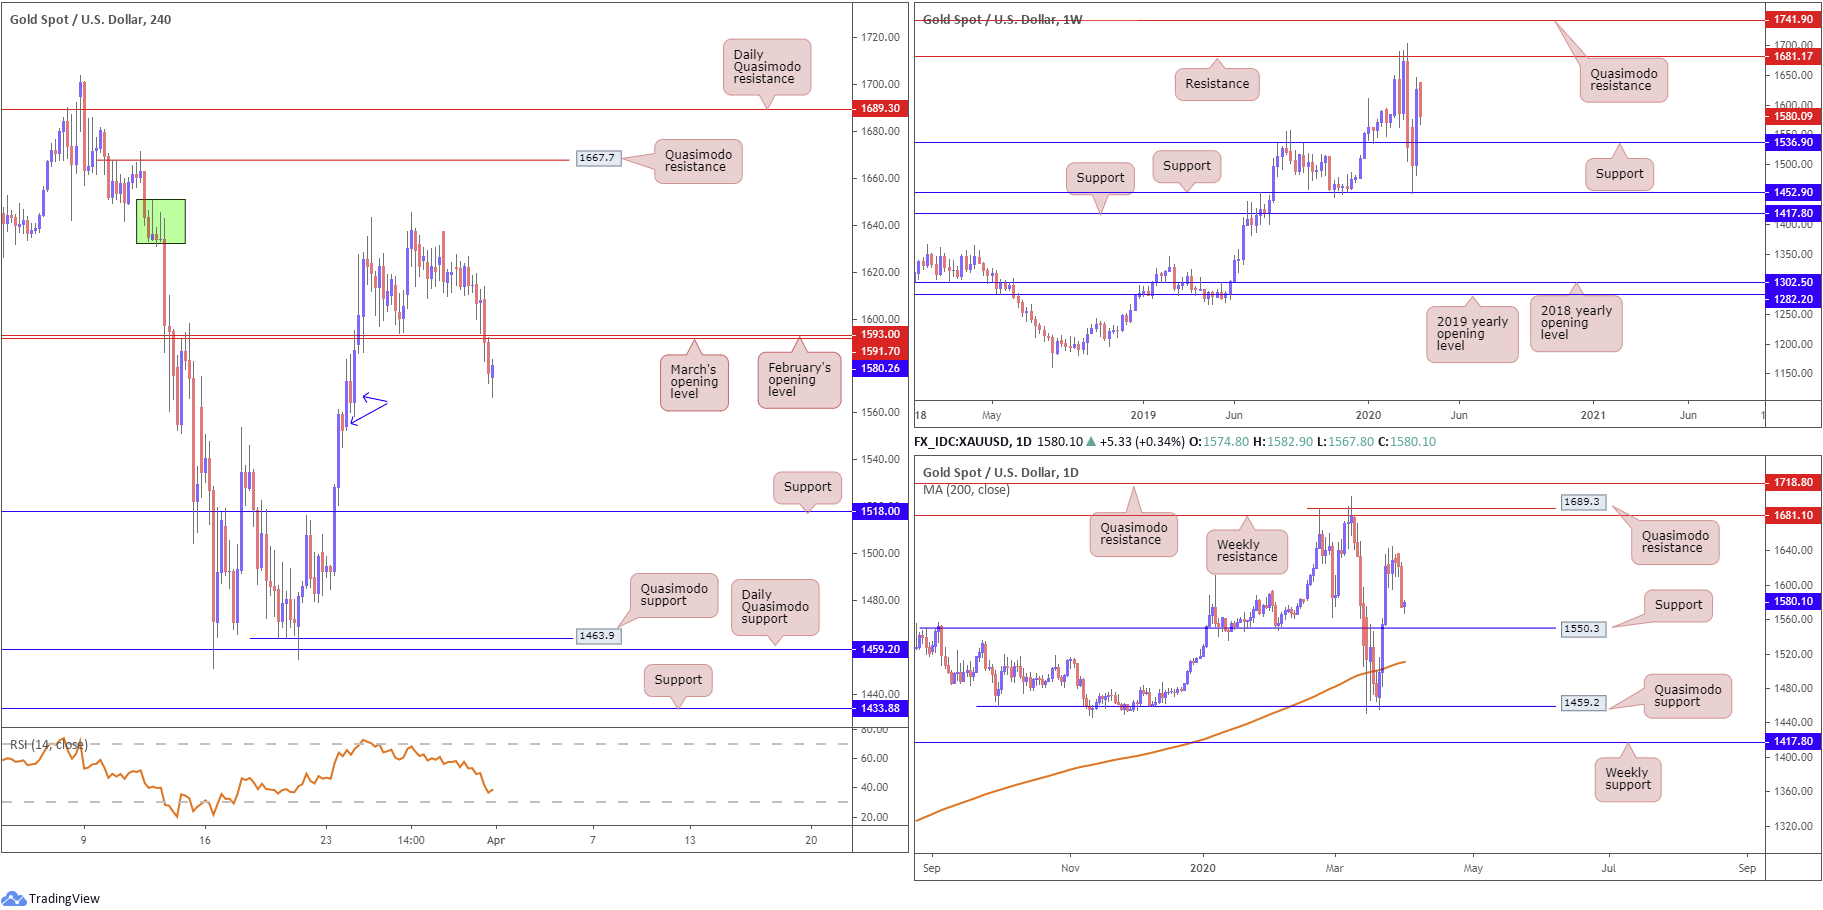
Absorbing bids from March and February’s opening levels at 1591.7/1593.0, bullion dipped to lows at 1573.8, forming a near-full-bodied daily bearish candle.
Beneath the said monthly opening levels, a lack of active demand is present (two blue arrows represent potentially weak zones). Gold upside will likely be capped by the noted monthly opening levels, consequently shining the spotlight on H4 support at 1518.0 as the next ‘floor’ on the H4 timeframe.
Weekly price appears poised to approach support at 1536.9, fading last week’s highs off 1645.5. Before we shake hands with 1536.9, though, daily support at 1550.3 must make an appearance.
Areas of consideration:
A retest at 1591.7/1593.0 is a potential scenario worthy of the watchlist today, having noted the possibility of moving lower on H4, daily and weekly timeframes. Conservative traders will likely opt to wait for additional candlestick confirmation to form before pulling the trigger, in order to help avoid a whipsaw.
The accuracy, completeness and timeliness of the information contained on this site cannot be guaranteed. IC Markets does not warranty, guarantee or make any representations, or assume any liability regarding financial results based on the use of the information in the site.
News, views, opinions, recommendations and other information obtained from sources outside of www.icmarkets.com.au, used in this site are believed to be reliable, but we cannot guarantee their accuracy or completeness. All such information is subject to change at any time without notice. IC Markets assumes no responsibility for the content of any linked site.
The fact that such links may exist does not indicate approval or endorsement of any material contained on any linked site. IC Markets is not liable for any harm caused by the transmission, through accessing the services or information on this site, of a computer virus, or other computer code or programming device that might be used to access, delete, damage, disable, disrupt or otherwise impede in any manner, the operation of the site or of any user’s software, hardware, data or property.


