Waiting for lower timeframe confirmation is our main tool to confirm strength within higher timeframe zones, and has really been the key to our trading success. It takes a little time to understand the subtle nuances, however, as each trade is never the same, but once you master the rhythm so to speak, you will be saved from countless unnecessary losing trades. The following is a list of what we look for:
- A break/retest of supply or demand dependent on which way you’re trading.
- A trendline break/retest.
- Buying/selling tails/wicks – essentially we look for a cluster of very obvious spikes off of lower timeframe support and resistance levels within the higher timeframe zone.
- Candlestick patterns. We tend to stick with pin bars and engulfing bars as these have proven to be the most effective.
We typically search for lower-timeframe confirmation between the M15 and H1 timeframes, since most of our higher-timeframe areas begin with the H4. Stops are usually placed 1-3 pips beyond confirming structures.
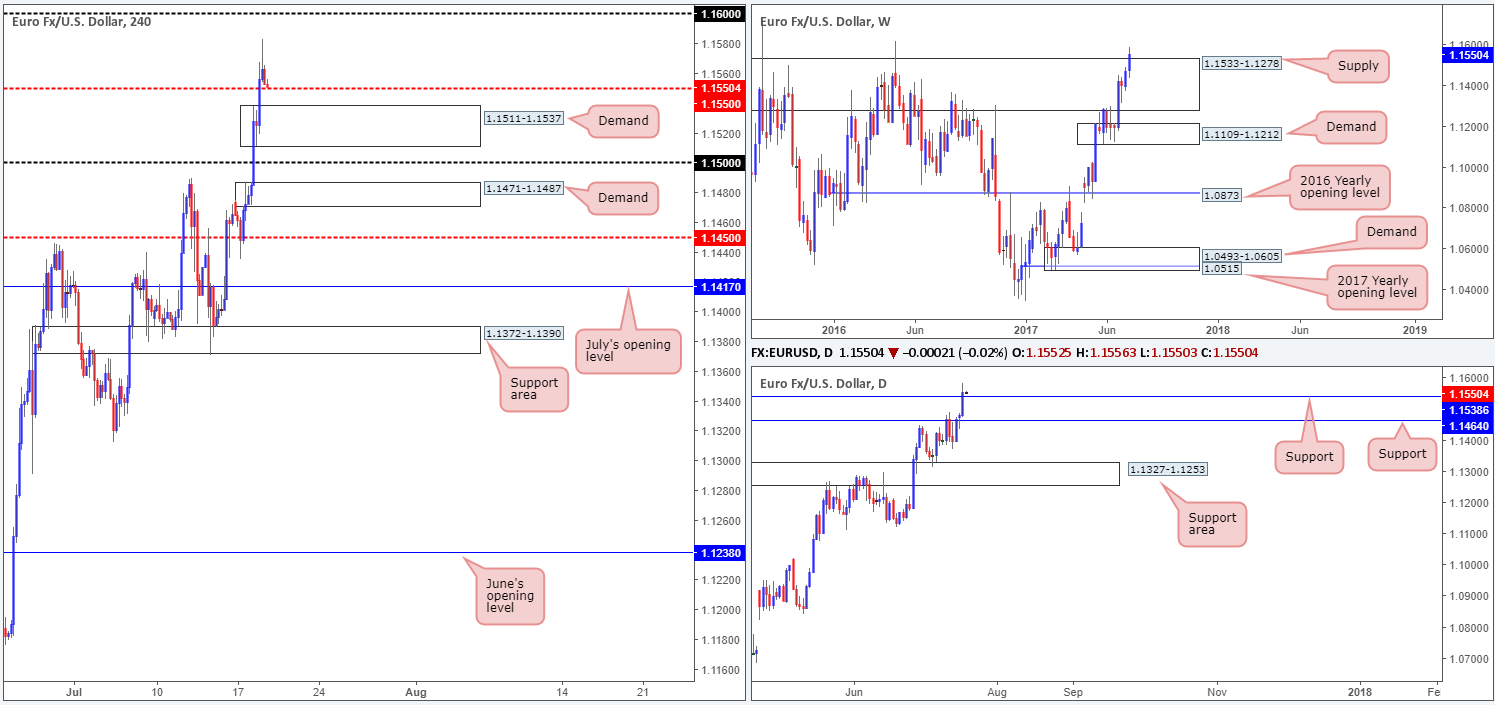
EUR/USD:
Across the board, we saw the US dollar trade lower yesterday, consequently forcing the EUR to a fresh high of 1.1583. The major weekly supply drawn from 1.1533-1.1278 is, as you can see, now under serious pressure. In the event that this area is finally consumed, we see absolutely no resistance on the weekly scale until the 1.20ish neighborhood! Down on the daily timeframe, yesterday’s run north ended with a close being formed above resistance at 1.1538. Providing that this line holds firm as support, the next upside target from here is a supply coming in at 1.1870-1.1786 (not seen on the screen).
Our suggestions: Across on the H4 chart, price is seen retesting the mid-level support at 1.1550. Assuming that this barrier holds, this could mean that we may be looking at a move up to the 1.16 handle sometime today. A break below 1.1550 on the other hand, will see the H4 candles almost immediately come into contact with the daily support at 1.1538, which happens to be positioned just a pip ahead of a H4 demand at 1.1511-1.1537.
Admittedly, we are tempted to begin looking for longs in this market, but at the same time remain slightly hesitant since we’ve seen weekly action peek above the aforesaid weekly supply before and then aggressively reverse back to the downside.
With that in mind, we’ve decided to remain on the sidelines going into today’s segment and will look to reassess structure tomorrow.
Data points to consider: US Housing data at 1.30pm GMT+1.
Levels to watch/live orders:
- Buys: Flat (stop loss: N/A).
- Sells: Flat (stop loss: N/A).
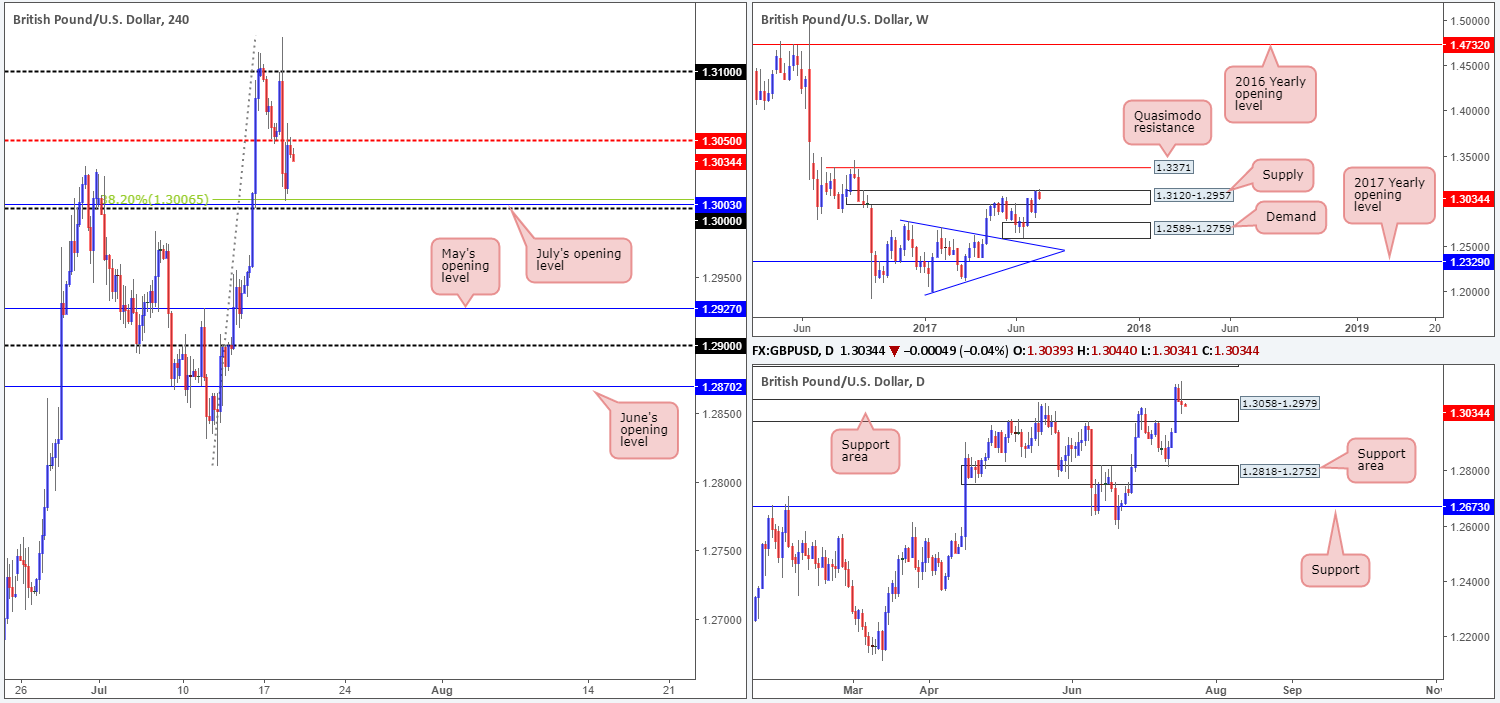
GBP/USD:
The pound took a bit of a hit to the mid-section on Tuesday after UK inflation numbers came in slightly lower than expected. The H4 mid-level barrier at 1.3050 was taken out as a result of this, leaving H4 price free to challenge the 38.2% Fib support at 1.3006 (drawn from the swing low at 1.2811), positioned just a few pips above the large psychological level 1.30 and July’s opening level at 1.3003.
While we can see that the bounce from 1.3006 brought prices back up to 1.3050, the bulls are seen struggling to muster enough strength to breach this level right now. According to the weekly timeframe, this market could see further selling due to the unit being sited deep within the walls of a supply at 1.3120-1.2957. The story on the daily chart on the other hand, places the candles within a support area set at 1.3058-1.2979.
Our suggestions: With 1.3050 currently holding strong, it is very likely that the 1.30 neighborhood will be challenged soon. We absolutely love the H4 confluence set around this number (see above), and also the fact that it is located within the aforesaid daily support area. Nevertheless, it would be unwise of us to dismiss where weekly price is trading from (supply) at the moment! Despite this, we still feel that a bounce is expected to be seen from here.
To be on the safe side though, our team will not commit UNTIL we have pinned down additional confirmation from the lower-timeframe candles (see the top of this report), as our first take-profit target is likely to be the nearby 1.3050 base. Ideally, you’ll want your stop to be no more than 20 pips as this will provide one with at least 2R to the first take-profit line.
Data points to consider: US Housing data at 1.30pm GMT+1.
Levels to watch/live orders:
- Buys: 1.30 region ([waiting for lower-timeframe confirmation to form is advised] stop loss: dependent on where one confirms this level).
- Sells: Flat (stop loss: N/A).
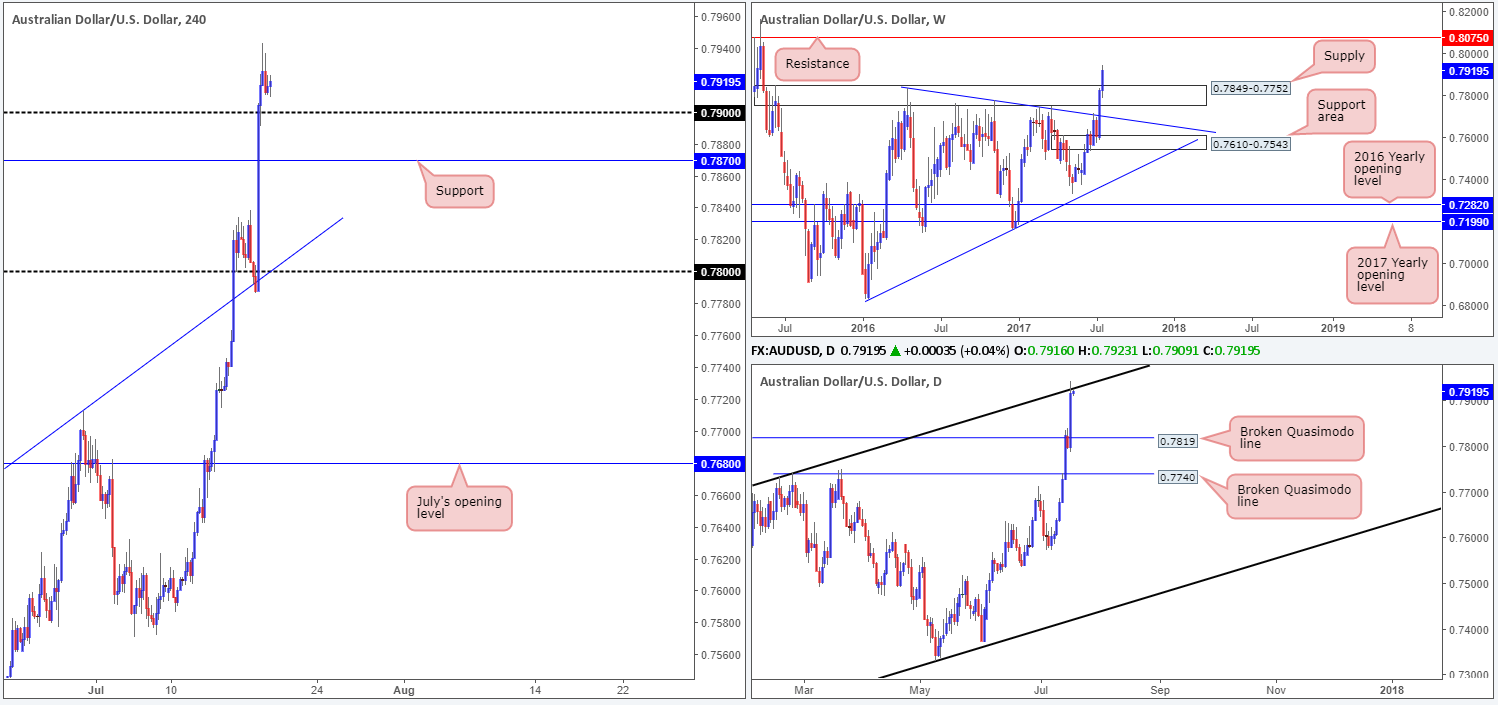
AUD/USD:
Following a bullish RBA minutes, the commodity currency aggressively bounced from the 0.78 region, which fused beautifully with a H4 trendline support etched from the high 0.7635. Prices advanced over 100 pips from here, eventually putting in a high of 0.7942 and closing the day beyond the 0.79 handle. This has, as far as we can see, cleared the path north for further buying up to the large 0.80 handle. What this recent move also accomplished was a clean break through weekly supply at 0.7849-0.7752. A continuation move from here could see the Aussie shake hands with a strong weekly resistance base at 0.8075.
Although we have weekly and H4 action echoing bullish tones right now, it might be worth noting that daily price is seen crossing swords with a channel resistance pegged from a high of 0.7732. Should this line hold steady, the next area of support can be seen at 0.7819: a recently broken Quasimodo line.
Our suggestions: While a great deal of traders will be eyeing the 0.79 handle for longs today, daily sellers could force price beyond this number and challenge the H4 support at 0.7870. As of this moment, we’re not satisfied with current structure, and feel trading it would be too much of a risk. Therefore, our plan of action is too wait for today’s segment to play out and then reassess structure going into tomorrow’s opening.
Data points to consider: US Housing data at 1.30pm GMT+1.
Levels to watch/live orders:
- Buys: Flat (stop loss: N/A).
- Sells: Flat (stop loss: N/A).
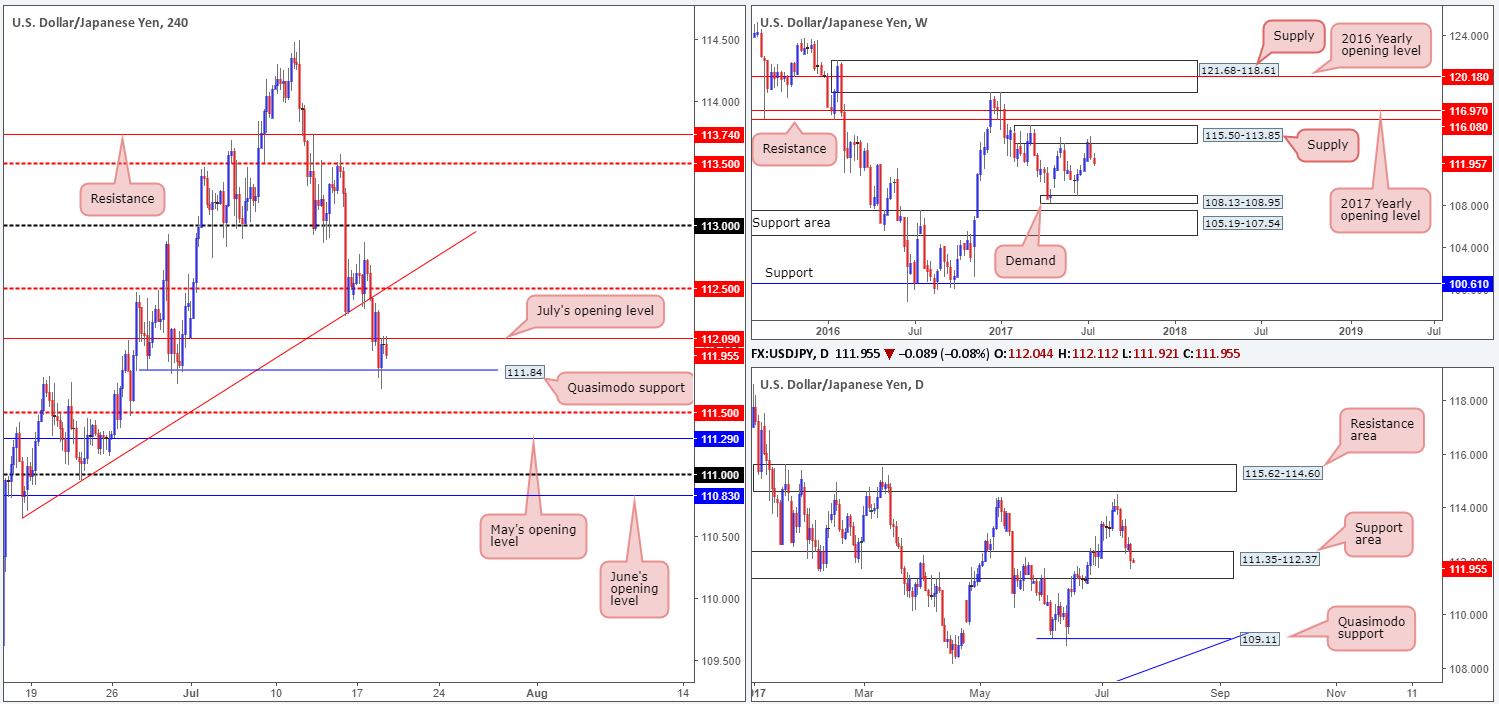
USD/JPY:
Since weekly price came into contact with supply at 115.50-113.85, the market has been trading with a strong bearish sentiment. Also of particular interest is that this timeframe shows room for price to climb down as far as weekly demand drawn from 108.13-108.95. Turning our attention to the daily candles, nevertheless, the unit is currently seen hovering inside a support area coming in at 111.35-112.37. So far though, there has been very little bullish intent registered from here.
Things over on the H4 timeframe look somewhat cramped at the moment. The Quasimodo support at 111.84 managed to hold price action higher as we entered yesterday’s US segment, but has failed to generate much follow through beyond July’s opening level at 112.09.
Our suggestions: Ultimately, our bias is positioned to the downside for the time being, largely due to the fact that we’re trading from weekly supply. However, selling is somewhat difficult on the H4 timeframe, given that beyond 111.84, we have a nearby mid-level support at 111.50, followed closely by May’s opening level at 111.29 and then the 111 handle! Not exactly ideal selling conditions!
With the above in mind, we’ll remain flat and wait for further developments to be seen.
Data points to consider: US Housing data at 1.30pm GMT+1.

Levels to watch/live orders:
- Buys: Flat (stop loss: N/A).
- Sells: Flat (stop loss: N/A).
USD/CAD:
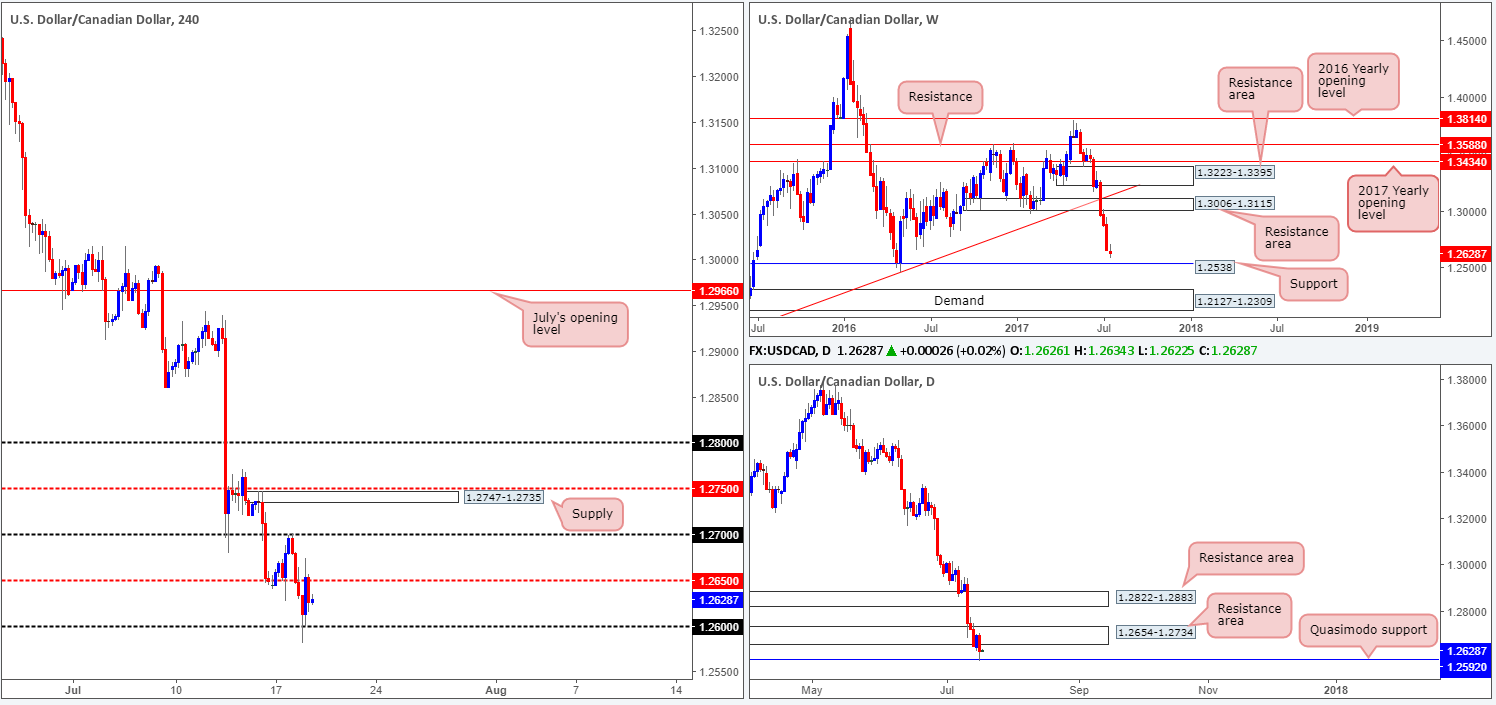
For those who read Tuesday’s report on the USD/CAD pair you may recall that our desk entered into a short position after the close of the near-full-bodied bearish candle from 1.27. The trade worked out exactly as planned, with us taking full profit around the 1.26 neighborhood. Well done to any of our readers who managed to jump aboard this move!
As you can see on the weekly timeframe, we are now coming incredibly close to connecting with the support level pegged at 1.2538. On the daily timeframe, nonetheless, we are seeing price trading from a Quasimodo support at 1.2592, after price ran through demand at 1.2654-1.2734 (now acting resistance area). Should the current support give way, there’s another Quasimodo support seen waiting below at 1.2498.
Our suggestions: As of current price, we do not see much opportunity to trade. Trading long from the current daily Quasimodo support is chancy given the strength of the downtrend and, of course, the nearby daily resistance area lurking just above it. Selling on the other hand would be something we’d be interested in following a decisive H4 close below the 1.26 boundary, as the next target beyond here is the weekly support mentioned above at 1.2538.
Data points to consider: US Housing data and Canadian Manufacturing sales at 1.30pm. Crude oil inventories at 3.30pm GMT+1.
Levels to watch/live orders:
- Buys: Flat (Stop loss: N/A).
- Sells: Watch for H4 price to engulf the 1.26 handle and then look to trade any retest seen thereafter ([waiting for a H4 bear candle – preferably a full, or near full-bodied candle – to form following the retest is advised] stop loss: ideally beyond the candle’s wick).
USD/CHF:
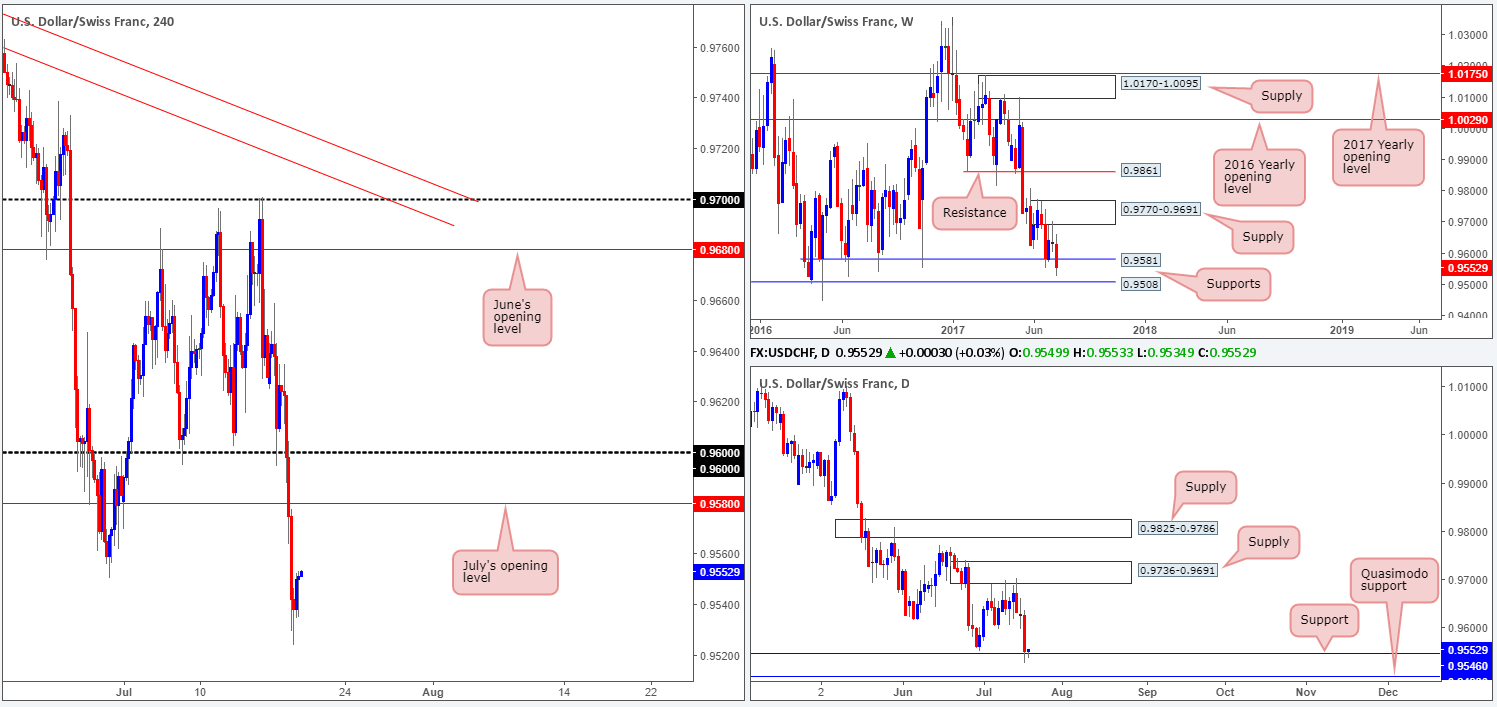
In recent trading the USD/CHF fell sharply, consequently taking out the 0.96 handle and July’s opening level at 0.9580. The unit bottomed after clocking a low of 0.9523 and has since been registering bullish candles. Helping price along its way, nevertheless, is a daily support currently in play coming in at 0.9546. While this is holding the market higher at the moment, our desk is not convinced. The reason? Well, weekly support at 0.9581 was recently consumed and shows space for price to move down to the next weekly support line coming in at 0.9508. Now, 0.9508 converges not only with the 0.95 handle on the H4 chart, but is also seen positioned nearby a daily Quasimodo support level at 0.9498 (the next downside target below the current daily support). For that reason, we are more drawn to the 0.95 handle for longs today.
Our suggestions: Given what we’ve noted above, our team has placed a pending buy order at 0.95, with a stop positioned below the daily Quasimodo apex (0.9443) at 0.9440. Yes, this is a rather large stop, but considering we are dealing with weekly and daily structures here, the risk is acceptable, in our humble opinion.
Data points to consider: US Housing data at 1.30pm GMT+1.
Levels to watch/live orders:
- Buys: 0.95 ([pending order] stop loss: 0.9440).
- Sells: Flat (Stop loss: N/A).
DOW 30:
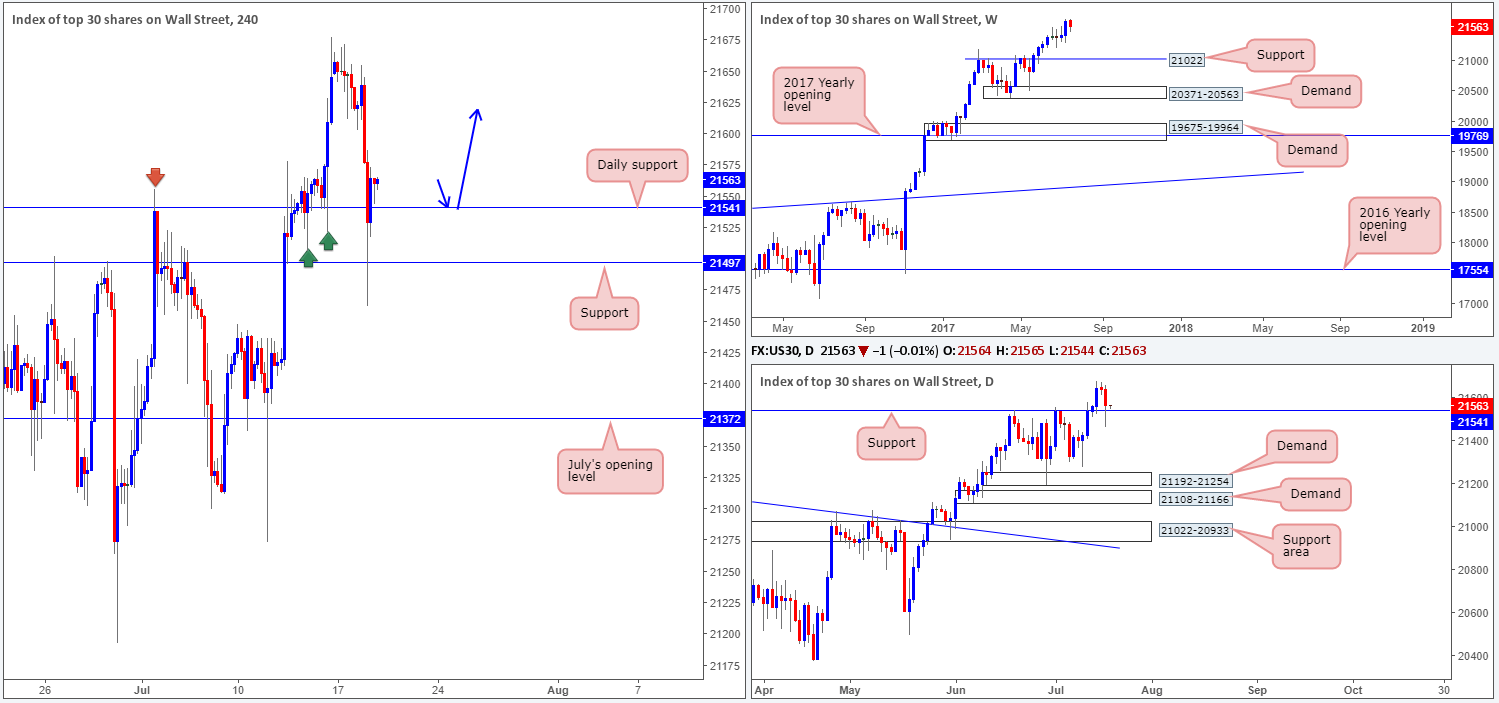
US stocks slipped lower on Tuesday, which saw the H4 candles aggressively surpass daily support at 21541 and test H4 support at 21497. As you can see, the day ended with price closing back above the daily support level, so there’s a good chance that we may see the index rally from this point today.
What would be ideal is for H4 price to retest the daily support and hold firm. This, to us, would add credibility to this level and therefore open up the possibility of buying from here.
Our suggestions: Based on the above findings, a H4 retest of 21541 – coupled with a reasonably sized H4 bull candle, preferably a full, or near-full-bodied candle, would be enough evidence for us to confirm a long position as valid. In regard to take-profit targets, at this point we are quite open as we have yet to see what structure forms on approach to this number. Overall though, we do want to try and trail this market in an attempt to join the current uptrend.
Data points to consider: US Housing data at 1.30pm GMT+1.
Levels to watch/live orders:
- Buys: 21541 ([waiting for a H4 bull candle – preferably a full, or near full-bodied candle – to form is advised] stop loss: ideally beyond the candle’s tail).
- Sells: Flat (stop loss: N/A).
GOLD:
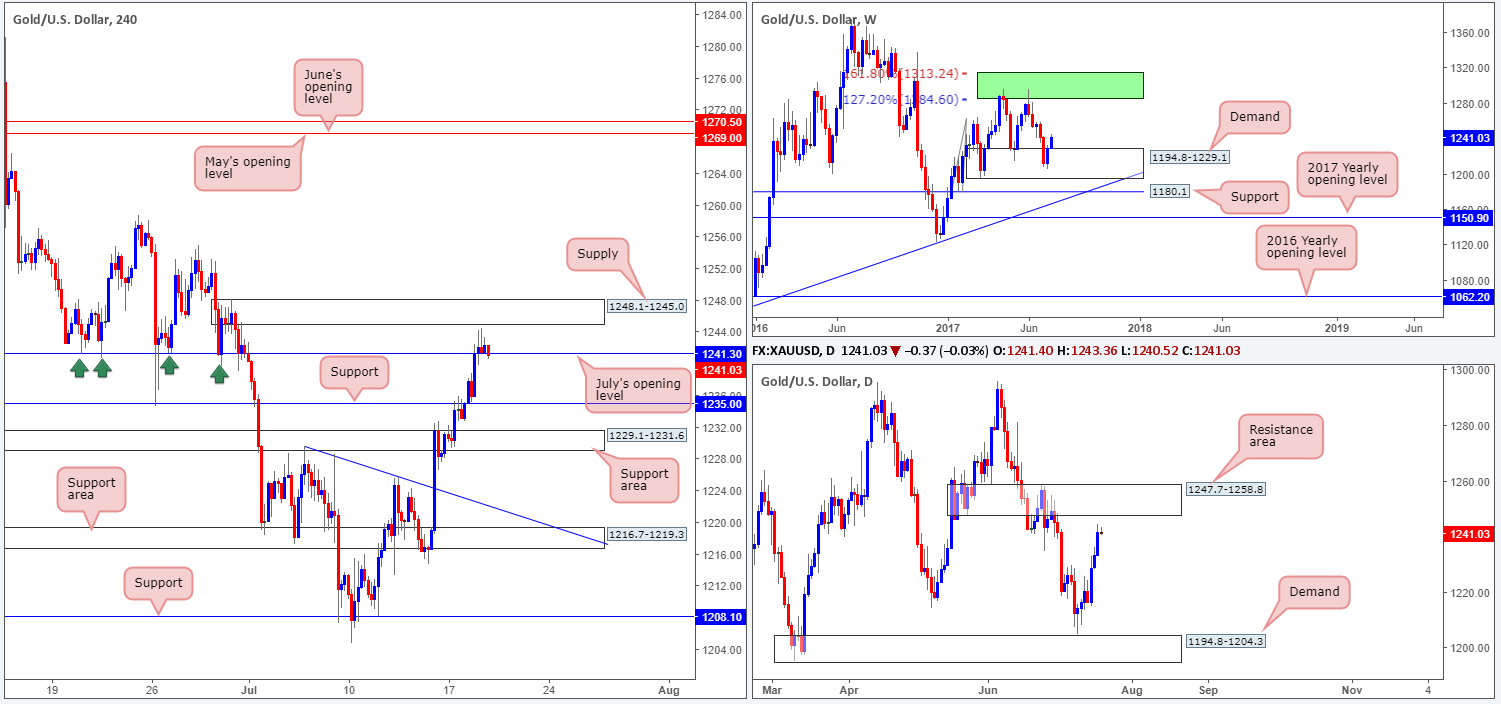
The dollar continued to plunge on Tuesday, consequently adding to gold’s advance. Behind this recent up move is the weekly candles seen trading from weekly demand plotted at 1194.8-1229.1. While this may be encouraging for potential buyers, it might be worth noting that daily price is trading within touching distance of a resistance area coming in at 1247.7-1258.8.
Across on the H4 candles, we can also see that yesterday’s flow managed to remove offers from July’s opening level at 1241.3, and is now seen retesting this level as support. Buying from here, however, is difficult. Just ahead of the monthly level sits a H4 supply registered at 1248.1-1245.0, which happens to be glued to the underside of the aforementioned daily resistance area!
Our suggestions: In spite of weekly price showing promise to the upside, we cannot validate buying this market when so much structure is seen lurking above current price on the H4 and daily timeframes. With that being the case, we so no alternative but to hit the sidelines for now and return tomorrow where hopefully some development has been seen.
Levels to watch/live orders:
- Buys: Flat (stop loss: N/A).
- Sells: Flat (stop loss: N/A).


