
EUR/USD:
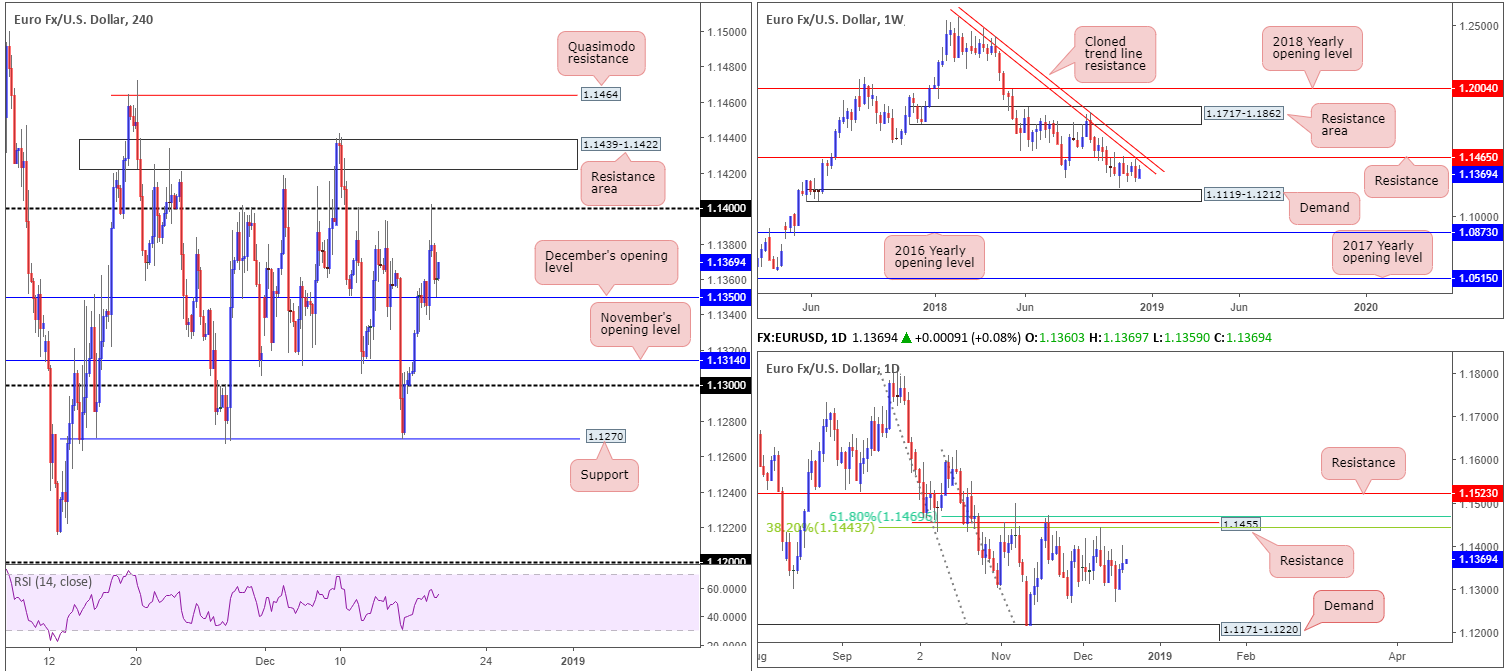
EUR/USD bulls continued to press for higher ground Tuesday, overthrowing December’s opening level at 1.1350 on the H4 timeframe and challenging its 1.14 handle. As is evident from the chart, 1.14 proved a buoyant resistance. Not only does the level communicate strength having seen the number of times it held price action lower in recent months, the German IFO survey showed business confidence worsened in December, with the index down to 101.0, consequently softening demand for the euro. Couple this with the US dollar index (DXY) rebounding from a H4 trend line support (extended from the low 95.68) – helped by better-than-expected US housing data – and USD/CHF H4 candles finding support off 0.99 (an inversely correlated market), the EUR/USD decline from 1.14 should not really be a surprise.
According to H4 structure, the day concluded with the candles retesting December’s opening level at 1.1350 in the shape of an indecision candle. Higher-timeframe structure, on the other hand, remains unchanged: crosshairs continue to hover around weekly resistance priced in at 1.1465 that brings with it a nearby cloned trend line resistance (extended from the high 1.2413). Daily movement also shows resistance circulating around the 1.1455 region, which happens to closely converge with two Fibonacci resistances: a 61.8% and a 38.2% at 1.1469 and 1.1443, respectively.
Areas of consideration:
December’s opening level mentioned above at 1.1350 will likely remain defensive today, owing to room being seen on both weekly and daily timeframes to probe higher and the US dollar index advertising H4 supply around 97.25-97.11. In the event 1.1350 fails to hold, nevertheless, November’s opening level at 1.1314 is likely next in the firing range, shadowed closely by the 1.13 handle.
Should traders be looking for longs off 1.1350 this morning, the research team recommends waiting and seeing how H4 price action behaves before pulling the trigger. Remember, we’ve just had an indecision candle complete which could lead to a move in either direction forming.
Areas of interest to the upside fall in at 1.14, which we already discussed above, followed by a H4 resistance area at 1.1439-1.1422. Although this zone is likely to produce a bounce lower, traders are urged to tread cautiously here given the noted weekly and daily resistances hovering directly above – anyone smell a potential fakeout play through this H4 area?
Traders are also advised to pencil in upcoming Fed action later on today. The Fed is expected to lift rates by 25bps to 2.25-2.50%, with risks the hiking trajectory could be narrowed. The tone of the statement and Chair Powell’s press conference is expected to tilt dovish, reflecting a data-dependent FOMC.
Today’s data points: FOMC Economic Projections; FOMC Statement and Federal Funds Rate; FOMC Press Conference.
GBP/USD:
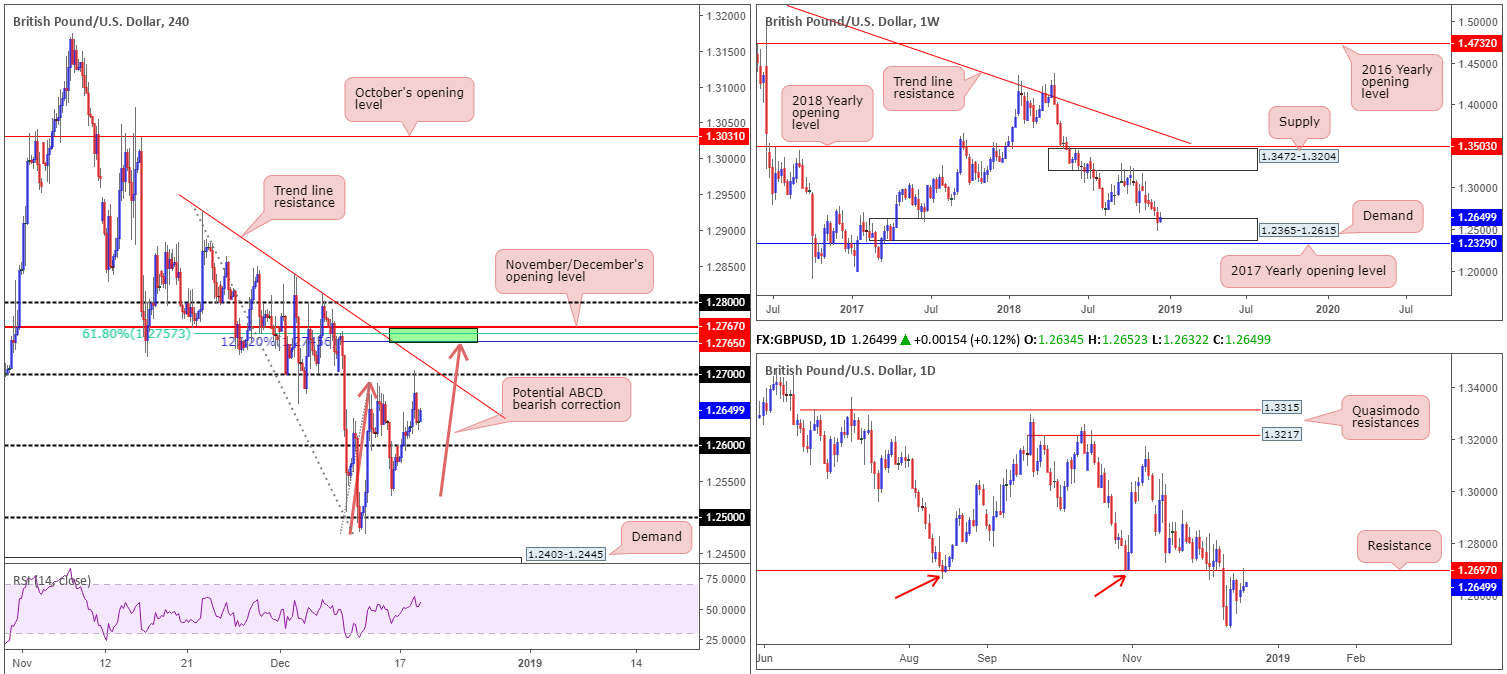
Sterling began Tuesday on a strong footing, extending Monday’s paltry gains. The pair advanced to highs of 1.2705 going into London’s lunchtime, though failed to sustain gains beyond this number and ultimately retreated lower into the close, wrapping up the day +0.12%. In similar fashion to the EUR/USD, price found resistance at 1.27 the same time the US dollar index (DXY) rebounded from its H4 trend line support (extended from the low 95.68) – helped by better-than-expected US housing data. Also weighing on sentiment here was reports the UK government agreed no-deal preparations need to be ramped up.
A move above 1.27 is possible, nonetheless, according to the H4 structure. Note the potential ABCD (orange arrows) 127.2% bearish correction at 1.2745, completing a handful of pips ahead of November/December’s opening levels at 1.2767/65 and a 61.8% Fibonacci resistance value at 1.2757. However, a move in this fashion would imply not only a break of 1.27, but also a breach of nearby trend line resistance (etched from the high 1.2927): a line that has managed to cap upside on two occasions this month.
On a wider perspective, weekly buyers and sellers remain battling for position within the upper limits of demand at 1.2365-1.2615. Daily movement, though, recently retested the underside of a resistance priced in at 1.2697 by way of a bearish pin-bar formation. Not only does this barrier hold significant history, room to possibly push lower from here is seen towards support drawn from 1.2374 (not visible on the screen – located within the lower limits of the current weekly demand).
Areas of consideration:
With respect to higher-timeframe structure, conflicting signals clearly remain: we have weekly price trading from demand, though at the same time we also have daily price languishing just south of resistance signaling further selling could be in the offing.
Should H4 price action press higher and test 1.2767/1.2745 (green) today a bounce lower is likely, though do remain cognizant of the bigger picture. Granted, the trend is facing in a southerly direction on both weekly and daily timeframes, but we’re also coming from weekly demand. For that reason, aggressive trade management is recommended, reducing risk to breakeven once/if price retests the top edge of 1.27 (will be acting support at that point). A H4 close below 1.27 is ideal. That way, lower targets are likely on offer.
Today’s data points: UK Inflation Figures; FOMC Economic Projections; FOMC Statement and Federal Funds Rate; FOMC Press Conference.
AUD/USD:
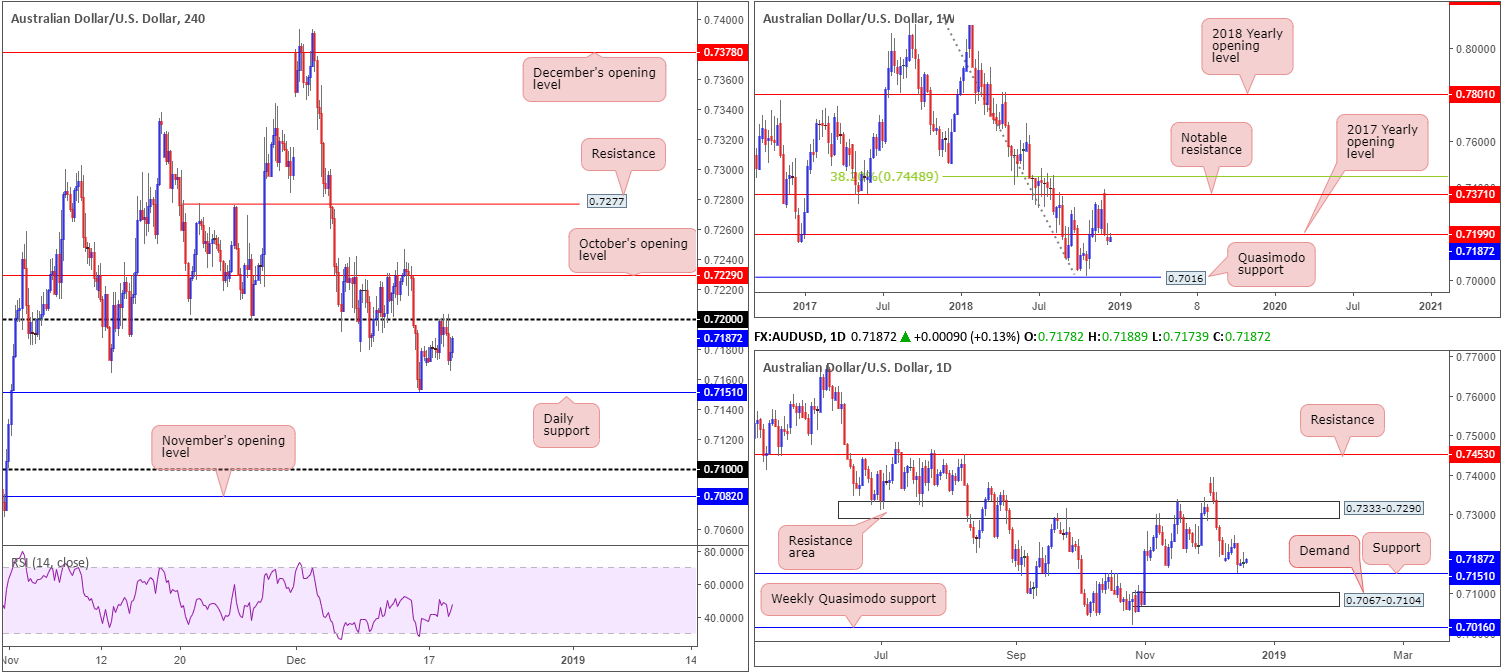
In the early hours of Asia Tuesday, RBA minutes hit the wires with the board reiterating the next move in rates is likely to be a hike, but saw no strong case for a near-term change in policy. This immediately sparked a round of AUD/USD buying (check M30), though the move was relatively short-lived as the H4 candles failed to overcome 0.72.
0.72, as you can see, maintained its defense throughout the day, eventually pressuring the pair to lows of 0.7165 at the closing stages of the session. What’s notable from a technical perspective is 0.72 also represents a possibly strong resistance on the weekly timeframe in the form of the 2017 yearly opening level at 0.7199. Note last week’s action closed beneath this level in the shape of a weekly bearish pin-bar formation.
Looking to daily structure, price is seen meandering just north of support coming in at 0.7151. Boasting reasonably attractive history, traders might also want to consider the possibility of an advance taking shape from here towards a resistance area coming in at 0.7333-0.7290. In the event we do push for lower ground, however, as the weekly timeframe suggests, demand at 0.7067-0.7104 is in view.
Areas of consideration:
The research team will be keeping a close eye on 0.72 today. While we’re not impressed by yesterday’s lackluster performance off of this number, its connection to weekly structure may eventually override daily support highlighted above at 0.7151, and is, therefore, a barrier worth watching.
Should H4 price chalk up a notable bearish candlestick configuration off 0.72 today (entry/stop parameters can be defined according to this pattern), this would potentially be sufficient enough to draw in sellers and overthrow daily support.
In the matter of take-profit targets from 0.72, aside from the current daily support at 0.7151, the top edge of daily demand at 0.7104 would be first in line, followed by the 0.71 handle on the H4 timeframe and then November’s opening level drawn from 0.7082. Traders are urged to consider reducing risk to breakeven once/if H4 price closes under the current daily support.
Today’s data points: FOMC Economic Projections; FOMC Statement and Federal Funds Rate; FOMC Press Conference.
USD/JPY:
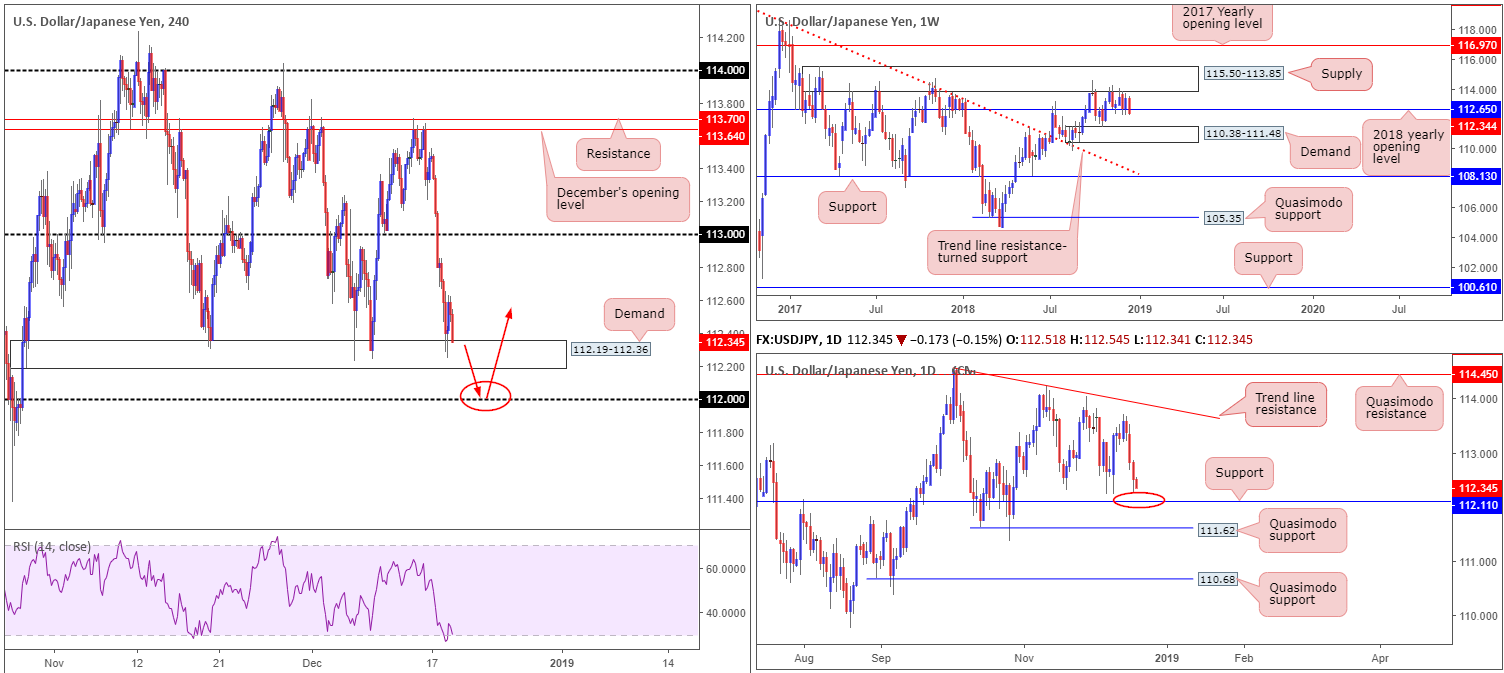
The USD/JPY concluded Tuesday’s segment in the red, down 0.27% on the day. This, as you can see from the daily timeframe, is the market’s third consecutive losing session, down an overall 0.72% so far this week.
Broad-based USD selling pulled the H4 candles towards demand printed at 112.19-112.36 yesterday, which is so far holding ground. Note this area has held price higher on three occasions in recent trade and currently converges nicely with the US dollar index (DXY) rebounding from a H4 trend line support (extended from the low 95.68) – helped by better-than-expected US housing data. A break of this demand would likely call for 112 to be brought into the mix. Traders may also want to note the RSI indicator is currently displaying an oversold reading.
Higher-timeframe structure reveals weekly price knocking on the 2018 yearly opening level’s door at 112.65. A move under this barrier would likely lead to a test of nearby demand coming in at 110.38-111.48. The story on the daily timeframe, on the other hand, shows the candles hovering just north of a support level drawn from 112.11, shadowed closely by a Quasimodo support priced in at 111.62.
Areas of consideration:
Seeing weekly price inching below its 2018 yearly opening level at 112.65, and daily action portending a move towards support at 112.11, H4 buyers may struggle to hold the current demand area today. Instead, a fakeout through the zone to 112 could be on the cards before active buyers find reason to join this market.
A fakeout through the current H4 demand would also likely trip a truckload of stop loss orders beneath it. This liquidity (remember a stop-loss order from a buyer becomes a sell order once filled) will help bigger players enter the market from either the daily support at 112.11 or the 112 handle on the H4.
A long from 112ish on the back of a H4 bullish candlestick formation, therefore, could be a consideration going into today’s session (entry/stop parameters can be defined according to this pattern), targeting 112.60ish as an initial port of call: essentially the underside of the 2018 yearly opening level on the weekly timeframe.
Today’s data points: FOMC Economic Projections; FOMC Statement and Federal Funds Rate; FOMC Press Conference.
USD/CAD:
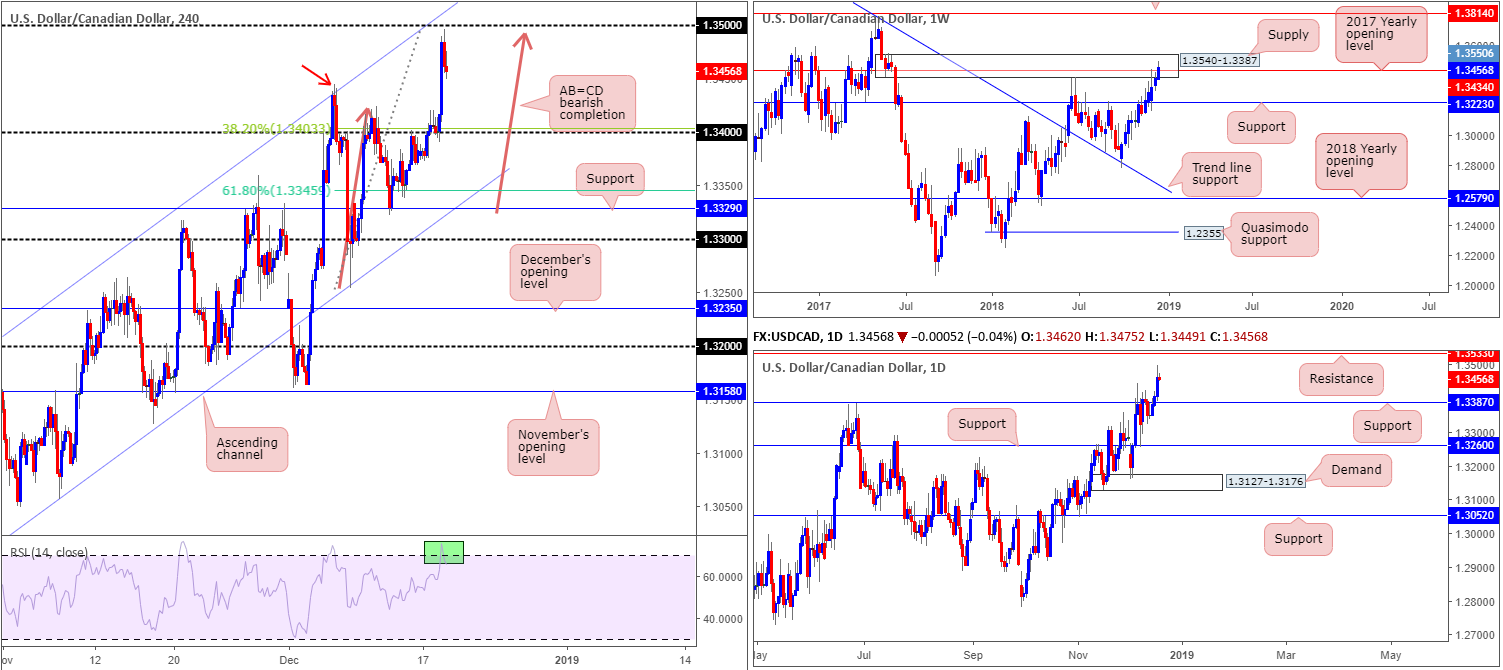
Although the US dollar index continued to explore lower ground Tuesday, the USD/CAD enjoyed another day in the sun. Crude oil ended the session down a whopping 6.50%+, therefore weighing on the Canadian dollar while simultaneously bolstering the US dollar.
As is evident from the H4 timeframe this morning, the candles established support on a retest of 1.34 before launching northbound to highs of 1.3496 yesterday. One reason for the pair halting just south of its 1.35 handle and mildly paring gains is the AB=CD bearish completion pattern (orange arrows). This could, according to the harmonic pattern’s take-profit rules, see the unit retreat towards the 38.2% Fibonacci support at 1.3403 today, followed closely by the 1.34 handle and then possibly the 61.8% Fibonacci support at 1.3345. Though before reaching this far south, traders may witness a rebound off 1.3444: the Dec 6 high (red arrow). It might also interest some traders to note the RSI indicator is seen displaying an overbought reading (green).
A look at this market from the higher timeframes, nevertheless, brings in weekly supply at 1.3540-1.3387, which houses the 2017 yearly opening level within at 1.3434. Note this level is struggling to hold firm. On the other side of the spectrum, daily flow recently crossed above resistance coming in at 1.3387 (essentially represents the underside of weekly supply) and made considerable headway during yesterday’s advance. This, by and of itself, possibly unlocks the door towards resistance priced in at 1.3533 (located within the upper limit of the current weekly supply).
Areas of consideration:
Further selling on the H4 timeframe is a strong possibility today. Not only do we have a clear-cut AB=CD bearish pattern in play, we also have weekly price engaging with supply at 1.3540-1.3387, despite recently overthrowing the 2017 yearly opening level at 1.3434. Entering at current price is still a possibility, with stop-loss orders positioned above 1.35. This offers more than a 1:1 risk/reward to 1.34, with the possibility of additional profits should the pattern complete at its 61.8% Fibonacci support mentioned above at 1.3345.
Today’s data points: FOMC Economic Projections; FOMC Statement and Federal Funds Rate; FOMC Press Conference; Canadian Inflation Figures.
USD/CHF:
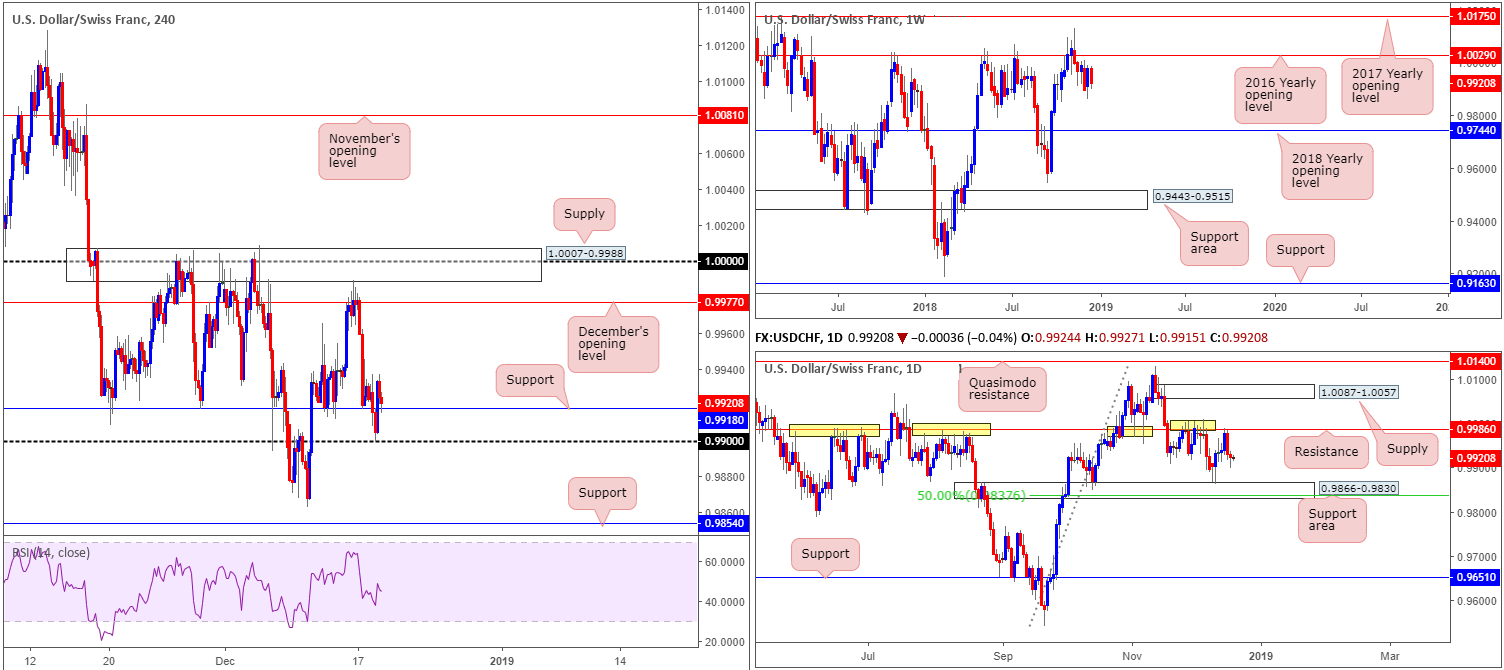
Reinforced by the EUR/USD bouncing from its 1.14 handle as resistance, and the US dollar index (DXY) rebounding from a H4 trend line support (extended from the low 95.68) – helped by better-than-expected US housing data – the USD/CHF witnessed active buyers defend 0.99 Tuesday. As you can see, the H4 candles reclaimed 0.9918 to the upside off 0.99 and is, at the time of writing, being retested as support. While a large portion of the market will likely be looking for this level to hold firm and lift the pair to higher ground, higher-timeframe structure is displaying a red flag.
Weekly price remains languishing under the 2016 yearly opening level at 1.0029. Support, according to this timeframe, does not enter the fold until we reach the 2018 yearly opening level coming in at 0.9744. A similar story is visible on the daily timeframe, only price recently rejected notable resistance at 0.9986 and shows the next support target falls in around 0.9866-0.9830.
Areas of consideration:
In the event our higher-timeframe reading is accurate, a move beneath 0.99 could be in store today. A H4 close underneath 0.99 opens up the path to possible intraday shorts, targeting 0.9866 (the top edge of the current daily support area), followed by H4 support at 0.9854. It is recommended, however, only to consider positions sub 0.99 that offer at least 1:1 risk/reward ratio to 0.9866, whether that be on a breakout play or on a retest to the underside of 0.99.
Should buyers defend H4 support at 0.9918, despite trading against higher-timeframe flow, a move north towards December’s opening level at 0.9977 could also be realized. To prove buyer intent before pulling the trigger, traders are urged to consider waiting for additional candlestick confirmation to form (entry/stop parameters can be defined according to this pattern).
Today’s data points: FOMC Economic Projections; FOMC Statement and Federal Funds Rate; FOMC Press Conference.
Dow Jones Industrial Average:
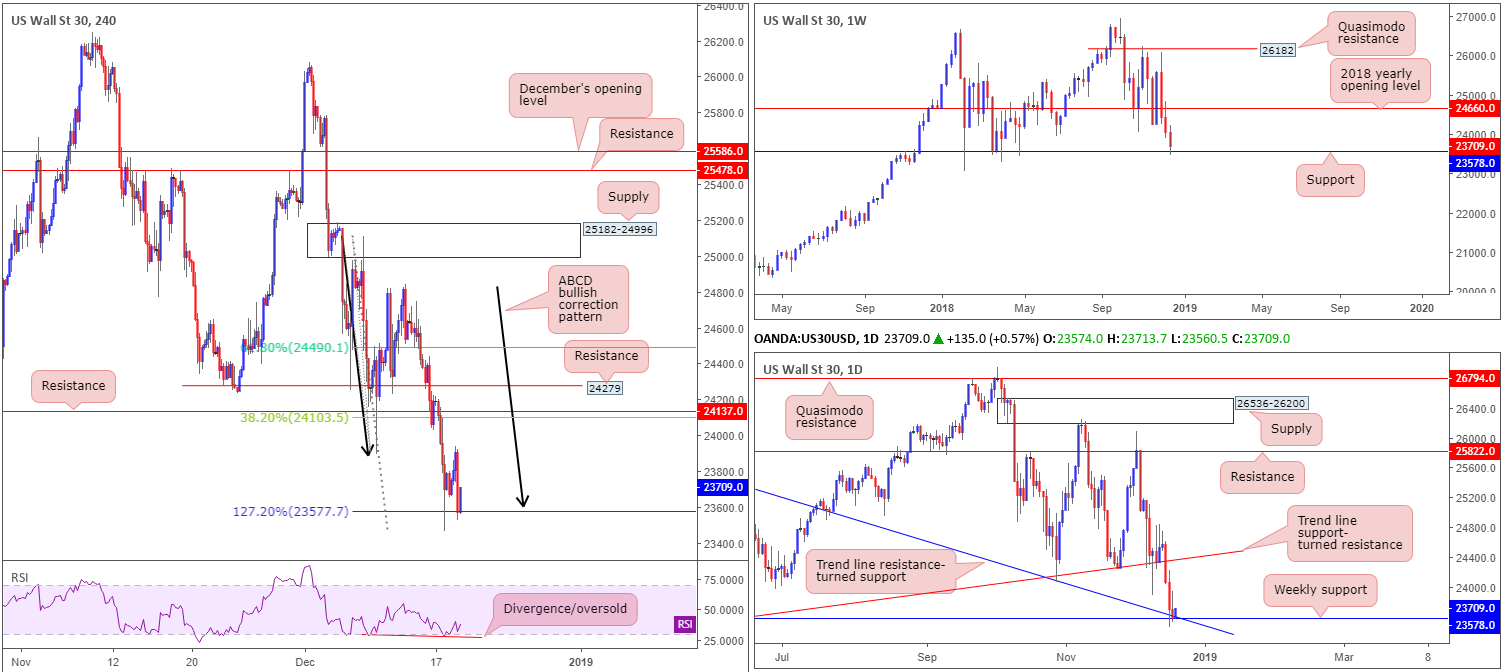
Further selling transpired on Tuesday, pulling the market to losses of 0.55% on the day. Crude oil’s selloff was a major catalyst for the stock market’s performance, overriding upbeat macroeconomic data out of the US revealing both housing starts and building permits rebounded in November following October’s decline.
Although the Dow Jones Industrial Average is trading over 1.50% in the red this week, there may be a light at the end of the tunnel, according to our technical studies. Weekly price recently crossed swords with support carved from 23578. Boasting reasonably sound historical significance, there’s a chance equities may stage a recovery from this point, targeting a possible retest of the 2018 yearly opening level at 24660. In addition to this, the research team also notes a merging daily trend line resistance-turned support (extended from the high 26670).
Couple the above with H4 candles seen defending a nice-looking ABCD (black arrows) 127.2% bullish pattern at 23577 (reinforced by a divergence/oversold reading out of the RSI indicator), a recovery could take shape today/this week.
Areas of consideration:
According to our technical readings, all three timeframes still suggest an advance may be in the offing, with an initial upside target positioned around H4 resistance at 24137/38.2% H4 Fibonacci resistance at 24103.
For those who entered long based on Tuesday’s briefing, hang in there! The unit is still primed to attack higher levels despite yesterday’s pullback.
For those who missed yesterday’s call, you’ll receive better pricing today. Entering long at current price is on the table, with stop-loss orders positioned beneath Monday’s low (23465). This offers in excess of 1:2 risk/reward to the first upside target highlighted above: 24103.
Today’s data points: FOMC Economic Projections; FOMC Statement and Federal Funds Rate; FOMC Press Conference.
XAU/USD (Gold):
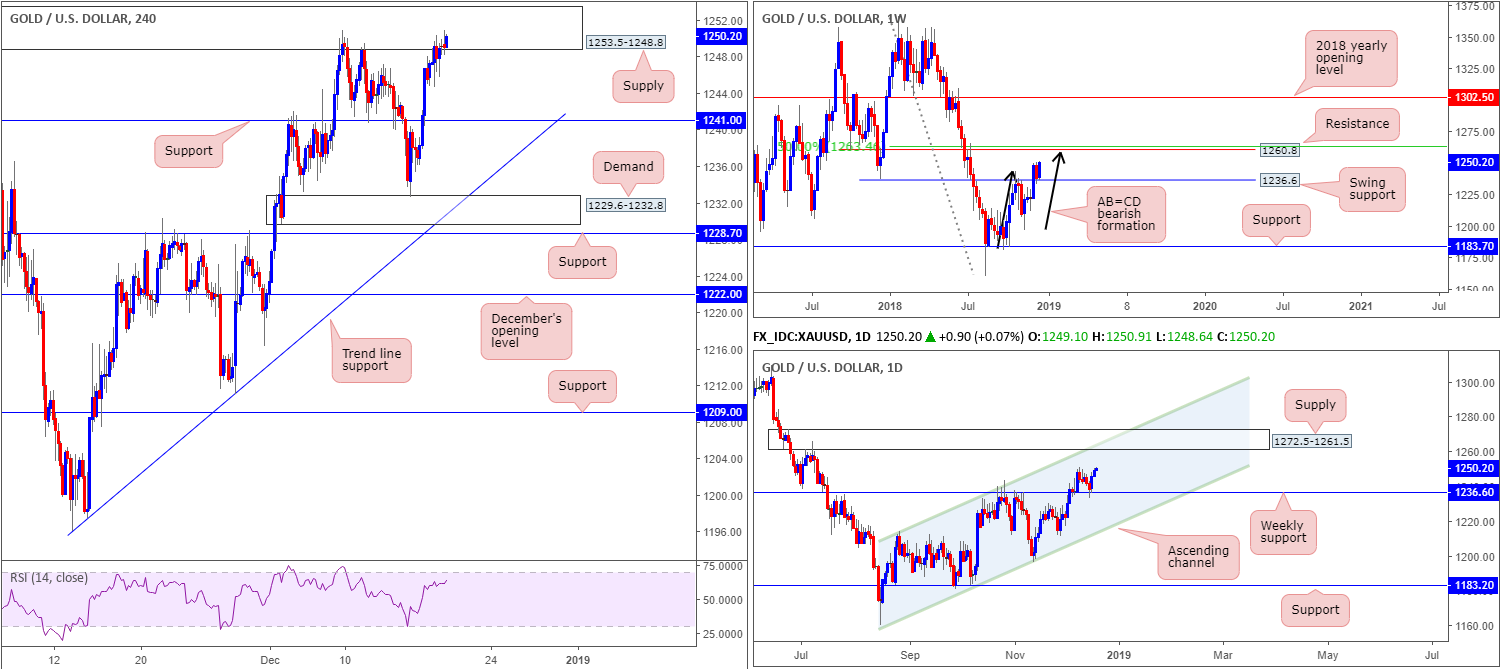
Although the price of gold advanced 0.30% Tuesday, much of the technical landscape remains unaffected.
Kicking things off from the weekly timeframe this morning, buyers appear in good health off swing resistance-turned support at 1236.6. Further buying from current price draws in resistance at 1260.8. What’s also interesting about 1260.8 from a technical perspective is it converges closely with an AB=CD bearish completion point (black arrows) and a 50.0% resistance value at 1263.4 (green).
Daily movement reveals similar structure to the weekly timeframe. The only real difference between the two falls between the next upside target. While weekly price shows we’re likely heading for resistance at 1260.8, daily flow could possibly surpass this area to shake hands with channel resistance (etched from the high 1214.3). It might also be worth noting on the daily timeframe we have a nice-looking supply zone at 1272.5-1261.5 converging with the noted channel resistance.
A closer reading brings in the H4 candles which are seen engaging with supply priced in at 1253.5-1248.8. Note this area held price action lower last week. Should we manage to overthrow this zone this week, the next port of call in terms of upside targets likely falls in around weekly resistance at 1260.8.
Areas of consideration:
There appear to be two options going forward:
- H4 price retreats from the current H4 supply area and retests H4 support at 1241.0. Should H4 price retest the level in the shape of a bullish candlestick pattern (entry/stop parameters can be defined according to this pattern), this, along with both weekly and daily charts exhibiting room to press higher, is likely enough to draw in buyers with an ultimate target placed at the weekly resistance level highlighted above at 1260.8.
- An alternative to (1), and likely the more conservative approach, is to wait and see if H4 price engulfs the current supply zone BEFORE looking to tackle this market long. An ideal scenario would be for the unit to engulf the supply and pullback to the aforementioned H4 support level for a long. That way, traders can be relatively confident the majority of sellers from supply are consumed.
The use of the site is agreement that the site is for informational and educational purposes only and does not constitute advice in any form in the furtherance of any trade or trading decisions.
The accuracy, completeness and timeliness of the information contained on this site cannot be guaranteed. IC Markets does not warranty, guarantee or make any representations, or assume any liability with regard to financial results based on the use of the information in the site.
News, views, opinions, recommendations and other information obtained from sources outside of www.icmarkets.com.au, used in this site are believed to be reliable, but we cannot guarantee their accuracy or completeness. All such information is subject to change at any time without notice. IC Markets assumes no responsibility for the content of any linked site. The fact that such links may exist does not indicate approval or endorsement of any material contained on any linked site.
IC Markets is not liable for any harm caused by the transmission, through accessing the services or information on this site, of a computer virus, or other computer code or programming device that might be used to access, delete, damage, disable, disrupt or otherwise impede in any manner, the operation of the site or of any user’s software, hardware, data or property.


