
Waiting for lower timeframe confirmation is our main tool to confirm strength within higher timeframe zones, and has really been the key to our trading success. It takes a little time to understand the subtle nuances, however, as each trade is never the same, but once you master the rhythm so to speak, you will be saved from countless unnecessary losing trades. The following is a list of what we look for:
- A break/retest of supply or demand dependent on which way you’re trading.
- A trendline break/retest.
- Buying/selling tails/wicks – essentially we look for a cluster of very obvious spikes off of lower timeframe support and resistance levels within the higher timeframe zone.
- Candlestick patterns. We tend to stick with pin bars and engulfing bars as these have proven to be the most effective.
We typically search for lower-timeframe confirmation between the M15 and H1 timeframes, since most of our higher-timeframe areas begin with the H4. Stops are usually placed 3-5 pips beyond confirming structures.
EUR/USD:
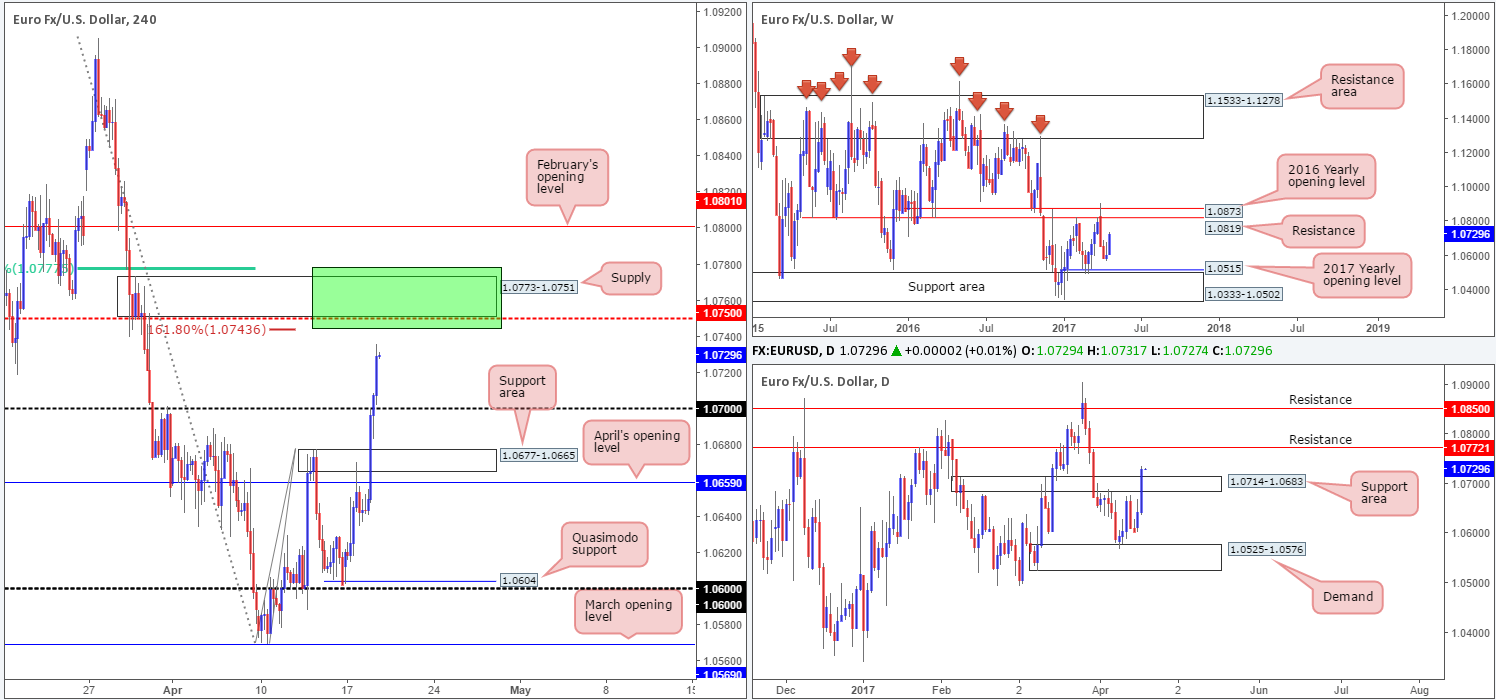
The EUR/USD, as you can see, recently ran through multiple H4 tech resistances amid a generally well-bid EUR and a beaten US dollar. With 1.07 now out of the picture, the next area of interest falls in around 1.0773-1.0751: a supply zone that sits in between a mid-level resistance at 1.0750/161.8% Fib extension at 1.0743 (drawn from the low 1.0569) and a 61.8% Fib resistance at 1.0777 (taken from the high 1.0905).
Yesterday’s advance also managed to brush through the resistance area seen over on the daily chart at 1.0714-1.0683. This move, according to our technicals, has potentially opened the path north up to resistance at 1.0772, which happens to sit within the upper limits of the said H4 supply.
Our suggestions: The above points all suggest that the single currency may find resistance within our green area drawn on the H4 chart fixed at 1.0777/1.0743. Seeing as how the area is rather large and the weekly chart shows room to appreciate beyond the H4 sell zone, however, we will wait for a reasonably sized H4 bearish candle to print within before looking to sell.
Data points to consider: No high-impacting events.
Levels to watch/live orders:
- Buys: Flat (stop loss: N/A).
- Sells: 1.0777/1.0743 ([waiting for a reasonably sized H4 bear candle to form before pulling the trigger is advised] stop loss: ideally beyond the candle’s wick).
GBP/USD:
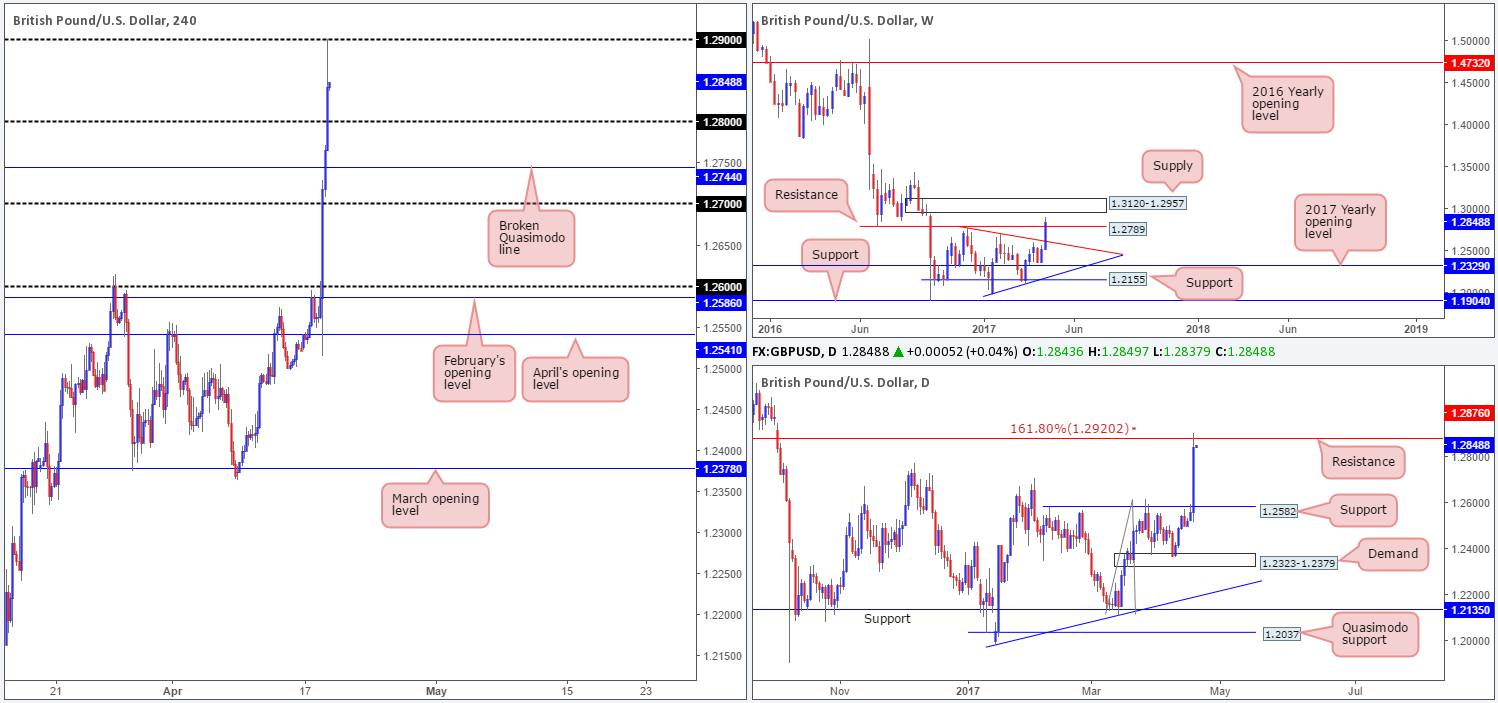
UK Prime Minister Theresa May surprised the markets yesterday by announcing plans to call a snap general election on June 8th. As can be seen from the charts, this received early backing from investors as the pair rallied over 300 pips!
In recent hours, however, H4 price managed to catch a relatively strong offer from the 1.29 handle, giving back over 50 pips into the closing bell. Also noteworthy is daily price recently connected with resistance coming in at 1.2876, which is shadowed closely by a 161.8% Fib extension taken from the low 1.2108. Up on the weekly timeframe, price also breached a resistance level seen at 1.2789, and may have set the stage for a continuation move up to supply drawn in at 1.3120-1.2957.
Our suggestions: It’ll be interesting to see how the markets respond to recent events today. Technically, the pair does appear to be oversold, but it’s very difficult to judge given the recent advance, which could very well continue. Therefore, opting to stand on the sidelines today may be the better path to take.
Data points to consider: No high-impacting events.
Levels to watch/live orders:
- Buys: Flat (stop loss: N/A).
- Sells: Flat (stop loss: N/A).
AUD/USD:
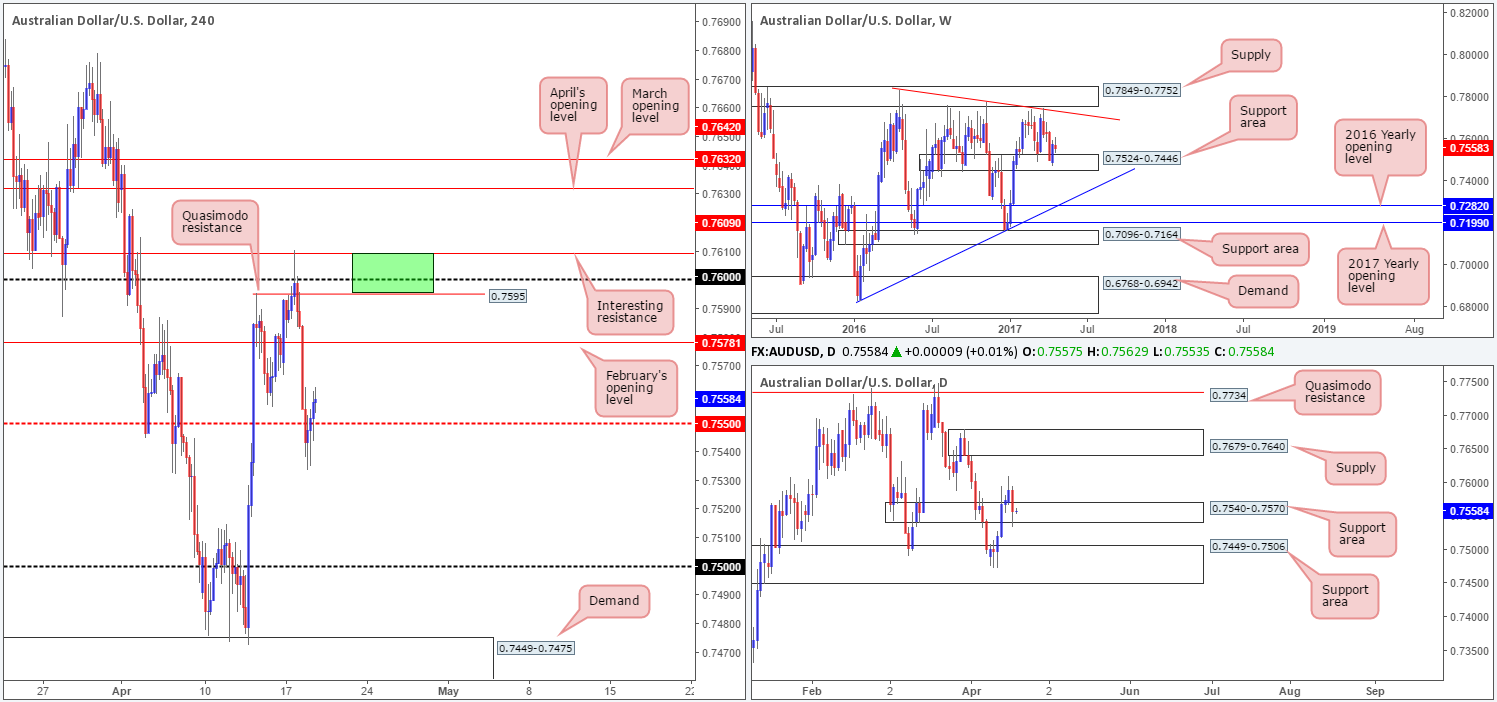
Using a top/down approach, we can see that weekly price remains above the support area at 0.7524-0.7446. This zone can be seen offering support and resistance as far back as mid-2016. Down on the daily chart, price can be seen aggressively retesting the support area coming in at 0.7540-0.7570. Providing that this base holds ground, the next upside target is seen around supply penciled in at 0.7679-0.7640.
With H4 price now seen trading back above the mid-level number 0.7550, the candles may look to go about challenging February’s opening level today at 0.7578. Personally, we feel this resistance is rather soft, since, in our opinion, the stronger area for shorts is seen above (green zone) between 0.7609/0.7595 (Resistance/psychological handle/ Quasimodo resistance/).
Our suggestions: Although the noted green zone boasts attractive H4 confluence, it lacks higher-timeframe structure. Therefore, should you consider a short from here we’d still recommend waiting for additional confirmation in the form of a lower-timeframe sell signal (see the top of this report).
Data points to consider: No high-impacting events.
Levels to watch/live orders:
- Buys: Flat (stop loss: N/A).
- Sells: Flat (stop loss: N/A).
USD/JPY:
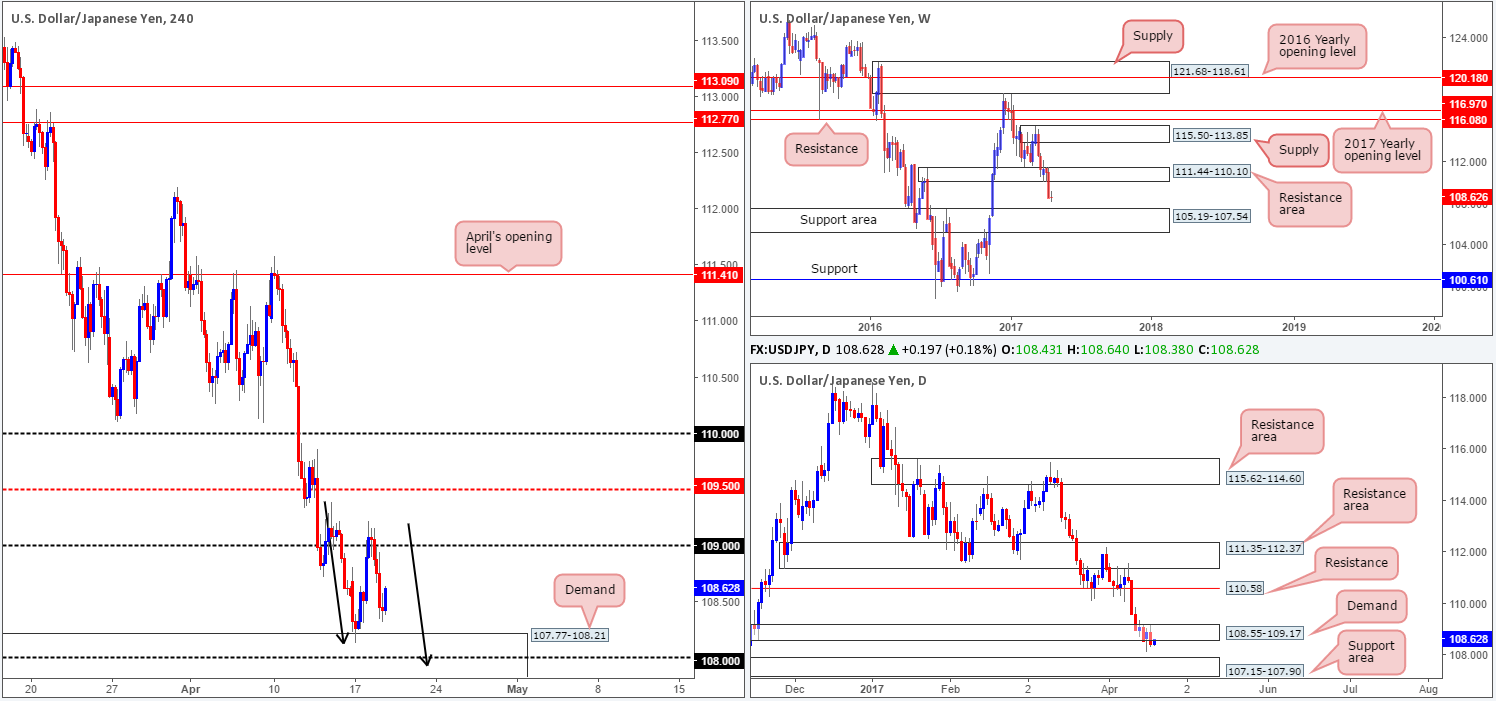
As can be seen from the H4 chart, the buyers failed to sustain gains beyond the 109 handle and dropped to a low of 108.32 into the close. Just ahead of current price sits a demand base coming in at 107.77-108.21, which holds the 108 handle within. Also of interest here is the approach: an AB=CD formation that completes just below the 108 number (see black arrows). Bolstering the noted H4 demand is a daily support area seen at 107.15-107.90, which itself is supported by a weekly support area at 105.19-107.54.
Our suggestions: Given the H4 demand is reinforced by a weekly and daily support area, and the additional H4 confluence, we feel a second try at longs from here is certainly worth the risk. Only this time, however, we will want to see a reasonably sized bull candle form out of the area before committing.
Data points to consider: No high-impacting events.
Levels to watch/live orders:
- Buys: 107.77-108.21 ([waiting for a reasonably sized H4 bull candle to form before pulling the trigger is advised] stop loss: ideally beyond the candle’s tail).
- Sells: Flat (stop loss: N/A).
USD/CAD:
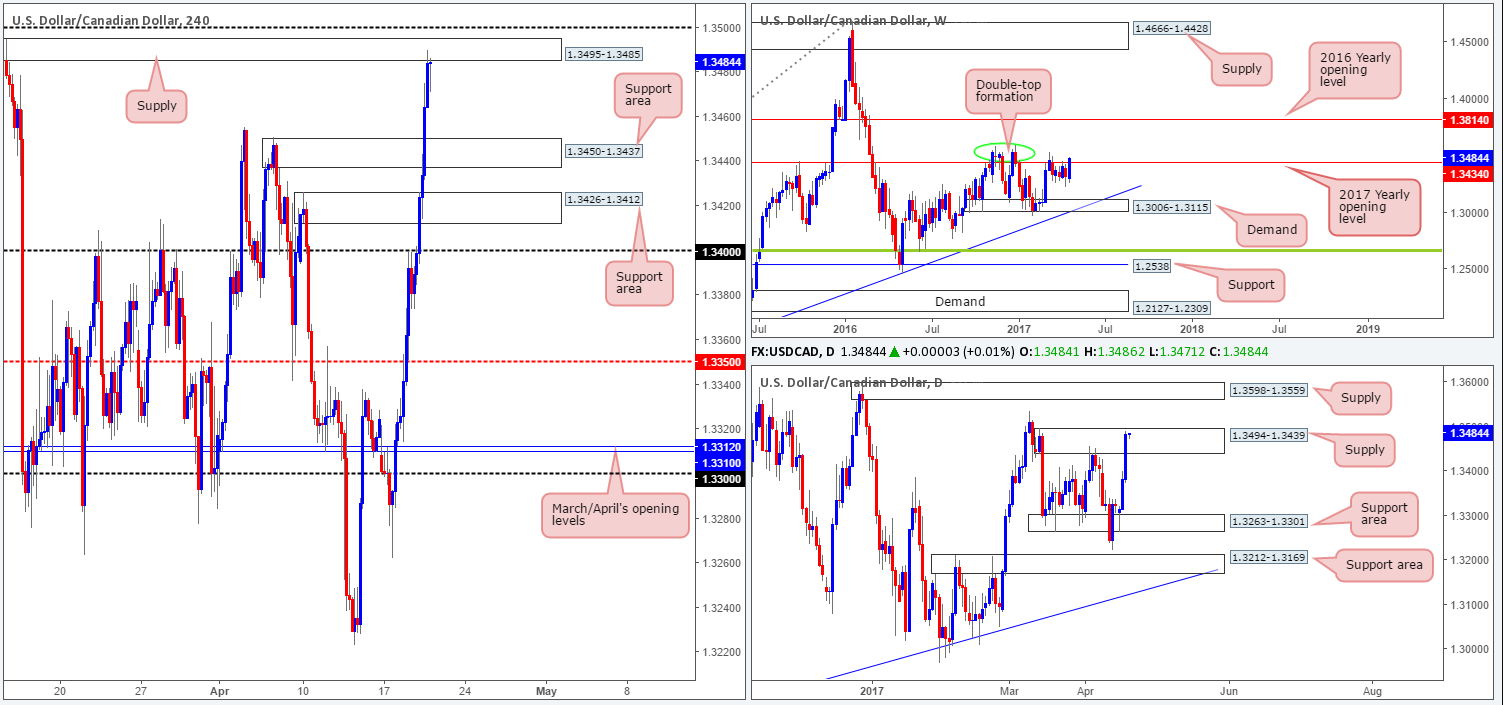
The US dollar made considerable ground against the Canadian dollar during yesterday’s segment. It was only once price shook hands with the 1.34 handle did we see price stabilize.
Technically speaking, 1.34 looks vulnerable to the upside at the moment. It has absolutely no connection to the higher timeframes, and seen sitting just above this number is a H4 supply zone at 1.3426-1.3412 that boasts a 161.8% Fib extension at 1.3408 taken from the low 1.3223.
While the said H4 supply has a good chance of bouncing price, we’re a little concerned with the daily supply at 1.3494-1.3439 positioned above, and also the 2017 yearly opening level at 1.3434.
Our suggestions: To protect oneself from a possible fakeout above the H4 supply zone, we would highly recommend waiting for a lower-timeframe confirming signal to form before executing a trade (see the top of this report). Failing that, you could always wait and see if price tests the H4 supply above at 1.3450-1.3437, as this zone actually sits within the boundaries of the aforementioned daily supply.
Data points to consider: No high-impacting events.
Levels to watch/live orders:
- Buys: Flat (stop loss: N/A).
- Sells: 1.3426-1.3412 ([waiting for additional lower-timeframe confirming price action is advised] stop loss: dependent on where one confirms this area). 1.3450-1.3437 ([waiting for additional lower-timeframe confirming price action is advised] stop loss: dependent on where one confirms this area).
USD/CHF:
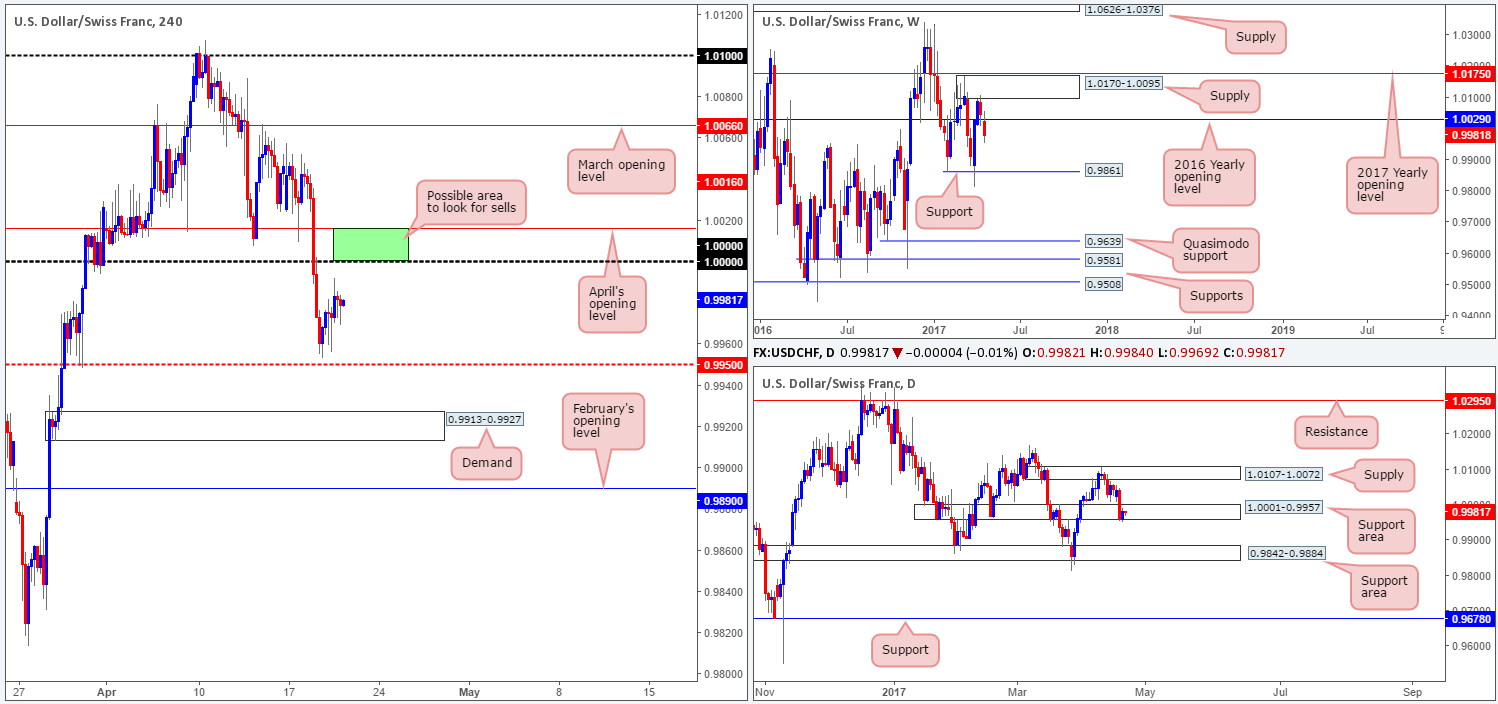
The USD/CHF broke below and retested the underside of parity (1.0000) going into the early hours of yesterday’s US segment. From there, the US dollar continued to sag and ended the day closing just ahead of the H4 mid-level support at 0.9950.
With daily flow now seen teasing the lower edge of a support area at 1.0001-0.9957, there a possibility that we may see the pair reverse some of yesterday’s losses today and maybe revisit parity. The only grumble here is that the weekly candles indicate that further selling could be on the cards down to support seen at 0.9861.
Our suggestions: In an ideal world, we would really like to see price interact with the H4 mid-level number 0.9950, before we think about taking a long position. A solid rejection off this number, coupled with the current daily support area already in play, would, in our opinion, be enough evidence to warrant a buy, targeting parity as an initial take-profit target.
Data points to consider: No high-impacting events.
Levels to watch/live orders:
- Buys: 0.9950 region ([waiting for a reasonably sized H4 bull candle to form before pulling the trigger is advised] stop loss: ideally beyond the candle’s tail).
- Sells: Flat (stop loss: N/A).
DOW 30:
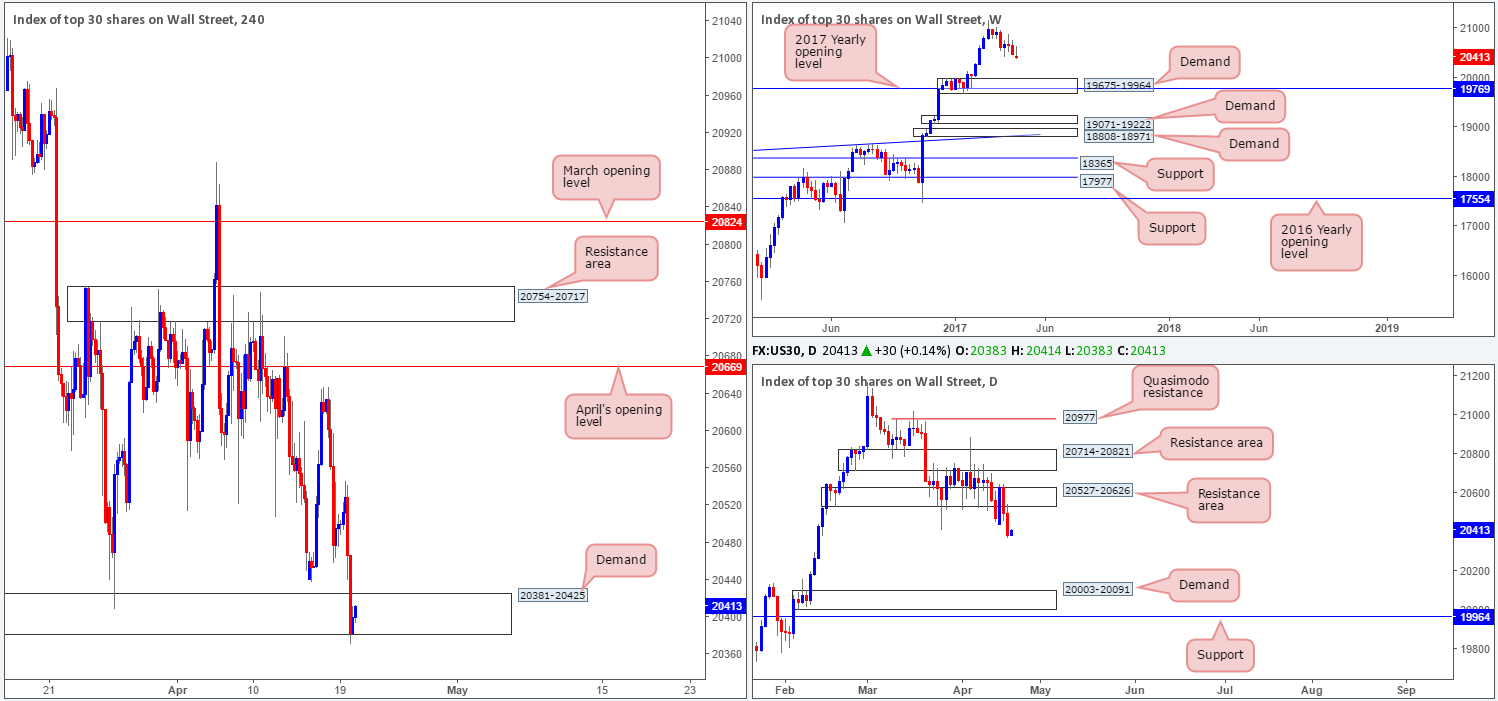
Looking at this index from the weekly timeframe, we can see that price looks poised to extend the pullback seen from record highs of 21170. The next base of support on this scale falls in at 19675-19964: a demand area that’s bolstered by the 2017 yearly opening level at 19769.
In conjunction with weekly flow, the daily support area at 20527-20626 appears to be extremely fragile. So much so, that we’ve now labeled this zone as a resistance area. Assuming that the bears remain in the driving seat here, the next downside target can be seen around demand at 20003-20091, which happens to sit directly above the said weekly demand.
Before one looks to go about shorting this market though, it might be worth noting that there’s a H4 demand area at 20381-20425 to contend with first. Once this area is cleared, the daily demand will likely be brought into the picture.
Our suggestions: Sit on your hands and wait for the H4 demand to be taken out. Once/if this comes to fruition, one can then look at shorting any retest seen to the underside of this zone, targeting the daily demand mentioned above.
Data points to consider: No high-impacting events.
Levels to watch/live orders:
- Buys: Flat (stop loss: N/A).
- Sells: Waiting for the H4 demand at 20381-20425 to be engulfed before considering shorts.
GOLD:
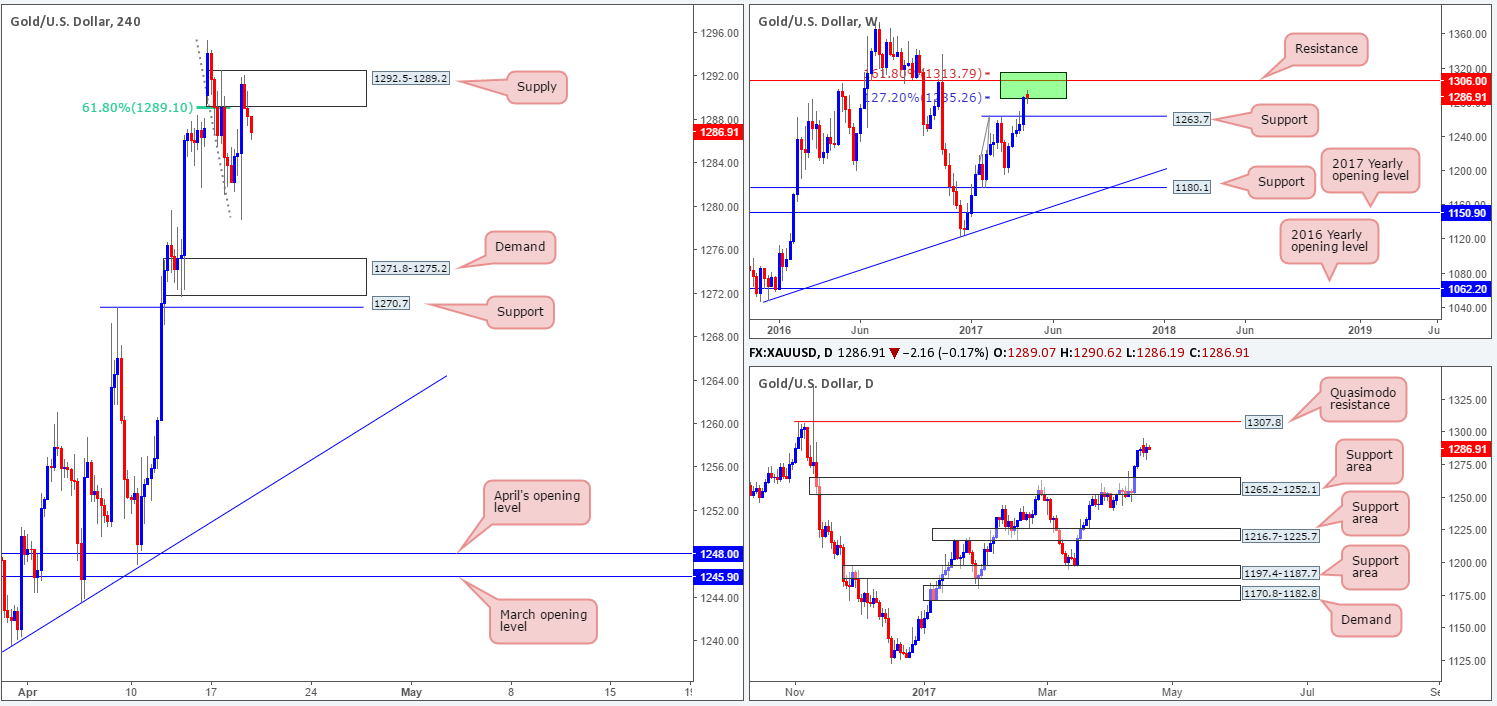
As highlighted in yesterday’s report, the H4 supply at 1292.5-1289.2 (bolstered by a 61.8% Fib retracement at 1289.1) was a possible area for the bears to make an appearance. Well done to any of our readers who managed to jump aboard here!
In view of the weekly chart showing price trading within two Fibonacci extensions 161.8/127.2% at 1313.7/1285.2 taken from the low 1188.1 (green zone) at the moment, we feel further selling could be on the cards. In the event that the bears remain energetic, the support at 1263.7 could see a retest soon. Of particular interest on the daily timeframe is that the said weekly support is seen lodged within a daily support area marked at 1265.2-1252.1.
Our suggestions: It seems we might have missed the boat from the H4 supply, so the best we can do right now is wait and see if price retests the zone for a second time today, and enter on any reasonable H4 bearish rotation candle.
Levels to watch/live orders:
- Buys: Flat (stop loss: N/A).
- Sells: 1292.5-1289.2 ([waiting for a reasonably sized H4 bear candle to form before pulling the trigger is advised] stop loss: ideally beyond the candle’s wick).


