
DXY:
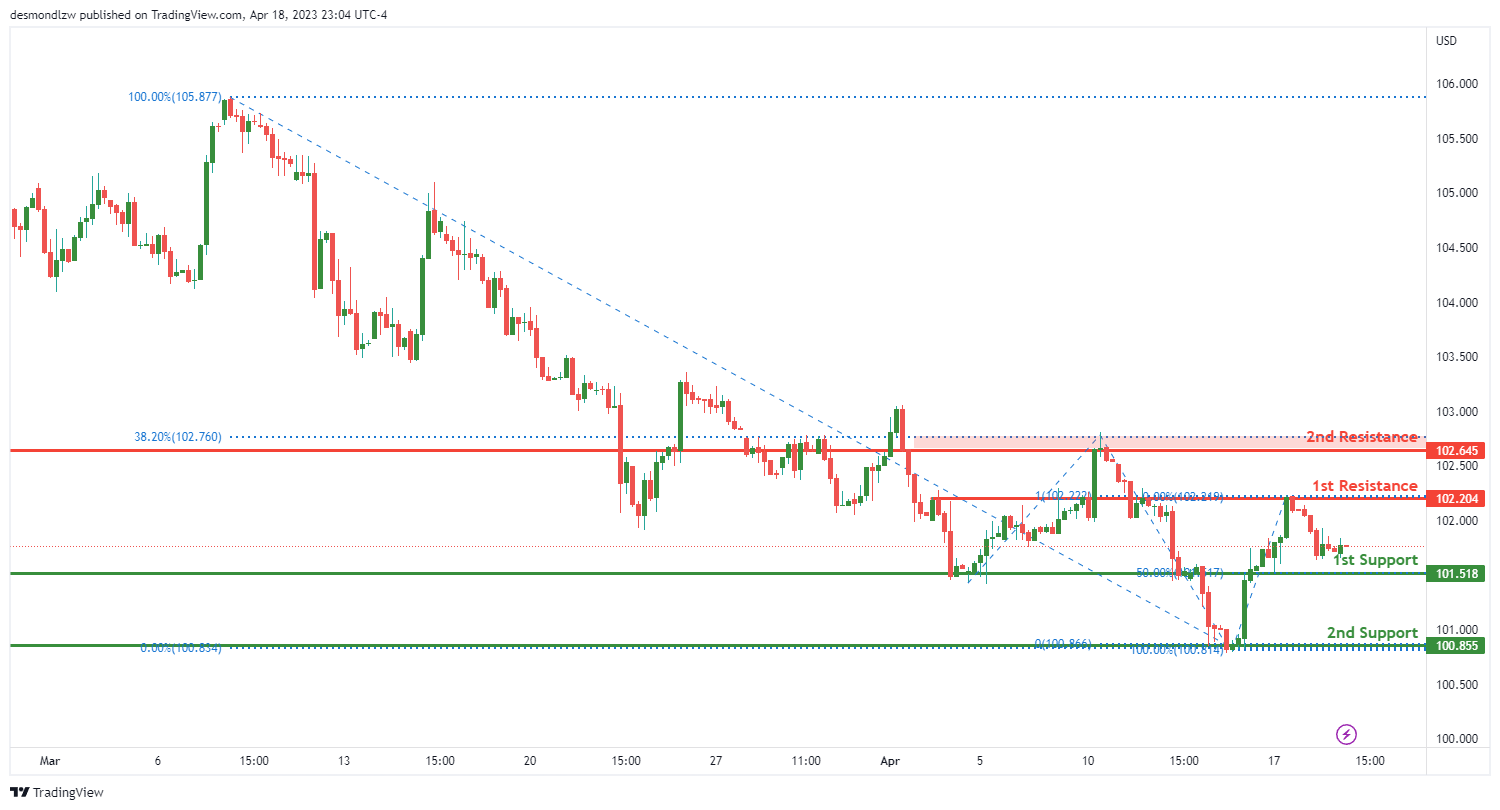
The US Dollar Index (DXY) is currently experiencing a bearish momentum with a potential for further downward movement. The first support level is at 101.51, which is an overlap support and coincides with the 50% Fibonacci retracement level. The second support level is at 100.86, which is a multi-swing low support level.
On the other hand, the first resistance level is at 102.20, which is an overlap resistance and coincides with the 100% Fibonacci projection level. The second resistance level is at 102.64, which is an overlap resistance and coincides with the 38.20% Fibonacci retracement level.
Given the bearish momentum, the price may continue to drop towards the first support level. If the price bounces off this level, it may rise towards the first resistance level. However, if the first support level is broken, the price may drop towards the second support level. Conversely, if the first resistance level is broken, the price may rise towards the second resistance level.
EUR/USD:
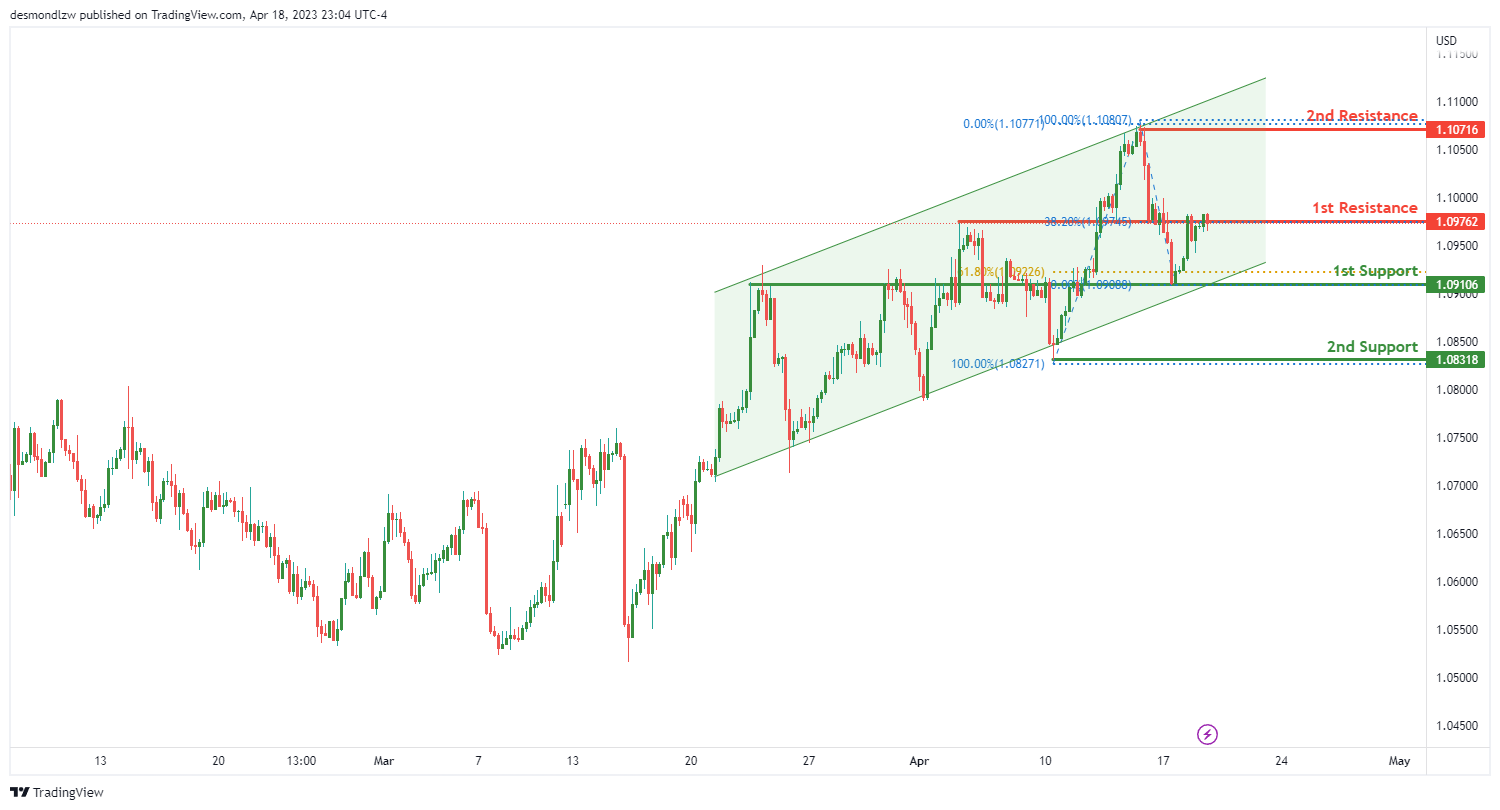
The EUR/USD chart is currently experiencing bullish momentum as it is in a bullish ascending channel. If the momentum continues, there is a possibility that the price could potentially make a bullish break through the 1st resistance and rise to the 2nd resistance level.
The 1st support level is at 1.0910, which is a good support level as it is an overlap support and is also at the 61.80% Fibonacci retracement level. Another support level is the 2nd support level at 1.0831, which is a swing low support.
On the other hand, the 1st resistance level is at 1.0976, which is a good resistance level as it is an overlap resistance and is at the 38.20% Fibonacci retracement level. The 2nd resistance level is at 1.1071, which is a swing high resistance.
been tested multiple times in the past and has shown to provide a strong resistance zone for price.
GBP/USD:
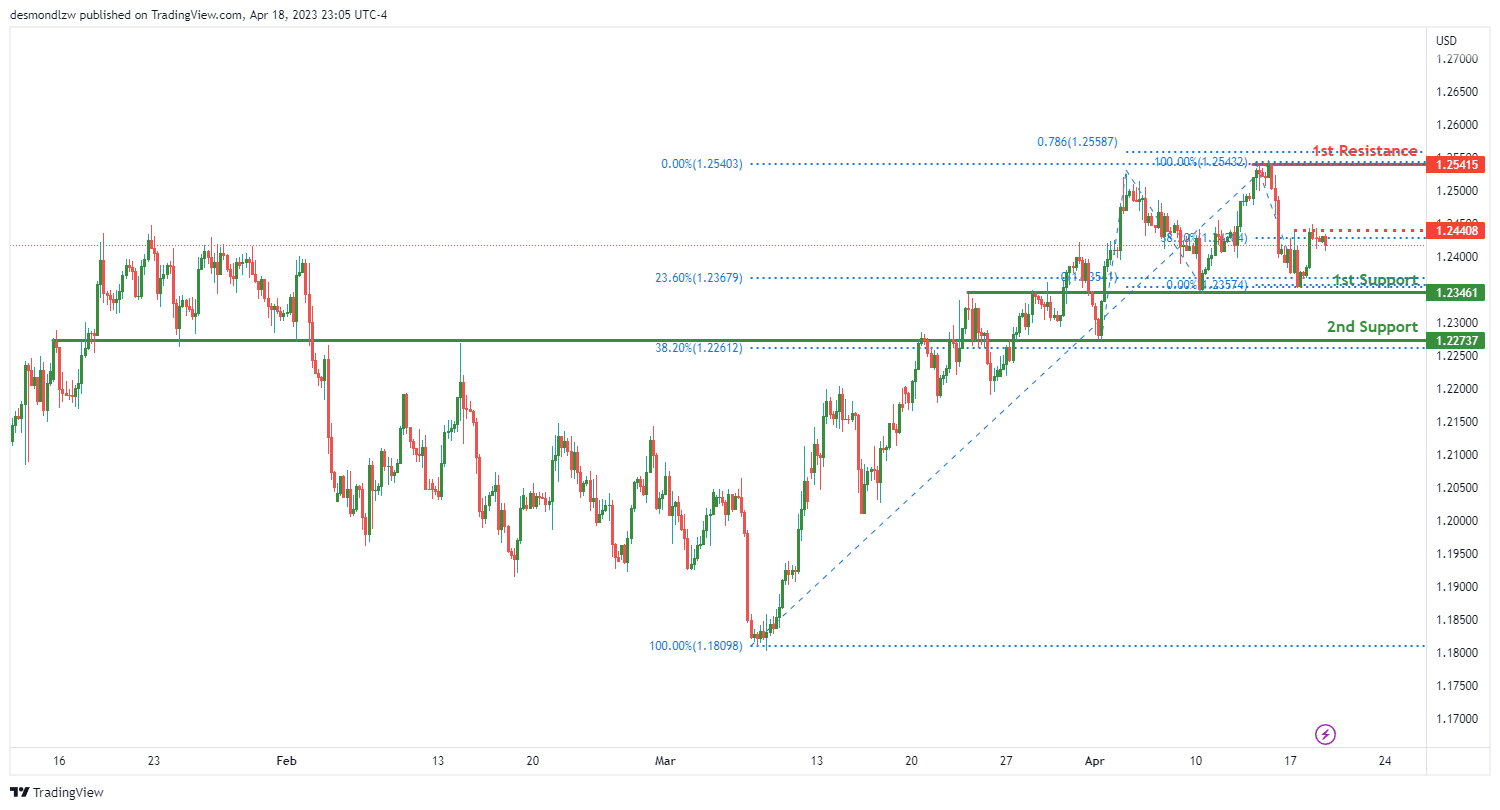
The GBP/USD chart is bullish, indicating a potential continuation towards the first resistance level. Price is currently trading above an ascending support line, which is in line with the bullish momentum of the chart.
The first support level is at 1.2346, which is a strong overlap support, coinciding with the 23.60% Fibonacci retracement. The second support level is at 1.2273, which is another overlap support, coinciding with the 38.20% Fibonacci retracement.
The first resistance level is at 1.2541, which is a swing high resistance, coinciding with the 78.60% Fibonacci projection. If price were to break through this level, it could potentially trigger a strong bullish acceleration towards the intermediate resistance level at 1.2440, which is also a swing high resistance.
USD/CHF:
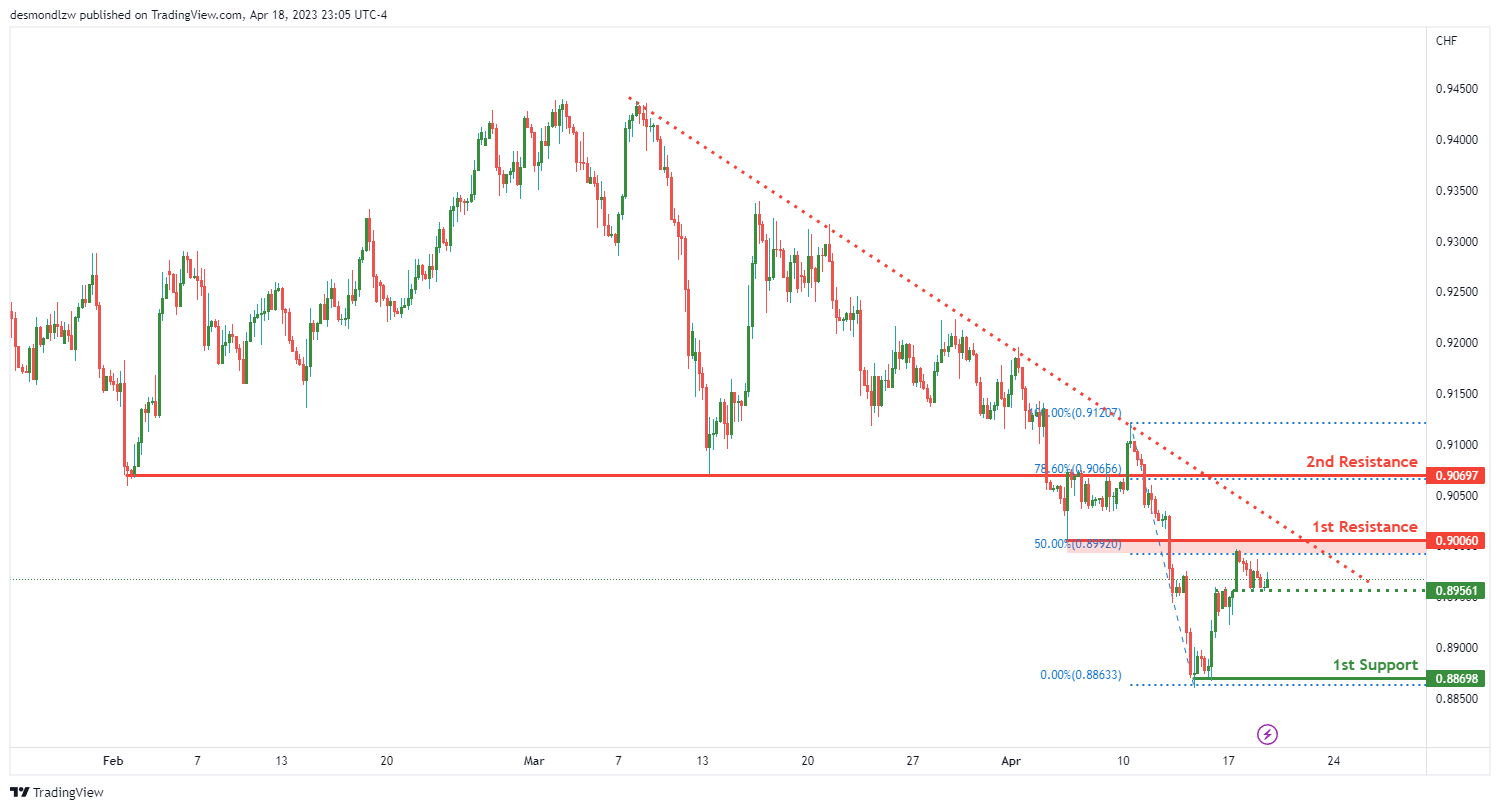
The USD/CHF chart is currently showing bearish momentum as price is below a major descending trend line, which suggests further downward movement. The 1st resistance is at 0.9006, and it is a good level for potential pullbacks as it is an overlap resistance, and a 50% Fibonacci retracement also lines up with this level. If price fails to break this level, it could potentially make a bearish continuation towards the 1st support at 0.8869. This level is a multi-swing low support, and could provide a strong bounce for the pair.
However, if price were to break the 1st support, the intermediate support at 0.8956 could provide a short-term pause to the bearish momentum. If the intermediate support fails to hold, the next level that price could potentially drop to is the 2nd support at 0.8749, which is also a multi-swing low support.
USD/JPY:
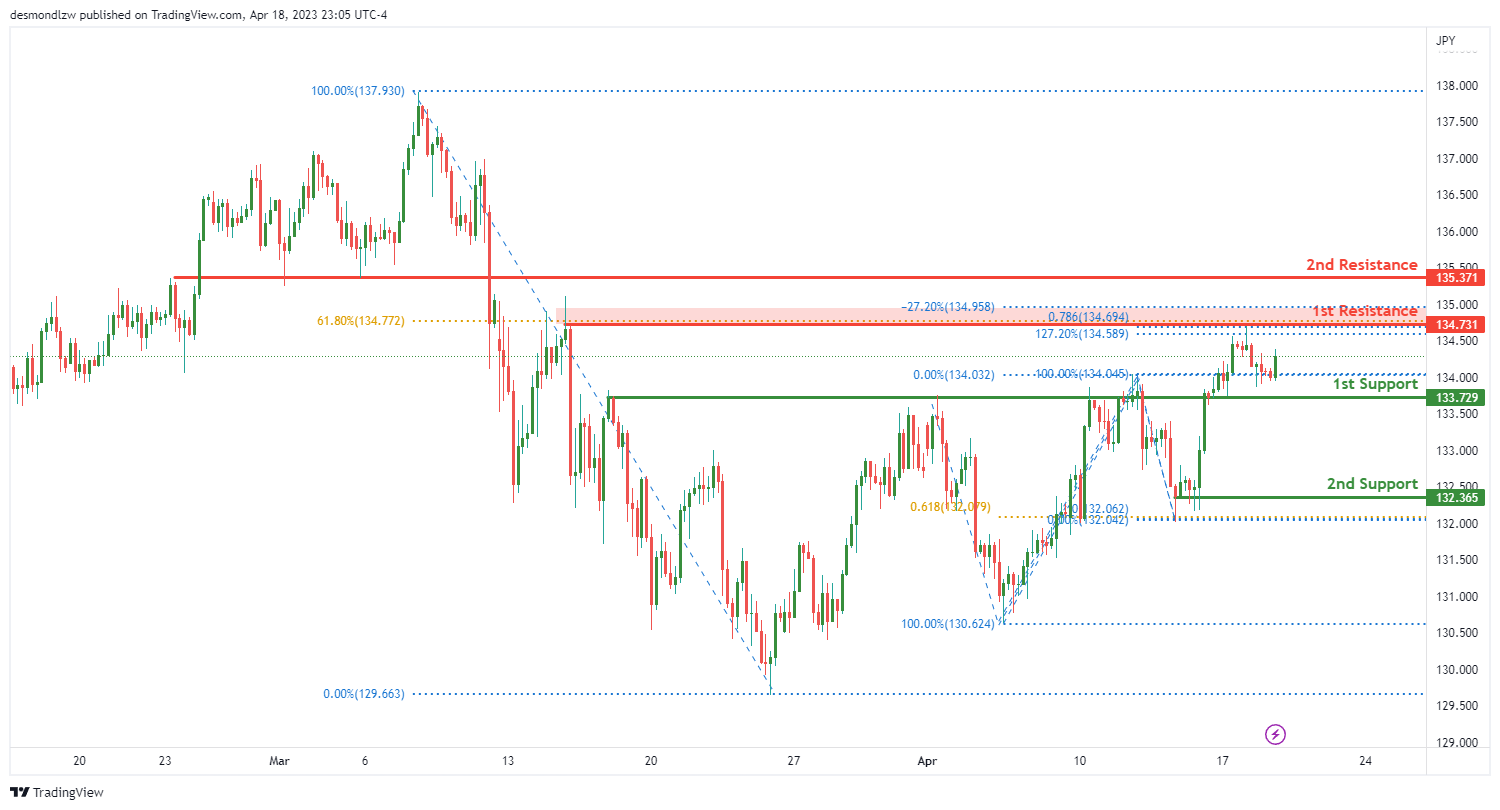
The overall momentum of the USD/JPY chart appears to be bearish, but there is a potential for a short-term bullish rise towards the first resistance level before reversing and dropping towards the first support.
Currently, the USD/JPY price is approaching the first resistance at 134.73, which is a strong overlap resistance and coincides with a 61.80% Fibonacci retracement. A rise towards this resistance level in the short term could be possible before a reversal occurs.
However, the overall momentum of the chart is bearish, and the price could potentially drop towards the first support at 133.72. This support level is also a strong overlap support, which adds to its significance. If the price were to break below the first support level, it could drop towards the second support level at 132.36. This level is a multi-swing low support and also lines up with a 61.80% Fibonacci projection, making it a strong potential support level.
On the upside, the USD/JPY price may encounter intermediate resistance at 135.37, which is a pullback resistance level. If the price were to break through this resistance, it could rise towards the second resistance level at 136.09.
AUD/USD:
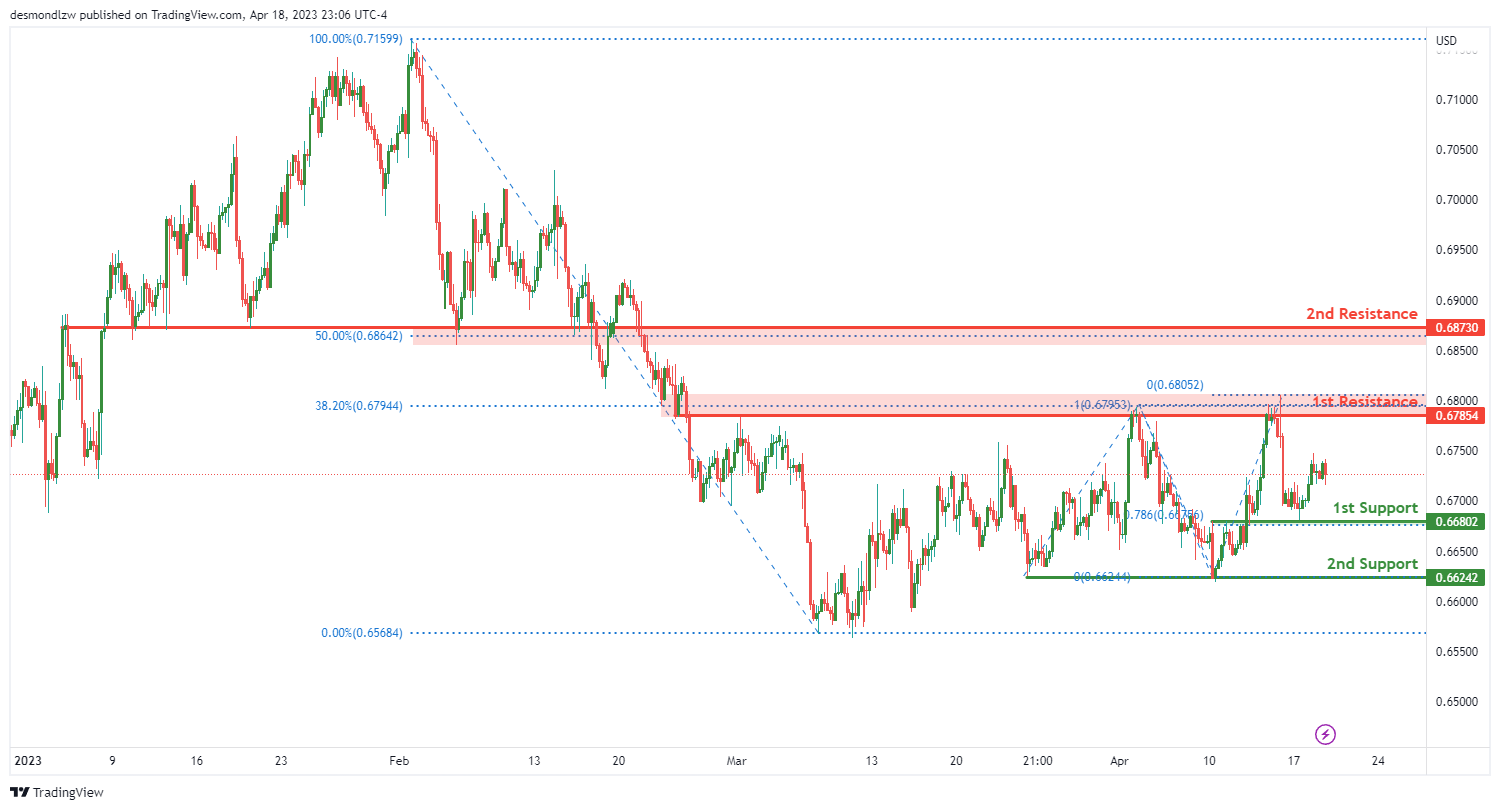
The AUDUSD chart appears to be in a neutral momentum phase. It’s possible that prices could move within the range of the 1st resistance and 1st support levels.
The 1st support level at 0.6680 is a strong overlap support with a 78.60% Fibonacci Projection lining up with it, suggesting that it could hold as a support level. The 2nd support level at 0.6624 is a multi-swing low support.
On the resistance side, the 1st resistance level at 0.6785 is an overlap resistance with a 38.20% Fibonacci Retracement lining up with it. The 2nd resistance level at 0.6873 is a pullback resistance with a 50% Fibonacci Retracement lining up with it.
NZD/USD:
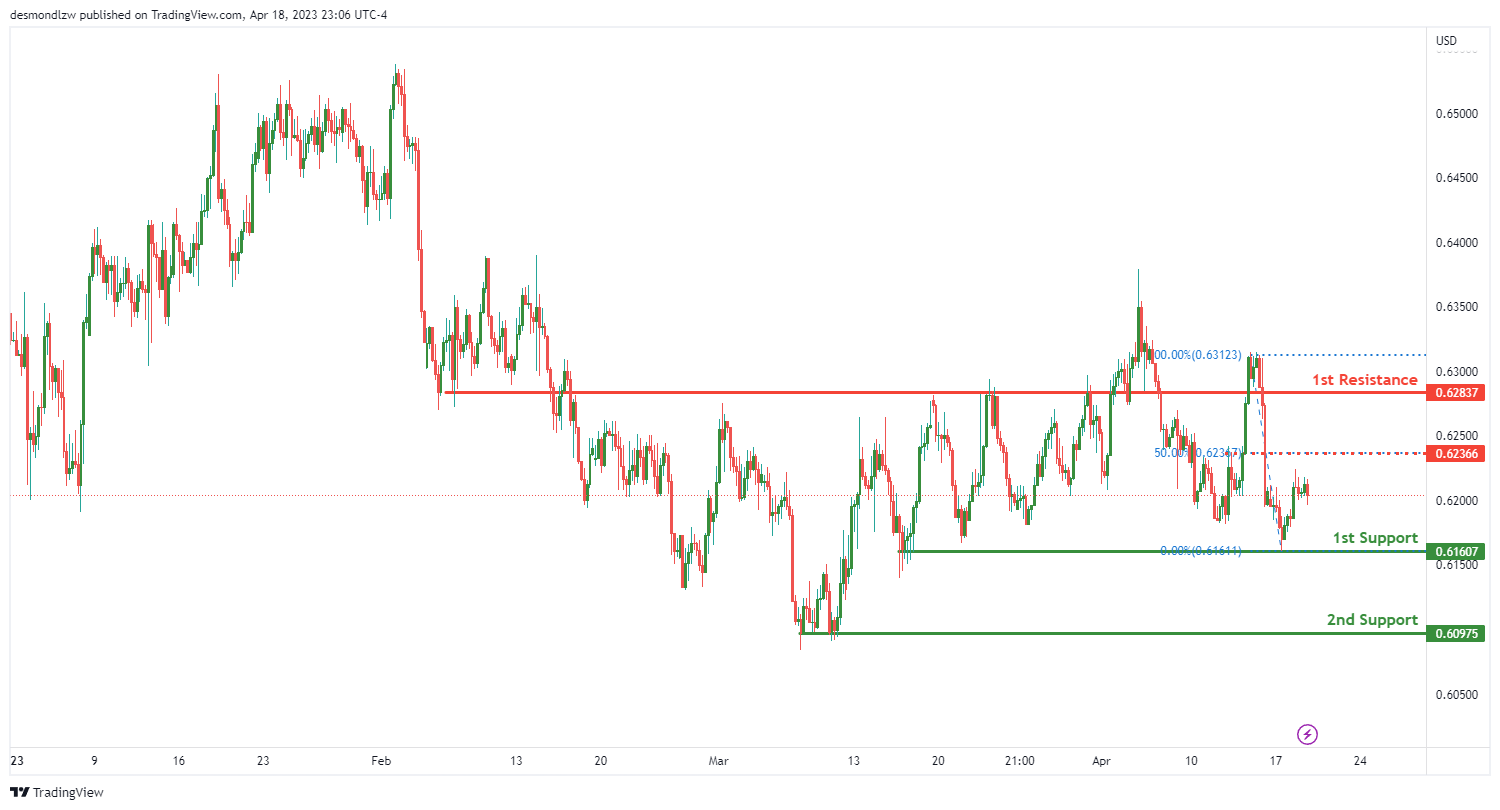
The overall momentum of the NZD/USD chart is bullish, suggesting that there may be a potential for a bullish continuation towards the 1st resistance level.
Currently, the 1st support level for NZD/USD is at 0.6160, which is a multi-swing low support level. In addition, there is also a 2nd support level at 0.6097, which is also a multi-swing low support level.
On the other hand, the 1st resistance level for NZD/USD is at 0.6283, which is a pullback resistance level. There is also an intermediate resistance level at 0.6236, which is a pullback resistance level and is at the 50% Fibonacci retracement level.
If the bullish momentum continues, NZD/USD could potentially break through the 1st resistance level and rise towards the intermediate resistance level. However, if the bearish momentum takes over, NZD/USD could potentially drop towards the 2nd support level.
USD/CAD:
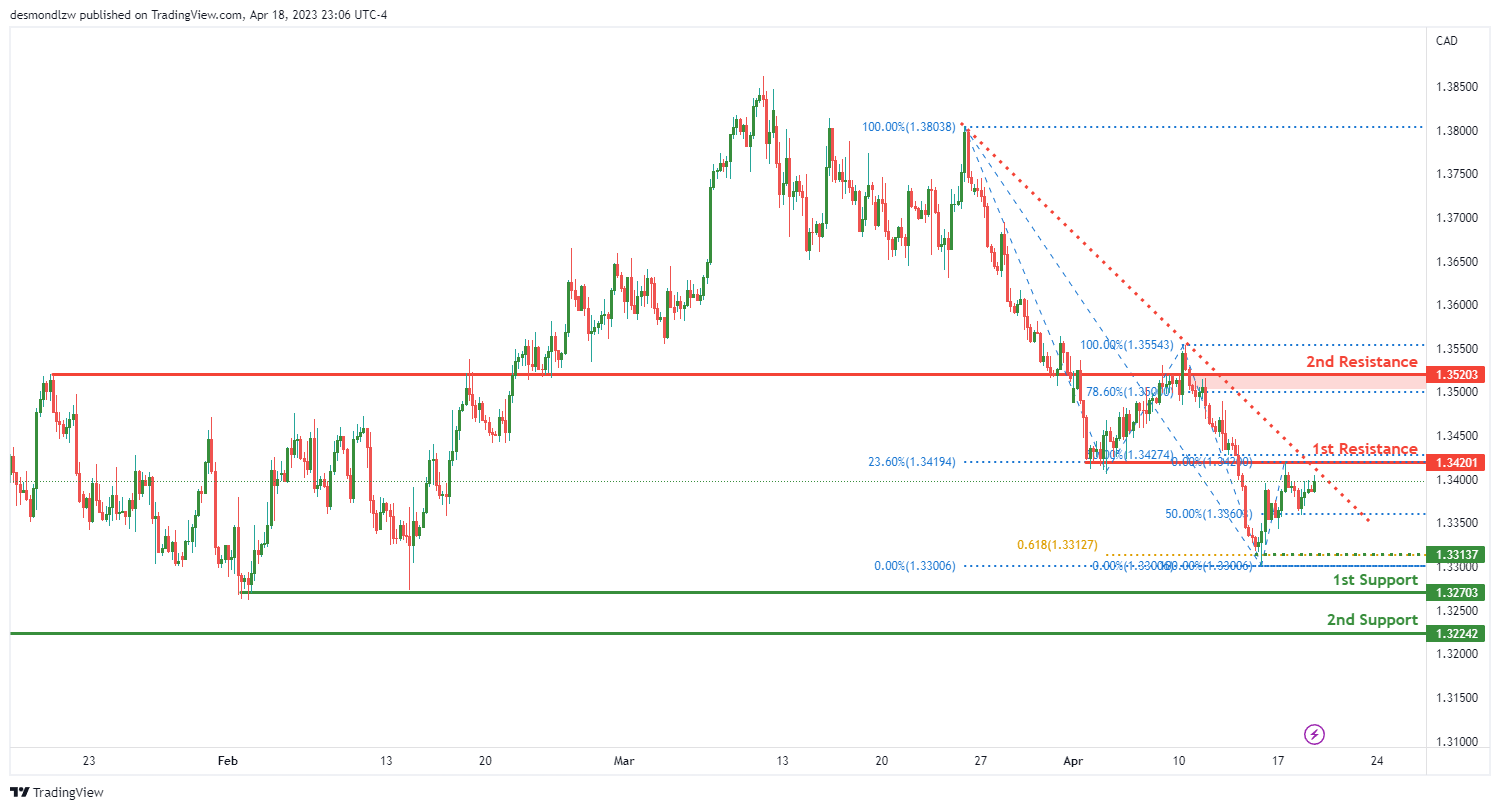
The USD/CAD chart is showing bearish momentum, with price potentially rising towards the 1st resistance level in the short term before reversing off it and dropping towards the 1st support level.
Looking at the chart, the overall momentum is bearish, with two strong support levels below the current price. The first support is at 1.3270, which is a multi-swing low support. The second support is at 1.3224, which is a swing low support. These two support levels suggest that there is strong bearish momentum on the chart.
On the other hand, there are two strong resistance levels above the current price. The first resistance is at 1.3420, which is an overlap resistance and has a 23.60% Fibonacci retracement lining up with it. The second resistance is at 1.3520, which is also an overlap resistance and has a 78.60% Fibonacci retracement lining up with it. These two resistance levels suggest that price may rise towards them in the short term before reversing off.
There is also an intermediate support level at 1.3313, which is a swing low support. This support level is important as it suggests that if price were to break below the first support level, it could potentially drop to this intermediate support before reaching the second support level.
DJ30:
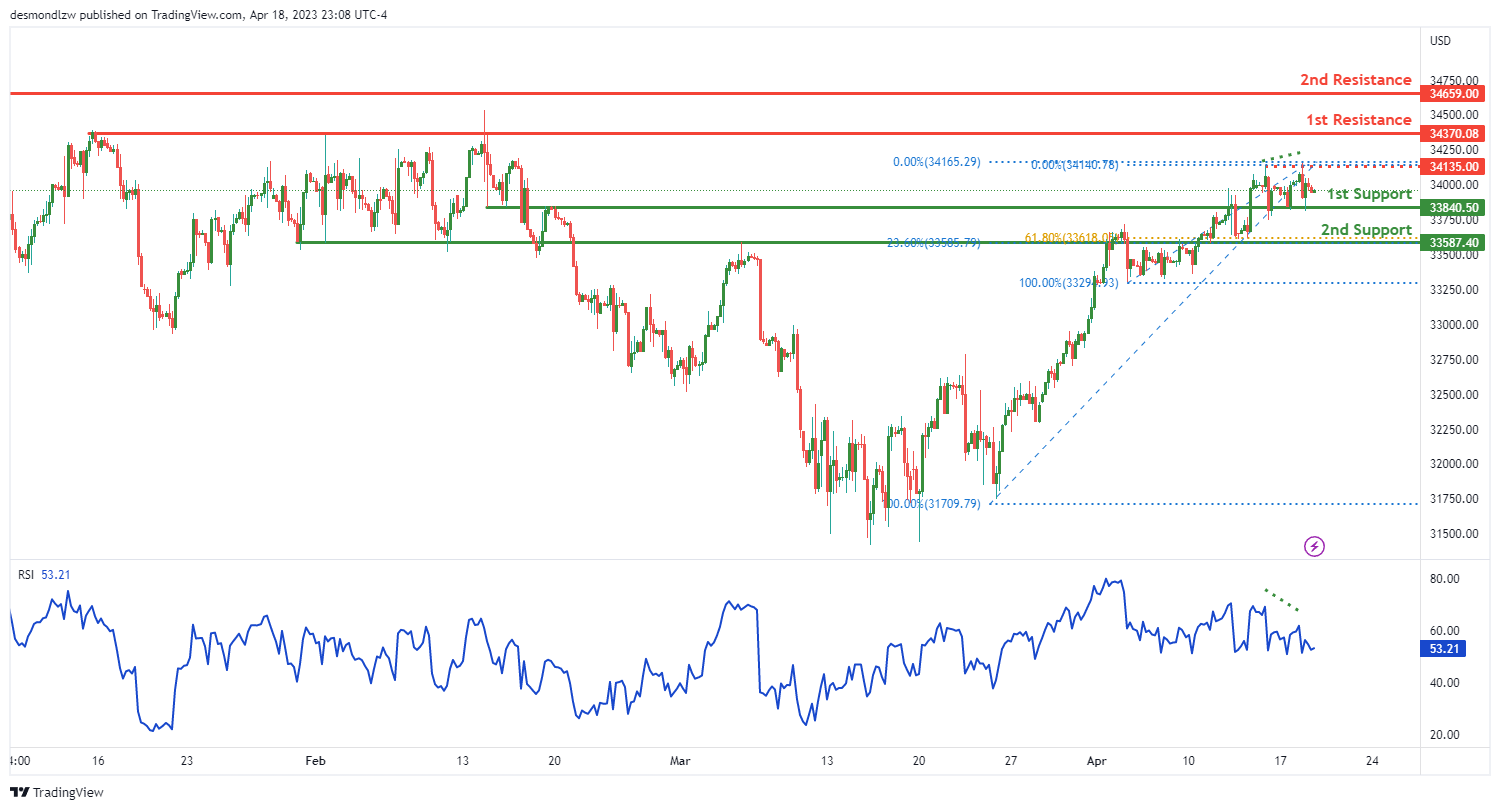
The DJ30 index is currently exhibiting a bearish overall momentum. The price could potentially break below the 1st support at 33840.50, suggesting a drop towards the 2nd support at 33587.40. The 1st support level is an overlap support, which gives us confidence that it will hold. The 2nd support is a swing low support and is backed up by a 23.60% Fibonacci retracement, making it an even stronger level of support.
On the resistance side, the 1st resistance is at 34370.08, which is a multi-swing high resistance. This level could potentially act as a strong barrier for any bullish movement. The 2nd resistance is at 34659.00, which is a swing high resistance. It is always a strong level of resistance that the price has failed to breach in the past.
In between the 1st resistance and 1st support, we have an intermediate resistance level at 34135.00, which is a swing high resistance. It could provide some minor resistance on the way down.
The RSI is displaying bearish divergence versus price, suggesting that a reversal might occur soon. This supports our bearish outlook on the DJ30 index.
GER30:
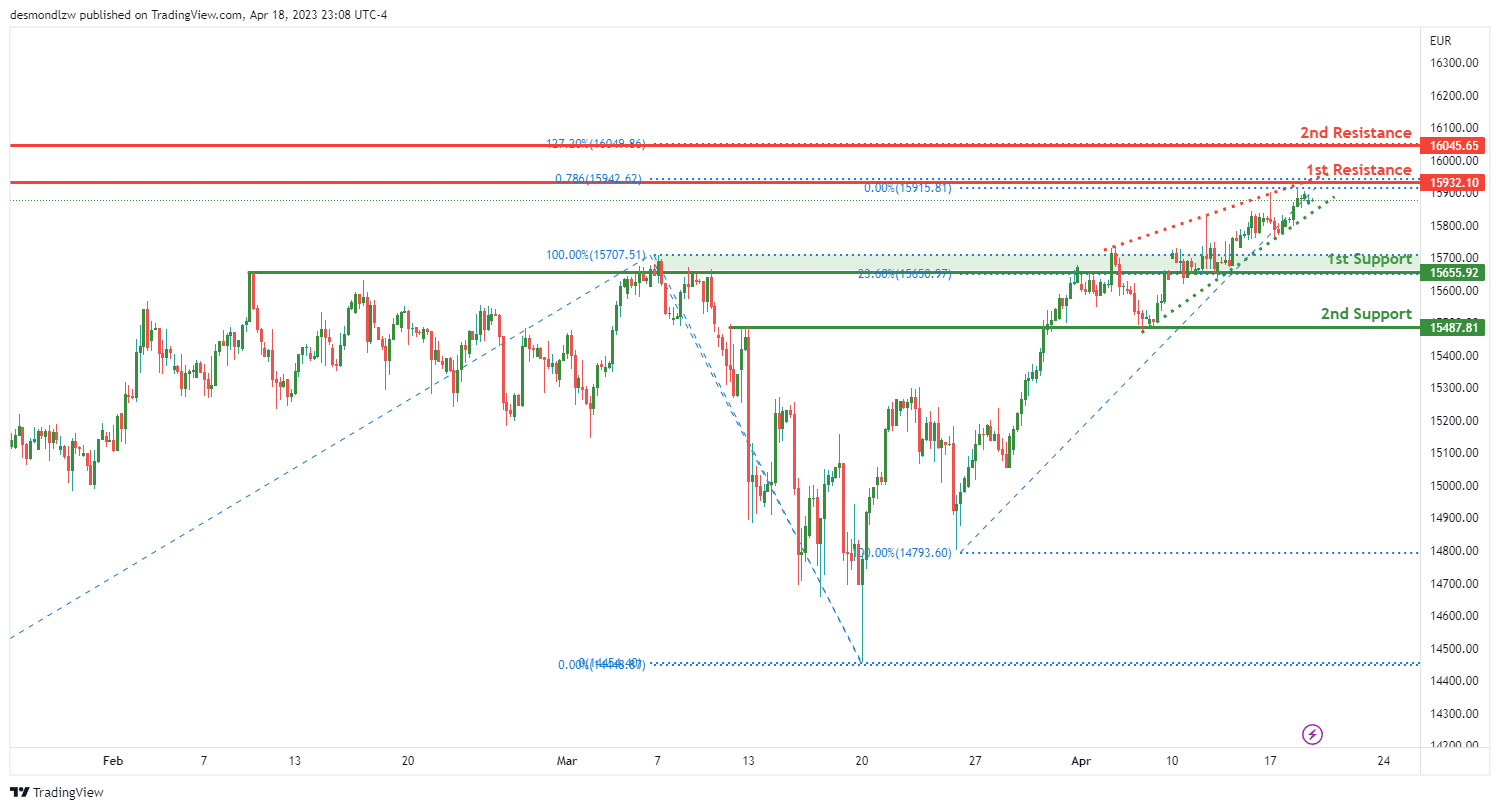
The GER30 chart suggests a bearish momentum, with the rising wedge pattern signaling an imminent breakout to the downside. Prices could potentially make a bearish reaction off the first resistance and drop to the first support.
The first support level at 15655.92 is a strong overlap support, with a 23.60% Fibonacci retracement lining up with it. A break below this level could potentially push prices towards the second support at 15487.81, which is also an overlap support level.
On the other hand, the first resistance at 15932.10 is a swing high resistance, with a 78.60% Fibonacci projection lining up with it. If prices manage to break above this level, it could trigger a bullish acceleration towards the second resistance at 16045.65, which is another swing high resistance level with the 127.20% Fibonacci extension lining up with it.
BTC/USD:
he overall momentum of the BTC/USD chart is bullish, and price could potentially make a bullish continuation towards the 1st resistance level. The 1st support level is at 29299.00, which is an overlap support and coincides with a 23.60% Fibonacci retracement. The 2nd support level is at 28686.00, which is another overlap support and coincides with a 50% Fibonacci retracement. On the other hand, the 1st resistance level is at 31015.00, which is a swing high resistance. In between the current price and the 1st resistance level, there is an intermediate resistance level at 30580.00, which is also an overlap resistance

US500
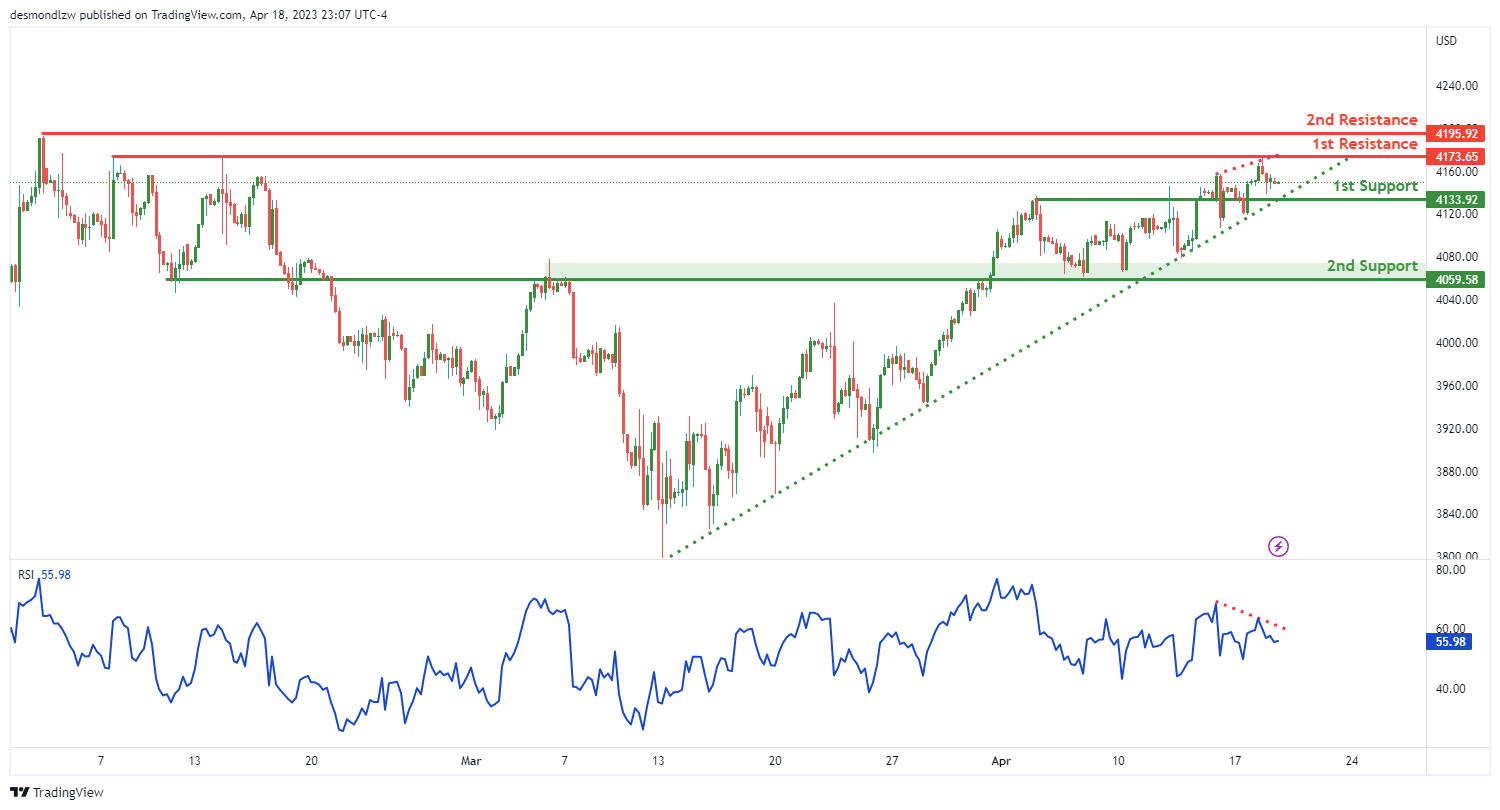
The US500 chart indicates a bearish momentum, with price potentially heading towards the first support level at 4133.92. The overall bias is bearish, with factors such as a bearish continuation and a major ascending trend line adding to the current downward trend.
Price is currently above a major ascending trend line, which suggests further bullish momentum is on the cards. Additionally, the price is on an ascending trend line that acts as support, but a break below this trend line could trigger a drop towards the first support level.
The first support level is located at 4133.92, which is an overlap support and could provide some buying interest. However, if the price were to break below this support level, the next support level could be seen at 4059.58, which is also an overlap support.
On the other hand, the first resistance level is located at 4173.65, which is a swing high resistance. If the price were to break above this resistance level, it could potentially rise towards the second resistance level at 4195.92, which is also a swing high resistance.
It’s worth noting that RSI is displaying bearish divergence versus price, which suggests that a reversal might occur soon.
ETH/USD:
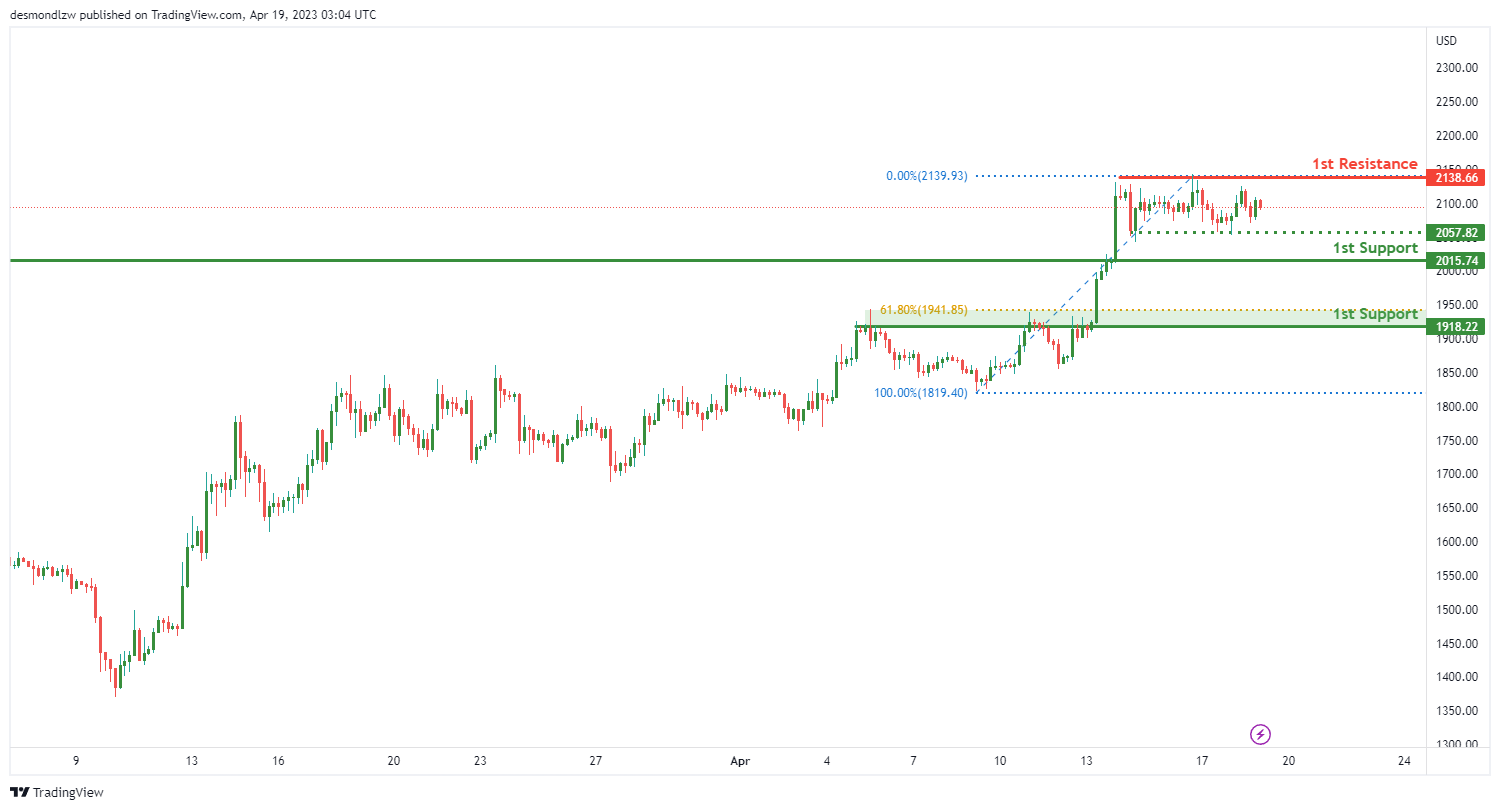
The Ethereum/USD pair is showing a neutral momentum overall. The price could potentially fluctuate between the first resistance and first support levels. The first support level is located at 2015.74 and is a pullback support, while the second support level is located at 1918.22 and is also a pullback support. On the other hand, the first resistance level is located at 2138.66 and is a multi-swing high resistance, while the intermediate support level is located at 2057.82 and is a multi-swing low support.
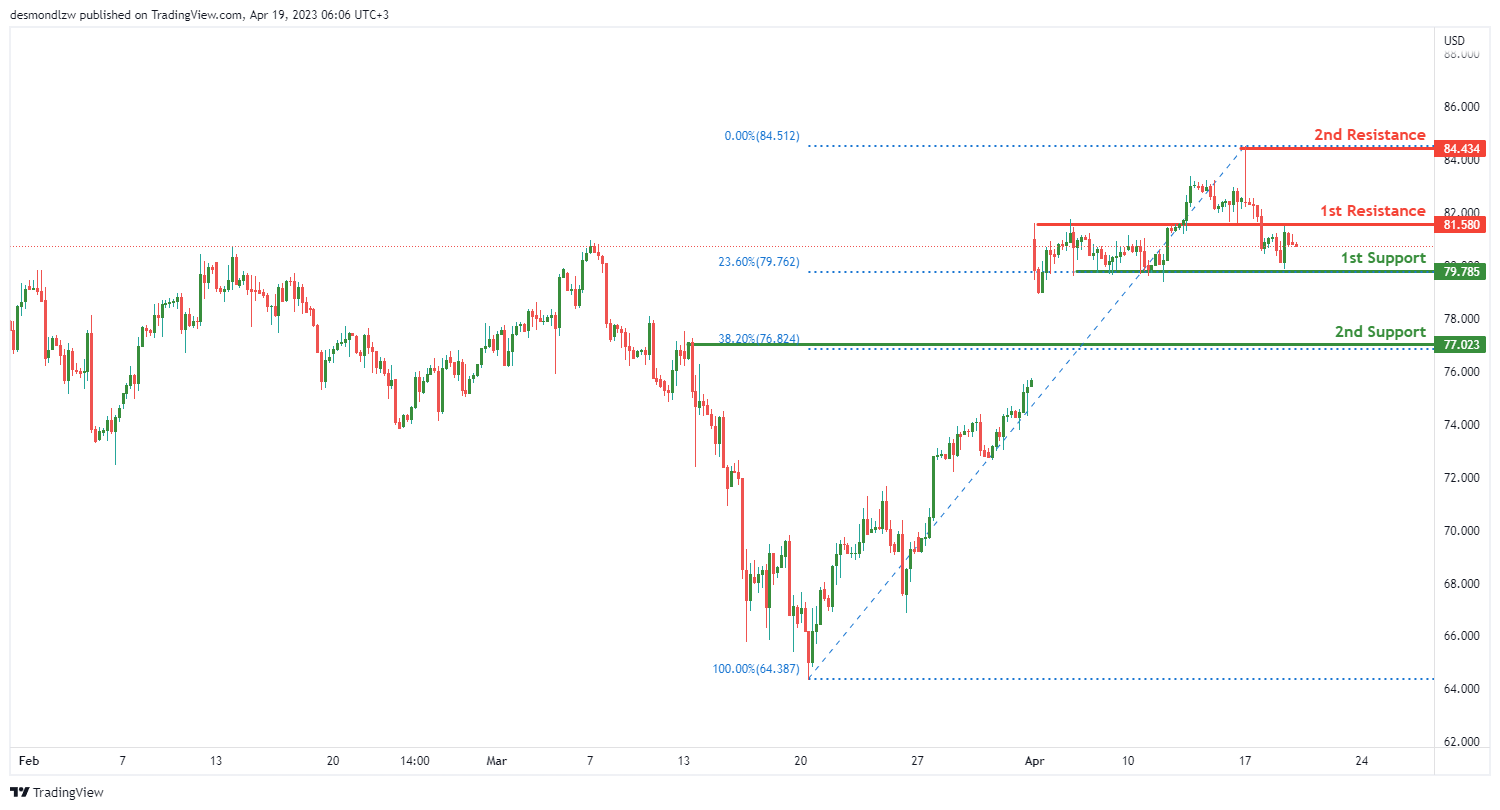
WTI/USD:
WTI crude oil has been displaying bearish momentum in recent times, with prices continuing to move lower. As of the latest analysis, the overall momentum of the chart is bearish, with the price potentially making a bearish continuation towards the first support level.
The first support level is at 79.78, which is an overlap support and the 23.60% Fibonacci retracement level. If the price breaks below this level, it could drop towards the second support at 77.02, which is a pullback support and the 38.20% Fibonacci retracement level.
On the other hand, the first resistance level is at 81.58, which is an overlap resistance level. If the price manages to break above this level, it could rise towards the second resistance level at 84.43, which is a swing high resistance level.
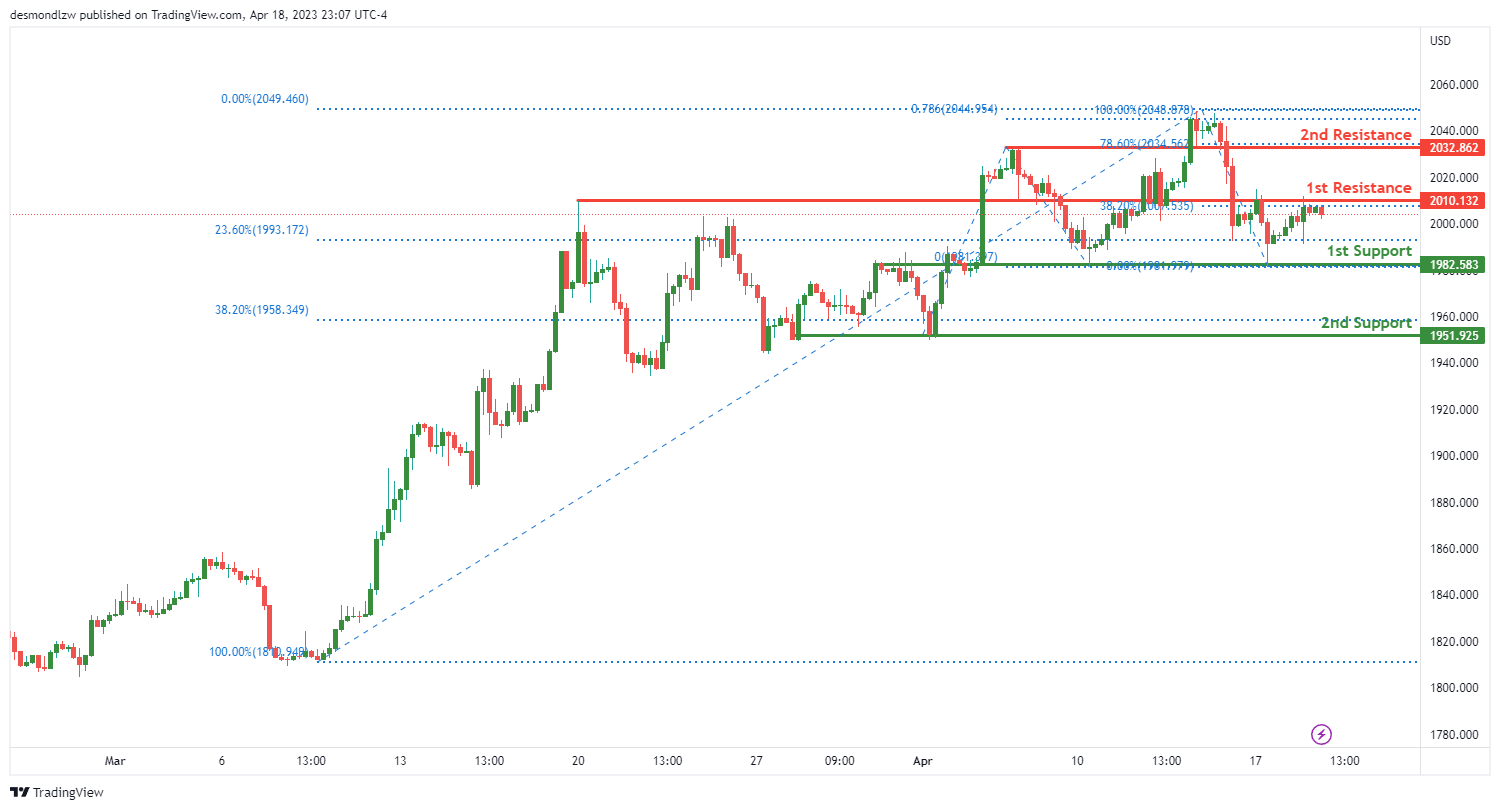
XAU/USD (GOLD):
Gold prices have been showing bearish momentum recently, with prices potentially continuing downwards towards the 1st support level of 1982.58. This support level is an overlap support and is also at the 23.60% Fibonacci retracement level, which adds to its significance. If prices break below this level, the next potential support level is at 1951.92, which is a multi-swing low support and is at the 38.20% Fibonacci retracement level.
On the upside, the first resistance level is at 2010.12, which is an overlap resistance and is at the 38.20% Fibonacci retracement level. If prices manage to break above this resistance level, the next potential resistance level is at 2032.86, which is a pullback resistance and is at the 78.60% Fibonacci retracement level.
Overall, the momentum of the chart is bearish for XAU/USD. If prices continue to drop, traders should keep an eye on the support levels mentioned above. However, if prices manage to break above the resistance levels, this could suggest a shift in momentum to bullish.
The accuracy, completeness and timeliness of the information contained on this site cannot be guaranteed. IC Markets does not warranty, guarantee or make any representations, or assume any liability regarding financial results based on the use of the information in the site.
News, views, opinions, recommendations and other information obtained from sources outside of www.icmarkets.com, used in this site are believed to be reliable, but we cannot guarantee their accuracy or completeness. All such information is subject to change at any time without notice. IC Markets assumes no responsibility for the content of any linked site.
The fact that such links may exist does not indicate approval or endorsement of any material contained on any linked site. IC Markets is not liable for any harm caused by the transmission, through accessing the services or information on this site, of a computer virus, or other computer code or programming device that might be used to access, delete, damage, disable, disrupt or otherwise impede in any manner, the operation of the site or of any user’s software, hardware, data or property.


