
Key risk events today:
UK CPI y/y; UK PPI Input m/m; Canadian CPI m/m, Common CPI y/y, Median CPI y/y, Trimmed CPI y/y; Crude Oil Inventories; FOMC Economic Projections; FOMC Statement; FOMC Federal Funds Rate and Press Conference.
EUR/USD:
Tuesday saw traders long the dip out of 1.10, consequently reclaiming all of Monday’s lost ground. Sentiment took a turn for the better during US trade amid reports Saudi Arabia’s oil output would return to normal levels in the next two to three weeks. German ZEW surveys came in mixed. Economic sentiment improved in September to -22.5 from -44.1 previous, though the current situation deteriorated to -19.9 from -13.5 in August.
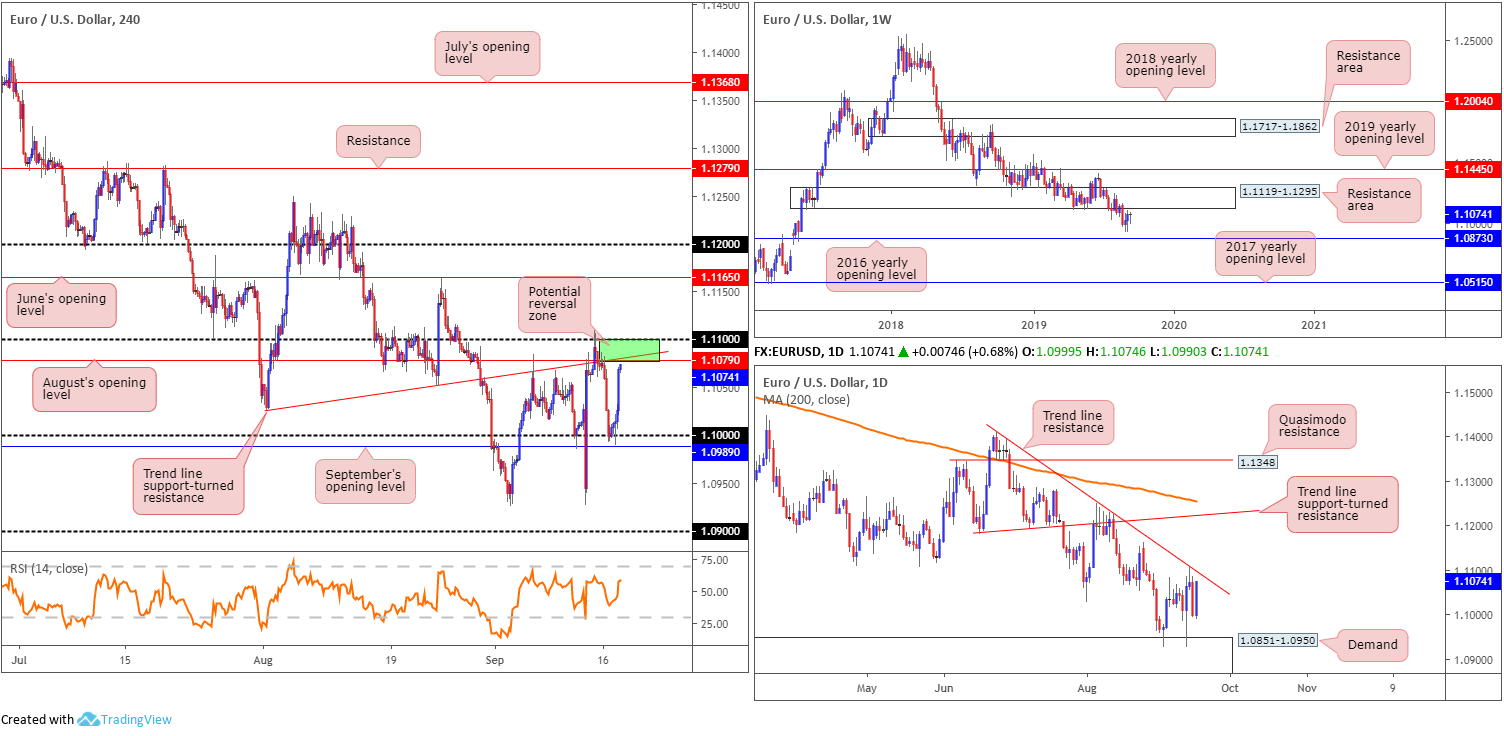
Technical research reveals the H4 candles are positioned within touching distance of August’s opening level at 1.1079 (resistance), which happens to intersect with a familiar trend line support-turned resistance (extended from the low 1.1032). Resistance beyond here falls in at the 1.11 handle, followed by June’s opening level at 1.1165. RSI momentum currently stands at a touch above 60, poised to approach overbought territory.
With respect to higher-timeframe structure, weekly price is leaning towards a retest of a demand-turned resistance area at 1.1119-1.1295, with the 2016 yearly opening level at 1.0873 set as the next support target. Concerning overall trend direction, since topping in early 2018 at 1.2555, the long-term trend remains pointing in a southerly bearing. According to daily structure, the unit is looking at a revisit of trend line resistance taken from the high 1.1412.
Areas of consideration:
The green zone on the H4 timeframe between the 1.11 handle, trend line support-turned resistance and August’s opening level at 1.1079, is likely of interest today for possible shorting opportunities. In addition to this, the current daily trend line resistance highlighted above merges with the said H4 zone. For those looking to press this bearish theme, the research team recommends waiting for additional H4 candlestick structure to form before pulling the trigger for two reasons (entry/risk can be determined according to this pattern). Firstly, the top edge of the H4 zone, the round number 1.11, is prone to stop runs and could unnecessarily liquidate a position. Secondly, the underside of the weekly resistance area mentioned above at 1.1119-1.1295 is set just 20 points above 1.11, which could act as a magnet for price, therefore igniting a fakeout higher to run orders at 1.11.
GBP/USD:
The British pound overturned Monday’s dip to sub-1.24 and refreshed tops beyond 1.25 to 1.2526 Tuesday. Renewed dollar weakness, despite upbeat industrial production data (low impact expected), helped regain traction.
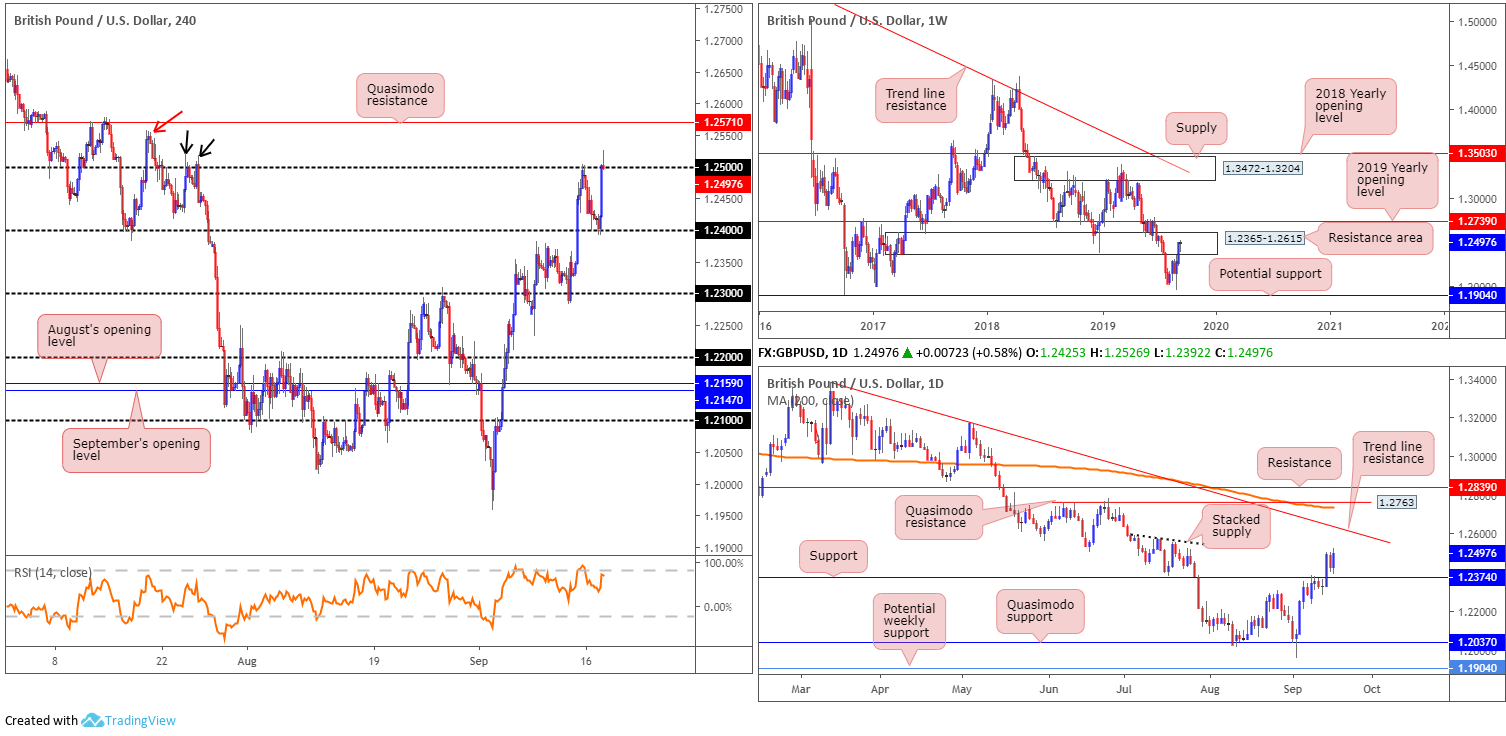
With buy stops now likely triggered above 1.25, this may set the stage for a run towards Quasimodo resistance at 1.2571. Interestingly, the high 1.2558 (red arrow), and the highs set beneath it (black arrows) at 1.2522ish, likely have buy stops plotted above. This may help provide liquidity to sell the said Quasimodo resistance.
Higher-timeframe structure on the weekly timeframe remains unchanged: price continues to toy with a long-term resistance area coming in at 1.2365-1.2615, though has so far failed to register much in the way of downside intent. Daily flow, on the other hand, has a stacked supply to the left (possibly weak), with a break of this structure unlocking the door to trend line resistance extended from the high 1.3380.
Areas of consideration:
In the event we overthrow 1.25, buying is possible, at least until reaching H4 Quasimodo resistance at 1.2571. For those who want to press this bullish scenario, waiting for a retest at 1.25 as support to develop is suggested (entry and risk can be found on the back of the rejecting candle’s structure).
Not only is the H4 Quasimodo an upside target, it is also considered a sell zone given it is located within the walls of the weekly resistance area highlighted above at 1.2365-1.2615 and has H4 liquidity pockets (above highs on approach) below it in the form of buy stops to sell into.
AUD/USD:
Early hours witnessed the commodity-linked currency decline versus the buck Tuesday, influenced in response to the RBA’s September meeting Minutes coming in more dovish than anticipated. The central bank left rates unchanged at the record low of 1.00%, though the minutes were more dovish than the post-meeting statement had implied. The document indicated Australian policymakers support further easing in the cash rate.
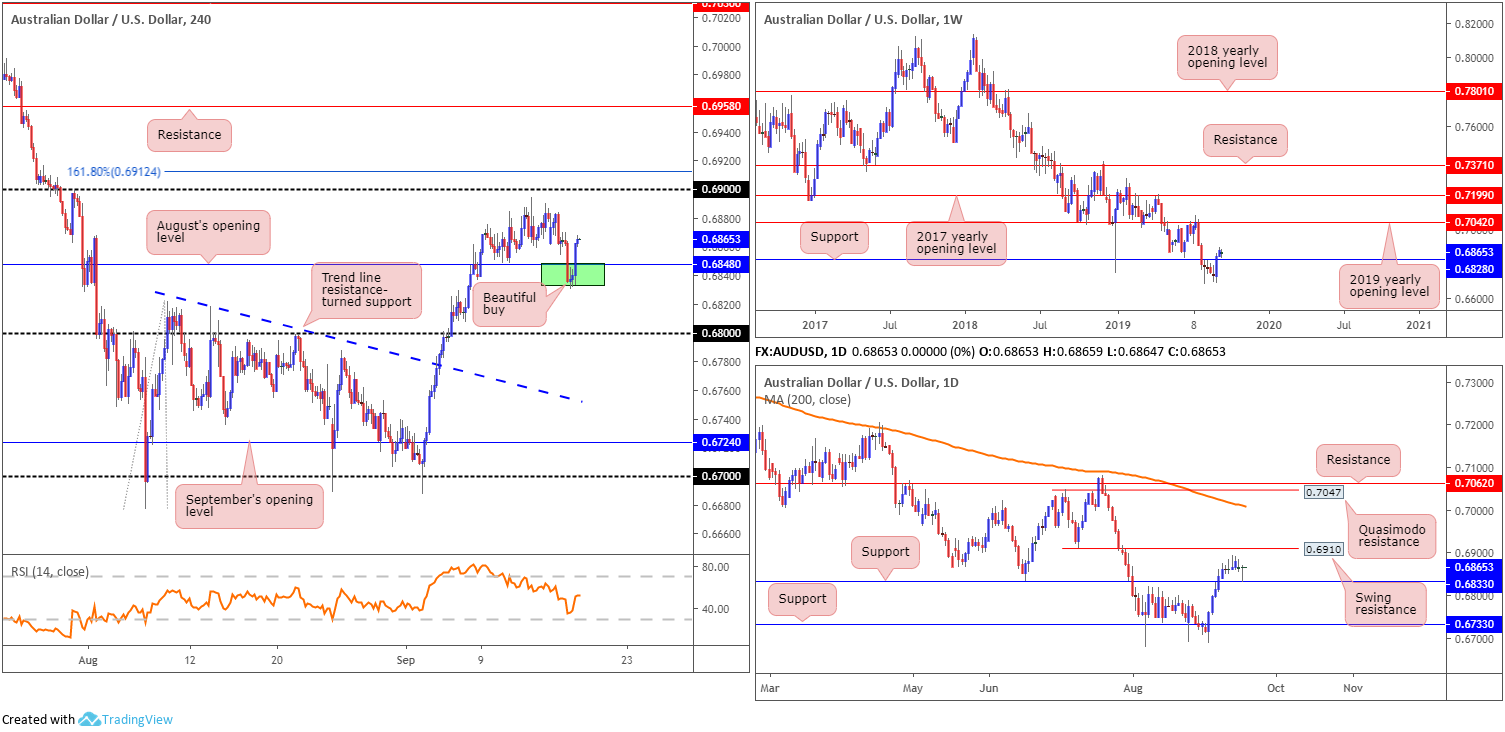
The dip drew H4 price deep into an area of interest formed by way of a daily support level coming in at 0.6833 and August’s opening level at 0.6848 on the H4 timeframe (green).
On a wider perspective, things remain pretty much unchanged in terms of technical structure.
From the weekly timeframe:
After staging a healthy comeback in recent weeks, involving the unit reclaiming position above support at 0.6828, further buying materialised last week, consequently posting a modestly healthy gain. If buyers remain in the driving seat, an approach towards the 2019 yearly opening level at 0.7042 is likely on the cards.
Daily perspective:
In conjunction with weekly structure, the daily timeframe also maintains a bullish position north of support at 0.6833. Interestingly, yesterday’s movement had its candle retest the said support in the shape of a near-perfect hammer candlestick formation (considered a bullish signal). The next upside target on this scale falls in at 0.6910, a swing resistance. However, beyond here the research team has eyes on Quasimodo resistance at 0.7047 and resistance at 0.7062. It might also interest some traders to note the 200-day SMA lurks close by at 0.7011 (orange).
Areas of consideration:
Considering the bullish theme on the higher timeframes right now, the retest of 0.6833/0.6848 (green) on the H4 timeframe was appealing, and even chalked up a bullish inside candle pattern to tempt even the most conservative traders to get involved.
Traders long this market likely have tops set just south of 0.69 as the initial upside target, closely followed by 0.69 and then daily resistance at 0.6910, followed by the 161.8% H4 Fibonacci ext. point mentioned above at 0.6912.
USD/JPY:
Despite striking six-week highs at 108.37 Tuesday and marked precariousness in crude oil, USD/JPY movement settled the session unmoved at the top edge of Monday’s range.
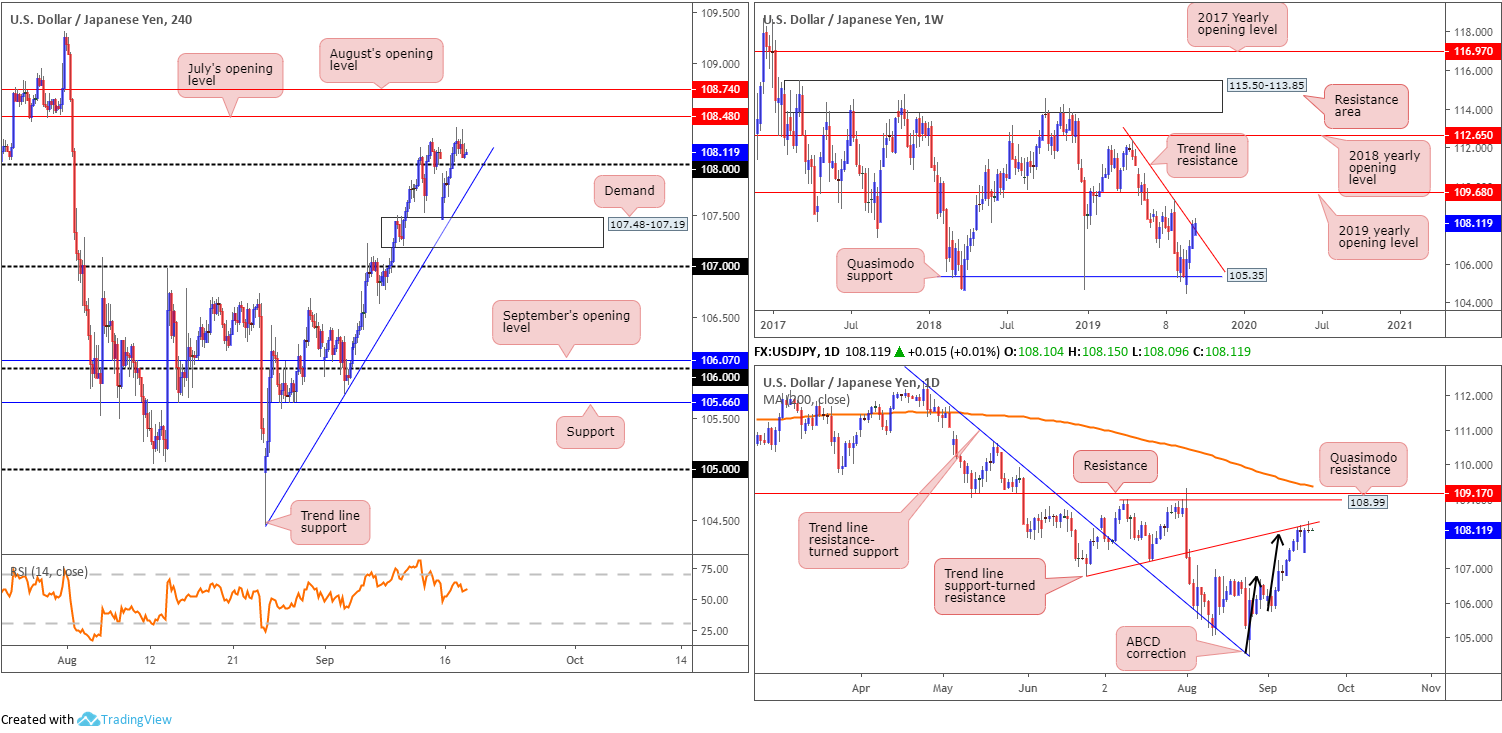
After journeying through orders at 108 Monday, the pair maintained some support, albeit emphasising a somewhat bearish tone – note two selling wicks at 108.36 and 108.35 on the H4 timeframe. July’s opening level at 108.48 is set as the next resistance point, closely trailed by August’s opening level at 108.74. It is also worth noting the steep trend line support (extended from the low 104.44).
Weekly flow remains interacting with a trend line resistance etched from the high 112.40, after staging a recovery from Quasimodo support at 105.35. Additional upside could see the 2019 yearly opening level at 109.68 brought into the mix.
The story on the daily timeframe has trade crossing swords with a trend line support-turned resistance (etched from the low 106.78) in the shape of an ABCD correction terminating at 108 (black arrows) and yesterday’s shooting star pattern.
Areas of consideration:
Since both weekly and daily timeframes show trend line resistances in motion, entering long at a retest off the 108/steep trend line support, despite likely being on the mind of many shorter-term traders, is incredibly chancy. In fact, should the higher-timeframe resistances hold ground, a break of the said H4 trend line support is expected, with a run to demand plotted at 107.48-107.19, followed by 107.
Sellers wishing to take advantage of this move lower, waiting for a retest at 108 to form is an option. Not only will this likely receive a better price, the retesting candlestick structure will provide clear entry and risk levels to work with.
USD/CAD:
USD/CAD prices wrapped up Tuesday unmoved, despite clocking a range of more than 65 points and highs at 1.33. Taking cues from crude as well as weak manufacturing data for July coming in at -1.3% M/M against an expected -0.2%, the pair tested an interesting area of resistance on the H4 timeframe and responded well.
For traders who read Tuesday’s report you may recall the following pieces:
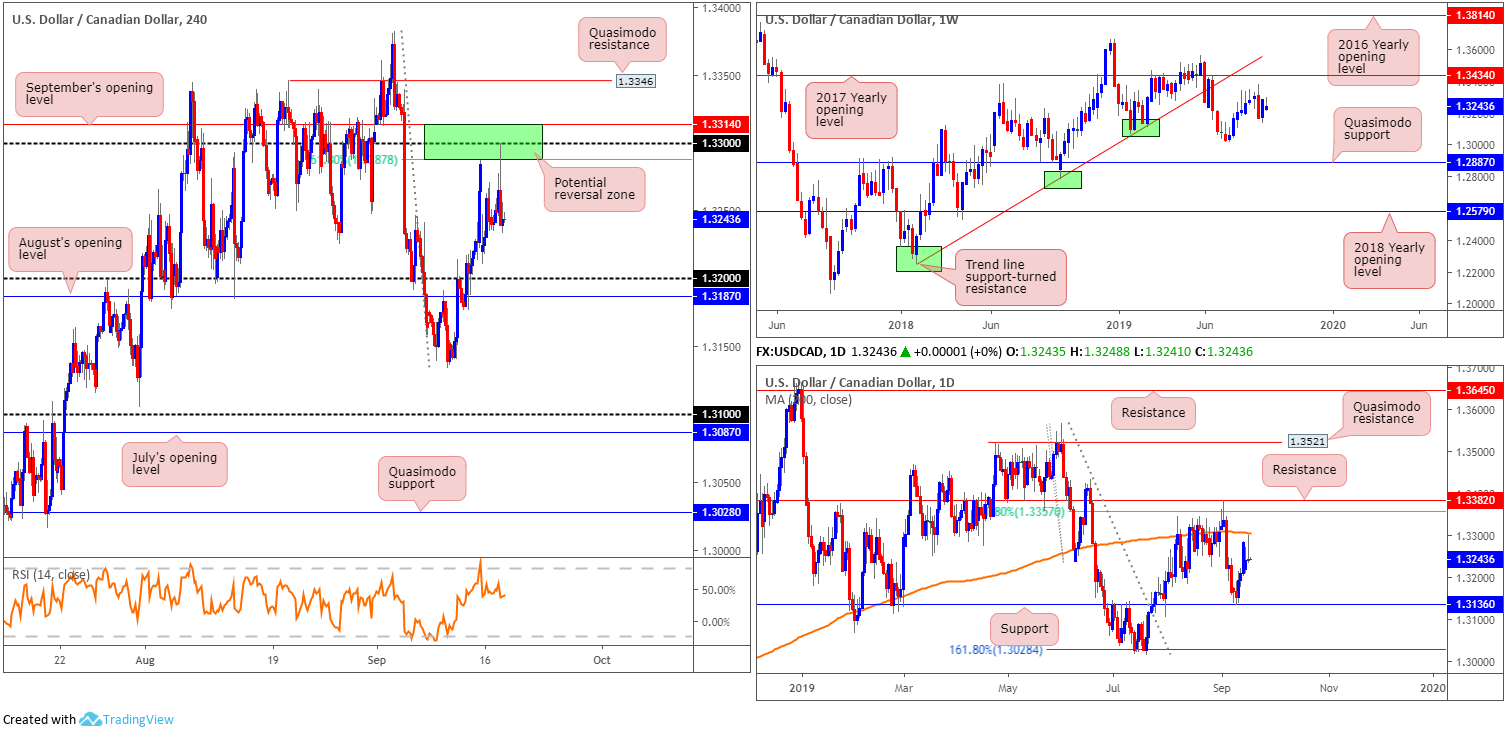
From a technical perspective, the H4 candles trade in no man’s land between 1.33/32 as we head into Asia Pac hours. Bolstering 1.33 we have a 61.8% Fibonacci ratio at 1.3287 and September’s opening level at 1.3314. Just south of 1.32, September’s opening level is seen at 1.3187.
From the weekly timeframe we can see USD/CAD bulls entered an offensive phase last week, consequently correcting a large portion of the prior week’s precipitous decline. Resistance on this timeframe is fixed at the 2017 yearly opening level drawn from 1.3434, closely trailed by a trend line support-turned resistance extended from the low 1.2247. To the downside, nonetheless, we have the 1.3016 July 15 low, followed by Quasimodo support at 1.2887.
Daily price saw the unit dip its toe into a familiar support at 1.3136 last week, which followed through with a bullish engulfing candle Wednesday with additional bidding observed. Resistance in the form of a 200-day SMA (orange) at 1.3307 is now in the offing, tracked by a 61.8% Fibonacci resistance at 1.3357 and resistance at 1.3382.
The research team’s outlook from Tuesday’s report:
The area between September’s opening level at 1.3314, the round number 1.33 and the 61.8% Fibonacci ratio at 1.3287 (1.3314/1.3287) remains a likely zone of interest for sellers this week – even more so knowing we have the 200-day SMA housed within. For traders looking to add a little more confirmation to the mix before engaging, consider waiting for candlestick confirmation to develop. For example, a H4 bearish engulfing formation moulded off the 1.33 handle not only identifies seller intent, it also delivers entry/risk levels to work with. As for downside targets, the 1.32 handle is a logical starting point, followed by August’s opening level at 1.3187.
Areas of consideration:
Although we did not really get much in terms of H4 candlestick confirmation, the 1.3314/1.3287 H4 resistance zone held firm. Well done to any of our readers who managed to catch this move. Going forward, as highlighted above, the next downside targets fall in at the 1.32 handle, followed by August’s opening level at 1.3187 and then daily support at 1.3136.
USD/CHF:
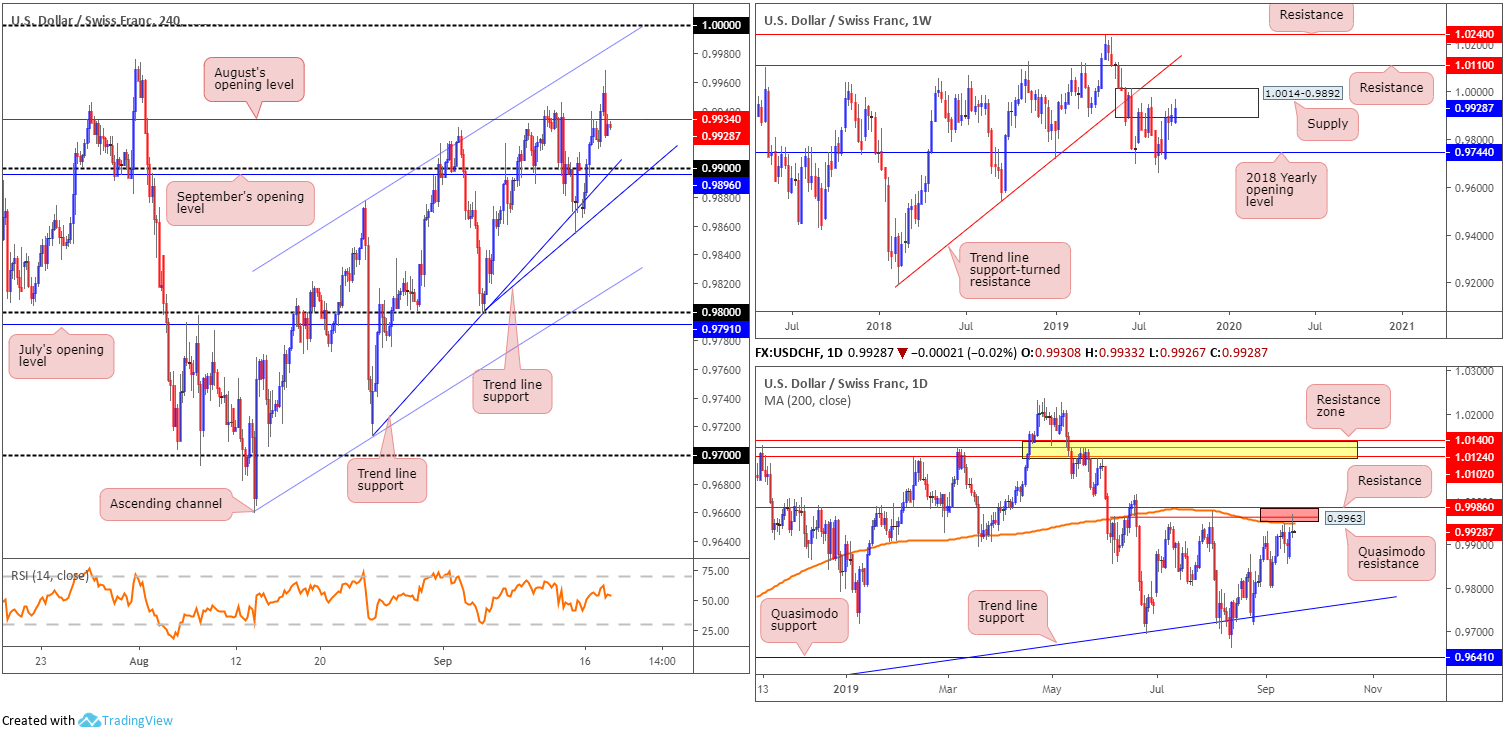
Kicking Wednesday off with a look at the weekly timeframe, we can see the pair remains toying with familiar supply coming in at 1.0014-0.9892. This is the second time back to the area, meaning it may struggle to hold price action lower. A rotation lower from here, nevertheless, has the 2018 yearly opening level at 0.9744 in sight. In the event buyers brush aside the said supply, resistance at 1.0110 is in view, as is long-term trend line support-turned resistance taken from the low 0.9187.
A closer reading of price action on the daily timeframe shows the unit shook hands with an interesting area of resistance yesterday at 0.9986/0.9953 (Quasimodo resistance at 0.9963, a 200-day SMA [orange – 0.9953] and resistance coming in from 0.9986 [red]).
Across the page on the H4 timeframe, price action whipsawed through August’s opening level at 0.9934 and refreshed multi-week tops around the 0.9868 region, before rotating lower and closing Tuesday unchanged. While both weekly and daily timeframes exhibit room to press lower, H4 supports are seen by way of the 0.99 handle, September’s opening level at 0.9896 and two trend line supports (extended from the lows 0.9713 and 0.9798).
Areas of consideration:
Entering long in this market is a weighty risk, considering where we’re coming from on the higher timeframes. With that being the case, focus shifts to potential shorting opportunities. A H4 close beyond 0.99 and the closely merging H4 trend line supports aired above is considered a strong gauge of seller intent. A retest of the trend line supports as resistance following the close lower is an ideal scenario, particularly if the retest occurs in the shape of a H4 bearish candlestick formation (entry and risk can then be set on the back of this pattern).
Dow Jones Industrial Average:
US equities wrapped up Tuesday with modest gains, a day ahead of the Federal Reserve policy meeting that’s expected to deliver a rate cut. The Dow Jones Industrial Average added 33.98 points, or 0.13%; the S&P 500 gained 7.72 points, or 0.26% and the tech-heavy Nasdaq 100 added 36.37 points, or 0.46%.
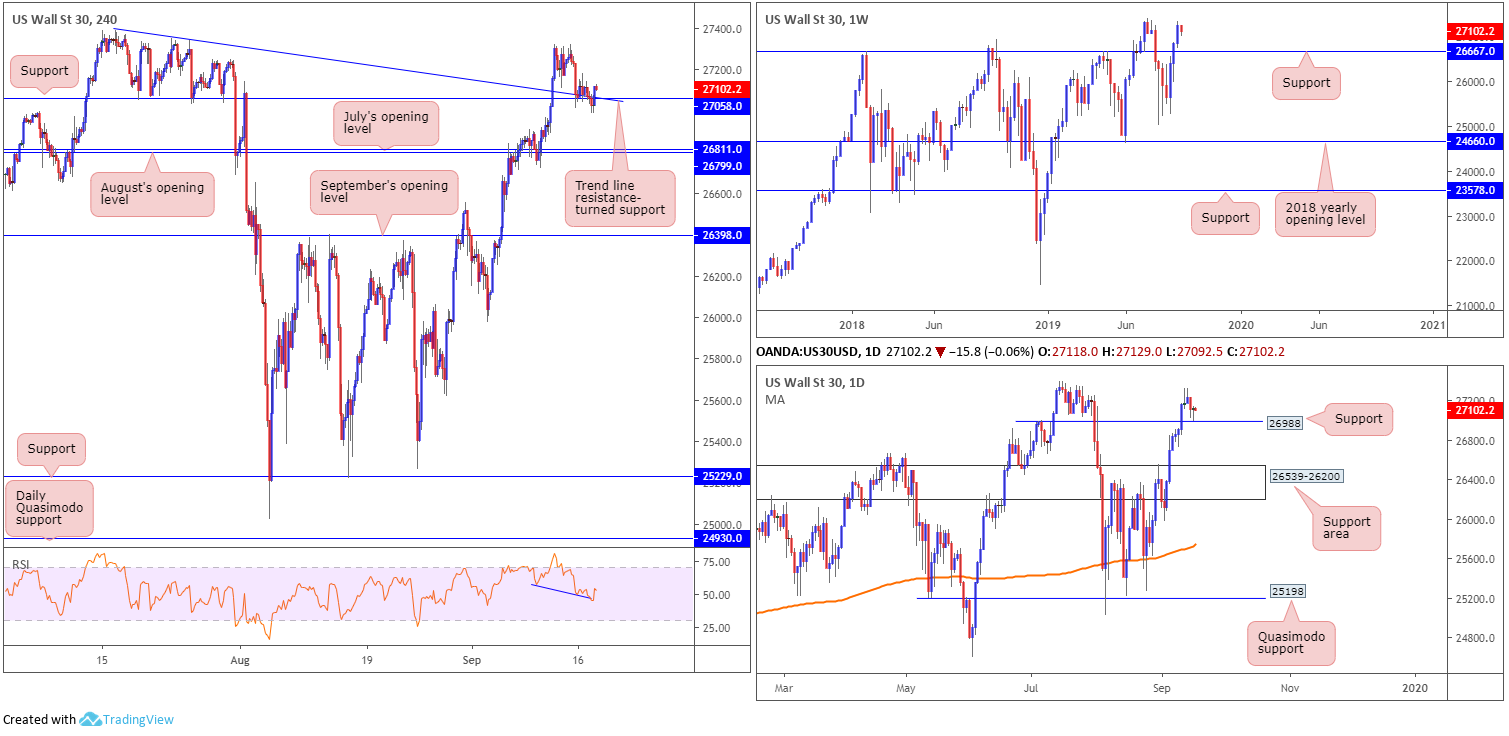
Technically, weekly price remains unchanged in terms of structure, though is a touch lower on the week. The index is holding reasonably strong north of support at 26667 and is currently sited a short walk from the all-time high 27388. Daily price, however, retested support at 26988 yesterday and fashioned an attractive hammer candlestick formation, considered a bullish signal. Continued buying has the all-time highs as its next target.
Things over on the H4 timeframe witnessed a deep retest at support drawn from 27058 and its merging trend line resistance-turned support (taken from the high 27388). In recent hours, a strong H4 bullish rotation candle emerged, confirmed by hidden divergence on the RSI indicator (blue line). This suggests further buying from this region is a real possibility, targeting tops set around 27321, followed by the all-time high mentioned above at 27388.
Areas of consideration:
On account of the above, longs remain in favour. An entry at current price with a protective stop-loss order set below 26987 is an option, thanks to the recently closed H4 bullish candle off support at 27058, and connecting daily support registered at 26988. Upside targets, as underlined above, fall in around H4 tops at 27321, followed by the all-time high set at 27388.
XAU/USD (GOLD):
Gold, in $ terms, struggled to find its rhythm Tuesday and remained limited within Monday’s range. Reports of Saudi Arabia’s crude oil production returning to normal levels within the next two to three weeks helped sentiment recover, diminishing demand for safe-haven assets, such as bullion.
Technically, the research team’s outlook aired in Tuesday’s report stands firm.
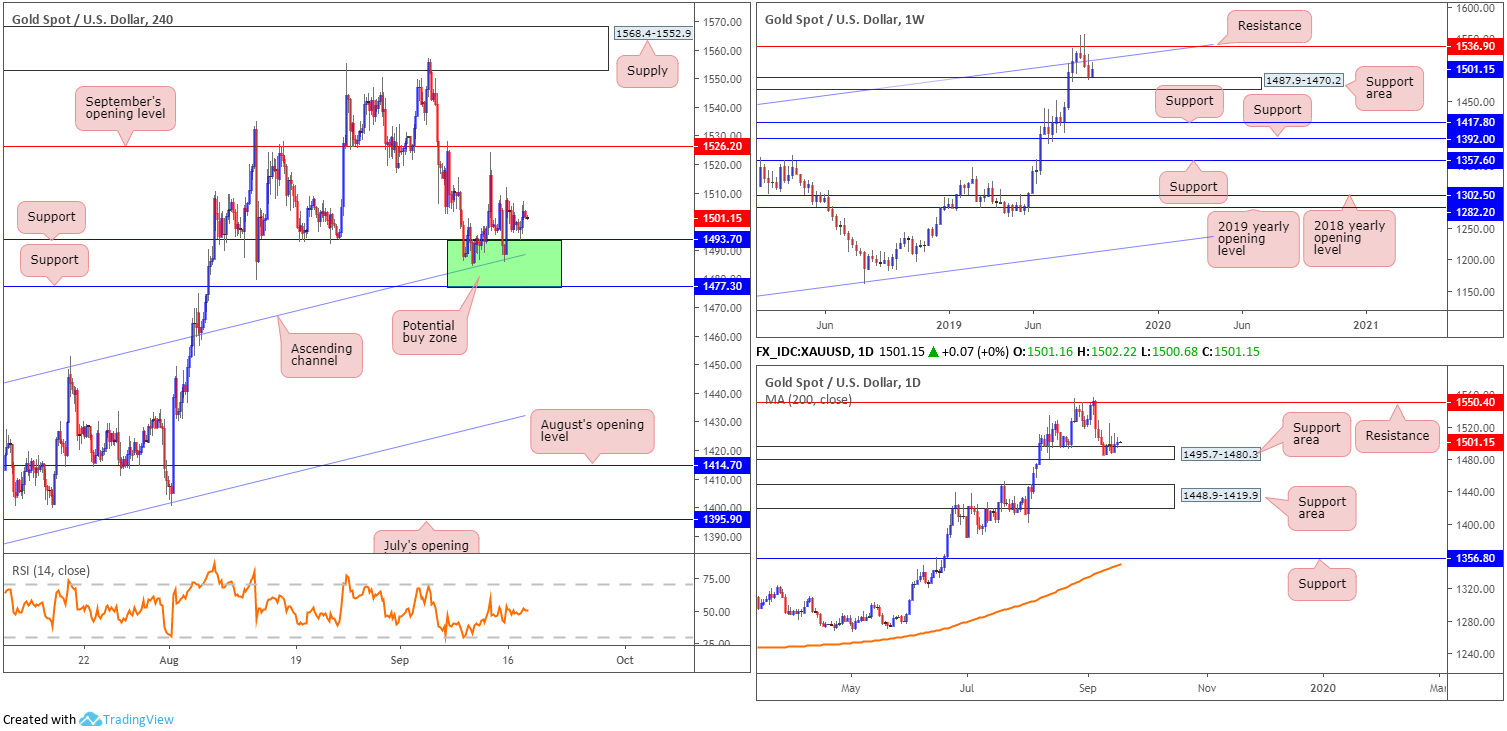
For those who read recent reports you may recall the research team highlighted a familiar area of H4 support marked in green at 1477.3/1493.7. Not only does it hold H4 channel support within (pencilled in from the high 1437.7), it merges with a daily support area coming in at 1495.7-1480.3, and the top edge of the weekly support area at 1487.9-1470.2. Note the H4 candles tested the top edge of the said H4 support zone yesterday, though failed to print anything meaningful to the upside.
Areas of consideration:
Considering the current market trend and the likelihood the retracement from highs 1555.3 is simply a pullback, the area of support stationed on the H4 timeframe between 1477.3/1493.7 remains an option for long opportunities.
Well done to any of our readers who have already managed an entry out of the said H4 zone. Concerning upside targets, September’s opening level at 1526.2 remains a logical starting point.
The accuracy, completeness and timeliness of the information contained on this site cannot be guaranteed. IC Markets does not warranty, guarantee or make any representations, or assume any liability regarding financial results based on the use of the information in the site.
News, views, opinions, recommendations and other information obtained from sources outside of www.icmarkets.com.au, used in this site are believed to be reliable, but we cannot guarantee their accuracy or completeness. All such information is subject to change at any time without notice. IC Markets assumes no responsibility for the content of any linked site.
The fact that such links may exist does not indicate approval or endorsement of any material contained on any linked site. IC Markets is not liable for any harm caused by the transmission, through accessing the services or information on this site, of a computer virus, or other computer code or programming device that might be used to access, delete, damage, disable, disrupt or otherwise impede in any manner, the operation of the site or of any user’s software, hardware, data or property.


