
DXY:
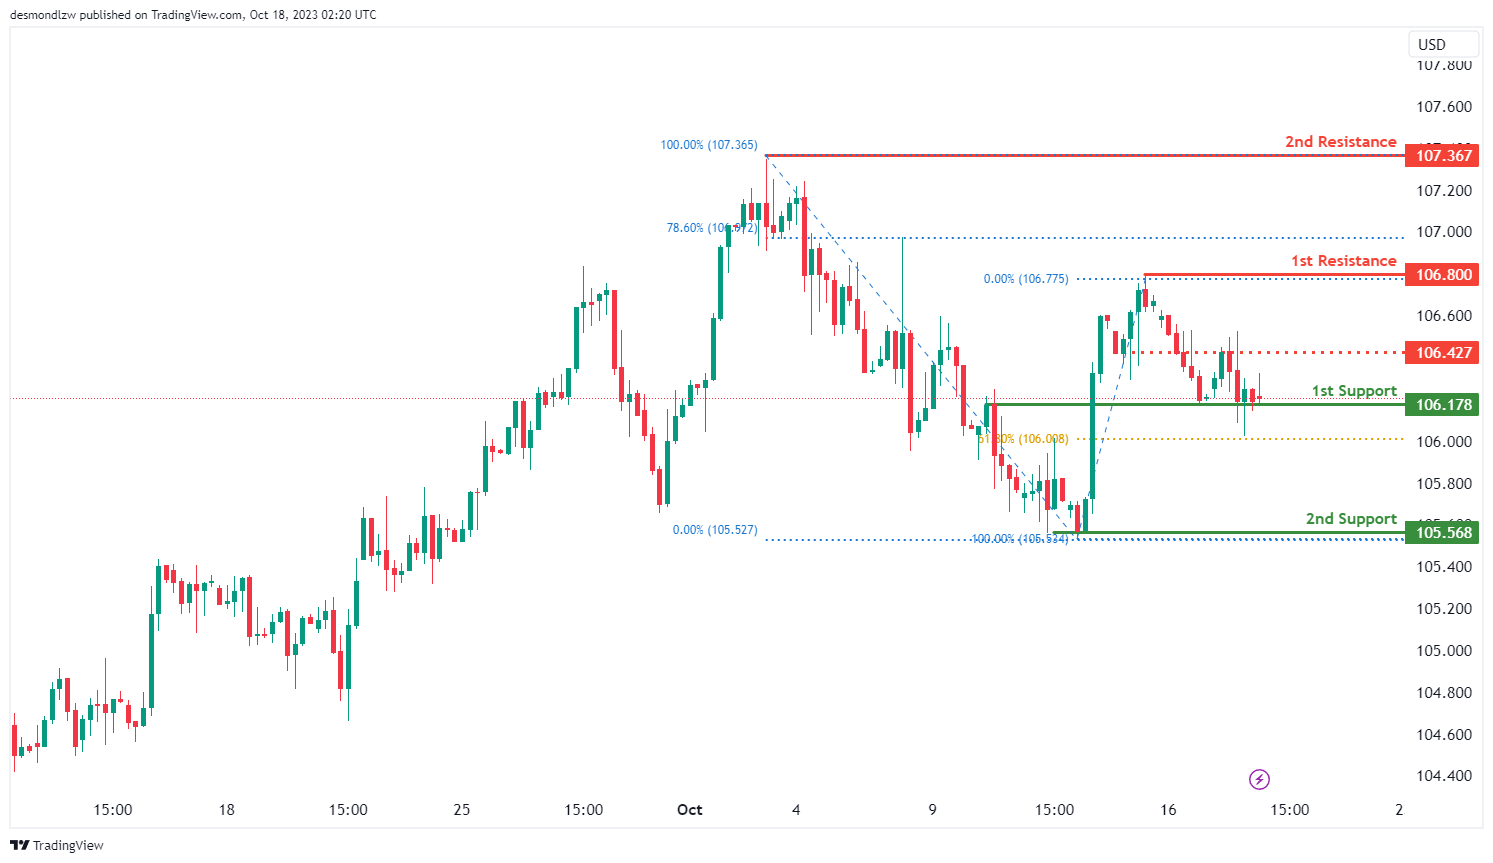
The DXY chart currently exhibits bearish momentum, with the potential scenario of a bearish break below the 1st support level, targeting the 2nd support level.
The 1st support at 106.01 is considered significant as it aligns with an overlap support and the 61.80% Fibonacci Retracement level. Additionally, the 2nd support at 105.56 is identified as a multi-swing low support, providing a potentially strong level of support.
On the resistance side, the 1st resistance at 106.80 is characterized as a swing high resistance level. Beyond this, the 2nd resistance at 107.36 is also noted as a swing high resistance, while an intermediate resistance at 106.42 is identified as an overlap resistance.
EUR/USD:
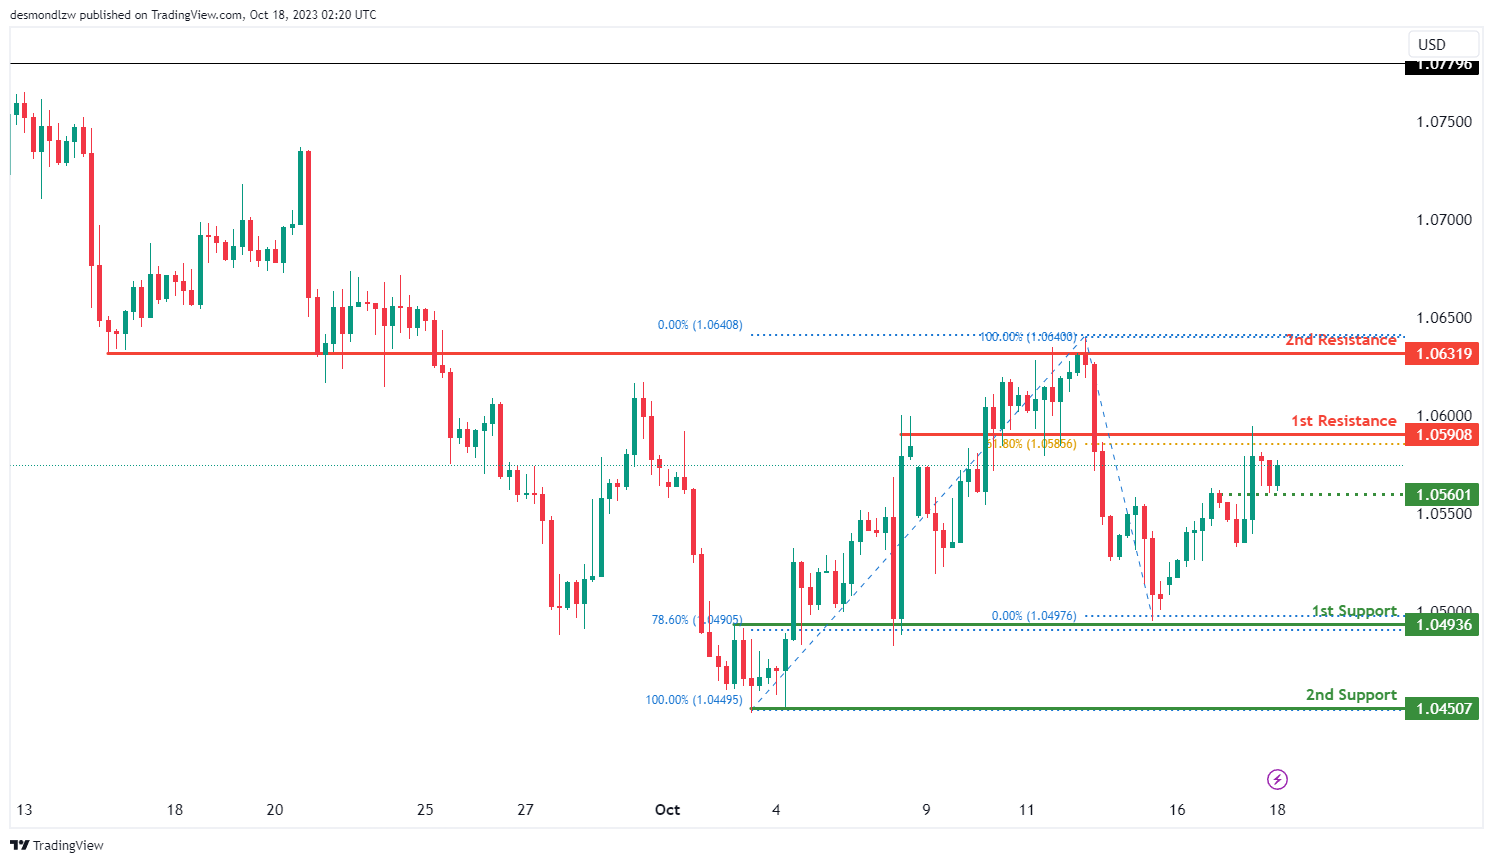
The EUR/USD chart currently displays bearish momentum, suggesting a potential scenario of a bearish reaction off the 1st resistance level, targeting the 1st support level.
The 1st support at 1.0493 is considered significant as it aligns with an overlap support and the 78.60% Fibonacci Retracement level. Additionally, the 2nd support at 1.0450 is identified as a swing low support.
On the resistance side, the 1st resistance at 1.0590 is characterized as an overlap resistance and is also associated with the 61.80% Fibonacci Retracement level. Beyond this, the 2nd resistance at 1.0631 is identified as an overlap resistance.
EUR/JPY:
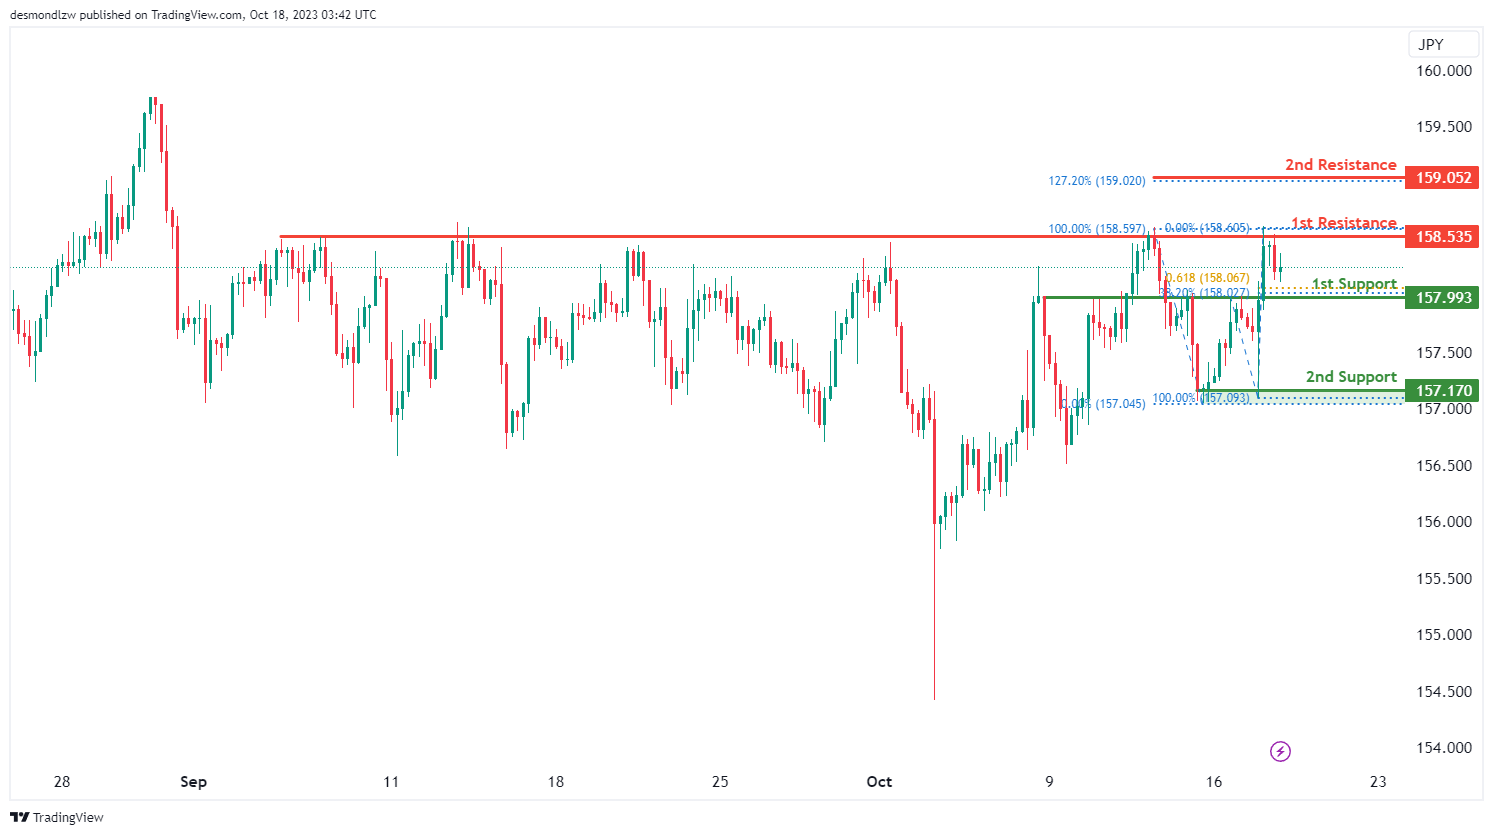
The instrument being analyzed is EUR/JPY, and the current overall momentum of its chart is bearish.
There is a potential scenario where the price could make a bearish continuation towards the 1st support level, which is at 157.99.
The 1st support at 157.99 is considered significant because it represents a pullback support. This level aligns with a 38.20% Fibonacci Retracement and a 61.80% Fibonacci Projection, indicating a Fibonacci confluence, which suggests that it may act as a strong level of price support.
In addition, there is a 2nd support level at 157.17, which is valuable because it functions as an overlap support and corresponds to a 50% Fibonacci Retracement, further enhancing its significance in the analysis.
On the resistance side, the 1st resistance level at 158.53 is considered important because it represents a multi-swing high resistance. This level may act as a barrier to further price increases.
Moreover, there is a 2nd resistance level at 159.05, which is significant as it corresponds to a 127.20% Fibonacci Extension. This level could potentially hinder the price from moving higher, contributing to the overall bearish outlook for EUR/JPY.
EUR/GBP:
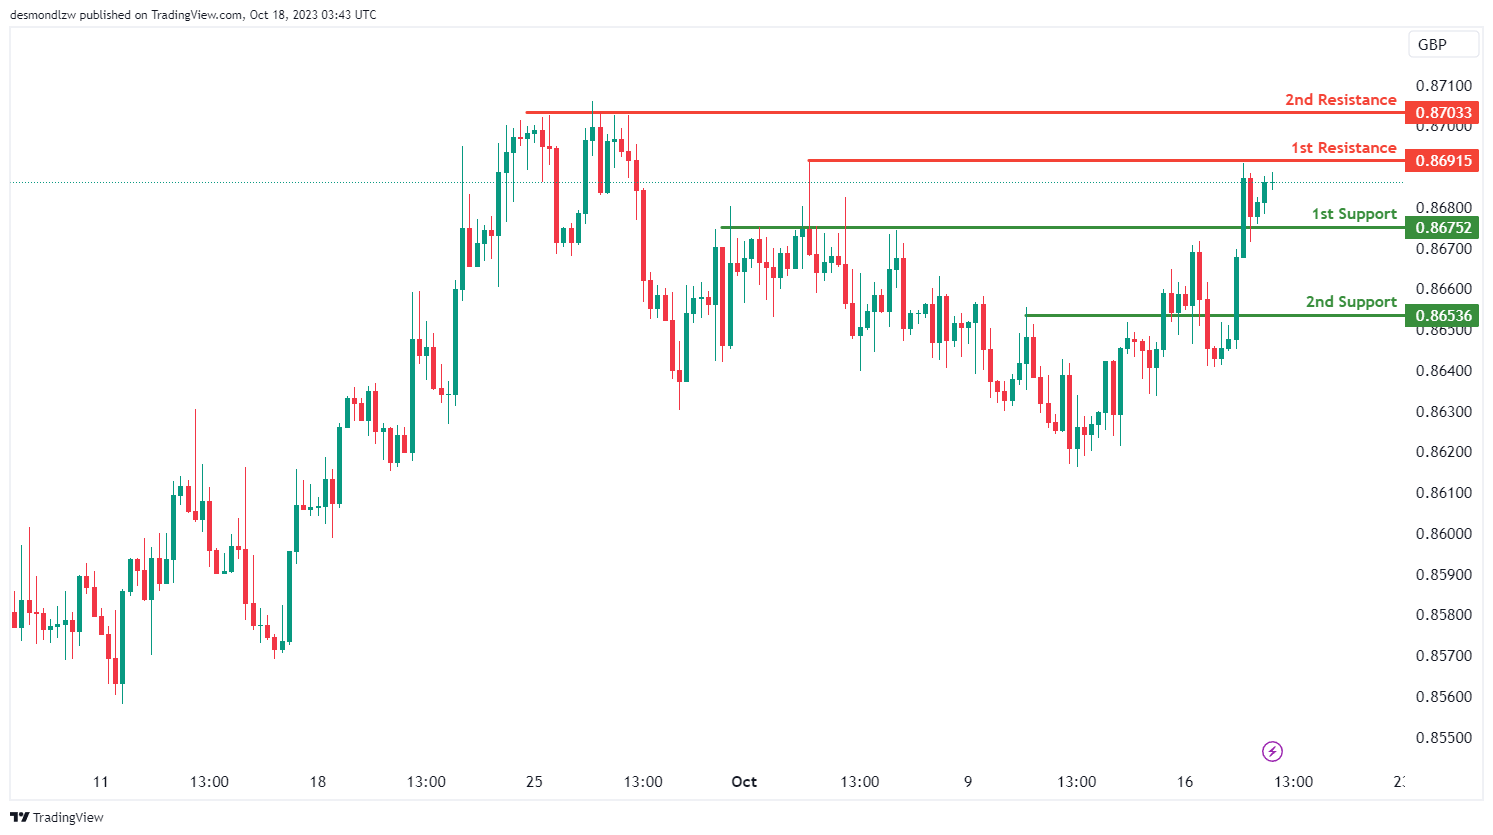
The instrument being analyzed is EUR/GBP, and the current overall momentum of its chart is bullish.
There is a potential scenario where the price could make a bullish continuation towards the 1st resistance level, which is at 0.8691.
The 1st support at 0.8675 is considered significant because it acts as an overlap support, indicating a level where price may find support during any potential pullbacks.
Additionally, there is a 2nd support level at 0.8653, which is valuable as it represents a pullback support. This level provides an additional layer of potential support.
On the resistance side, the 1st resistance level at 0.8691 is considered important because it represents a multi-swing high resistance. This level may act as a barrier to further price increases.
Moreover, there is a 2nd resistance level at 0.8703, which is also significant as it represents another multi-swing high resistance. These resistance levels suggest potential areas where price might encounter selling pressure, contributing to the overall bullish outlook for EUR/GBP.
.
GBP/USD:
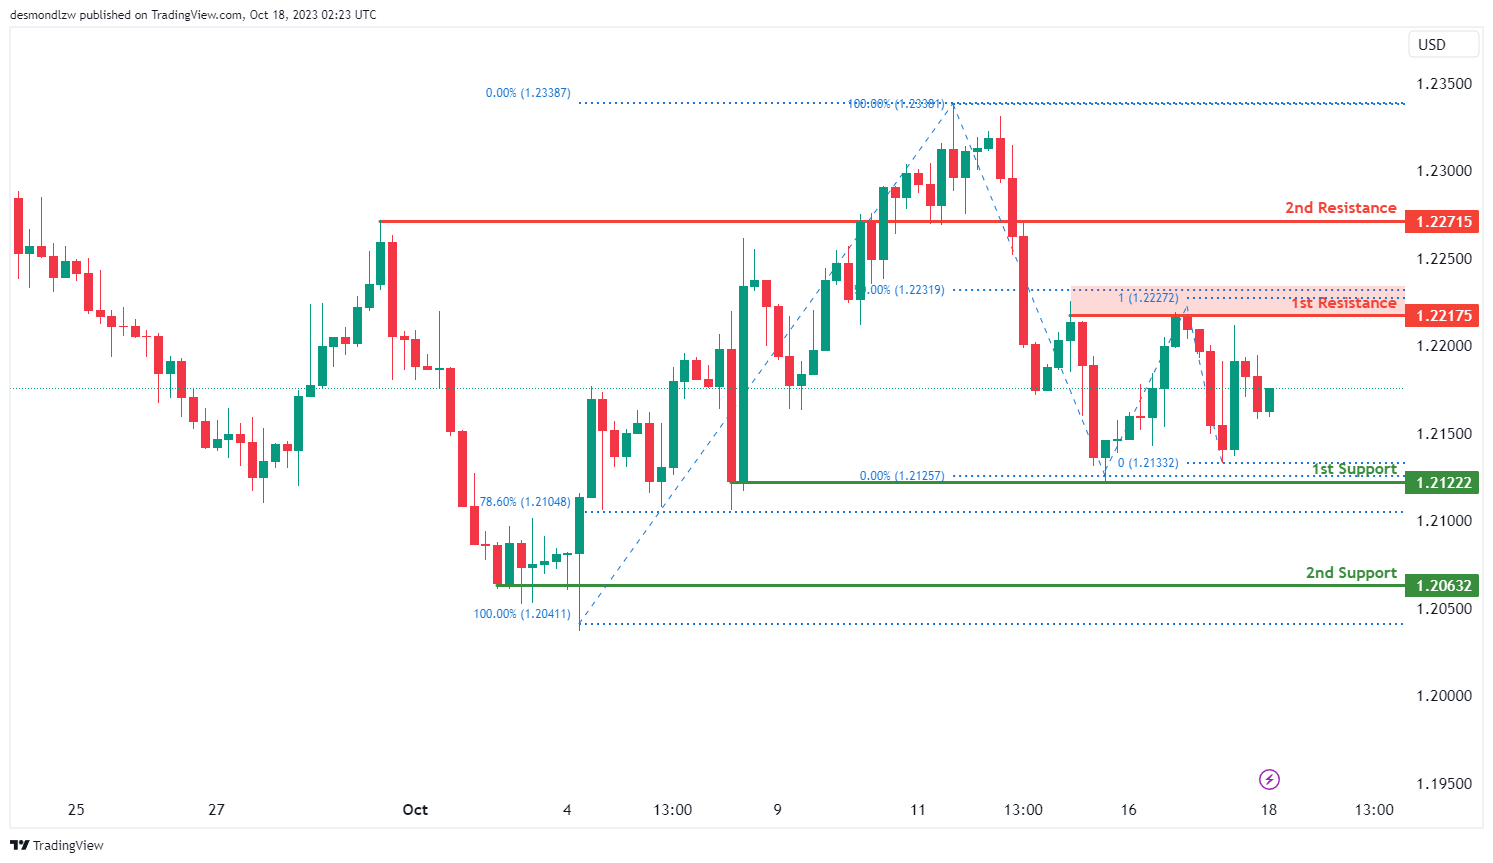
The GBP/USD chart currently exhibits neutral momentum, suggesting a potential scenario of price fluctuating between the 1st resistance and 1st support levels.
The 1st support at 1.2122 is considered significant as it aligns with a multi-swing low support and the 78.60% Fibonacci Retracement level. Additionally, the 2nd support at 1.2063 is identified as a multi-swing low support.
On the resistance side, the 1st resistance at 1.2217 is characterized as a multi-swing high resistance level, and it’s noteworthy that it coincides with both the 50% Fibonacci Retracement and the 100% Fibonacci Projection, indicating a Fibonacci confluence. Beyond this, the 2nd resistance at 1.2271 is identified as an overlap resistance.
GBP/JPY:
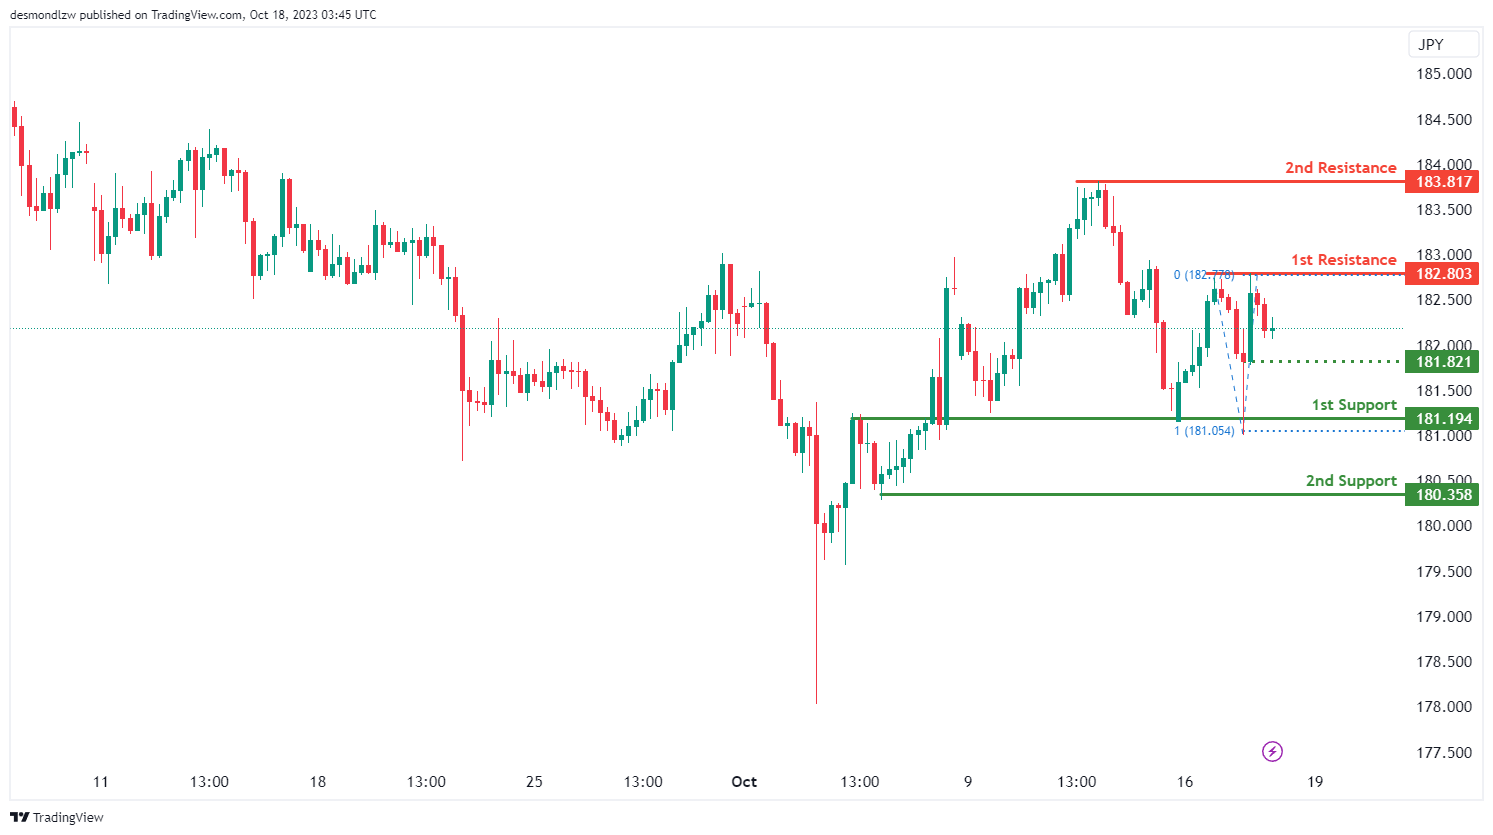
The instrument being analyzed is GBP/JPY, and the current overall momentum of its chart is bearish.
There is a potential scenario where the price could make a bearish continuation towards the 1st support level, which is at 181.19.
The 1st support at 181.19 is considered significant because it represents an overlap support and aligns with a 100% Fibonacci Projection, indicating strong potential support at this level.
Additionally, there is a 2nd support level at 180.35, which is valuable as it functions as a swing low support, providing an additional layer of potential support.
On the resistance side, the 1st resistance level at 182.80 is considered important because it represents a multi-swing high resistance. This level may act as a barrier to further price increases.
Furthermore, there is a 2nd resistance level at 183.81, which is significant as it represents a swing high resistance. These resistance levels suggest potential areas where price might encounter selling pressure, contributing to the overall bearish outlook for GBP/JPY.
Additionally, there is an intermediate support level at 181.82, which is a swing low support, providing an additional potential support area in the analysis.
USD/CHF:
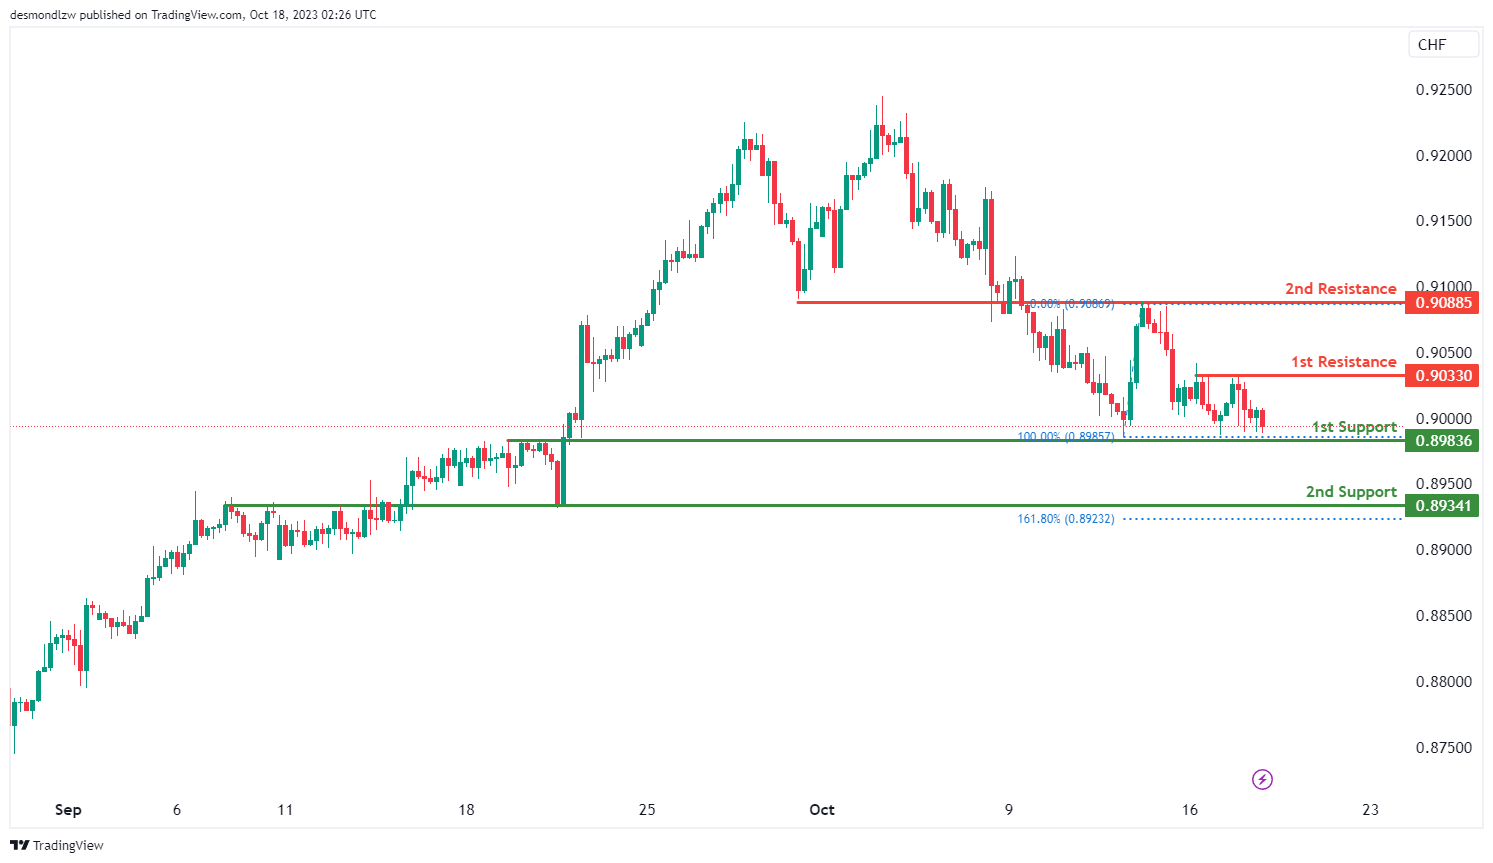
The USD/CHF chart currently exhibits a neutral momentum, suggesting a potential scenario of price fluctuating between the 1st resistance and 1st support levels.
The 1st support at 0.8983 is considered significant as it aligns with an overlap support. Additionally, the 2nd support at 0.8934 is identified as an overlap support and coincides with the 161.80% Fibonacci Retracement level, providing a strong foundation of potential support.
On the resistance side, the 1st resistance at 0.9033 is characterized as a multi-swing high resistance level. Beyond this, the 2nd resistance at 0.9088 is identified as an overlap resistance.
USD/JPY:
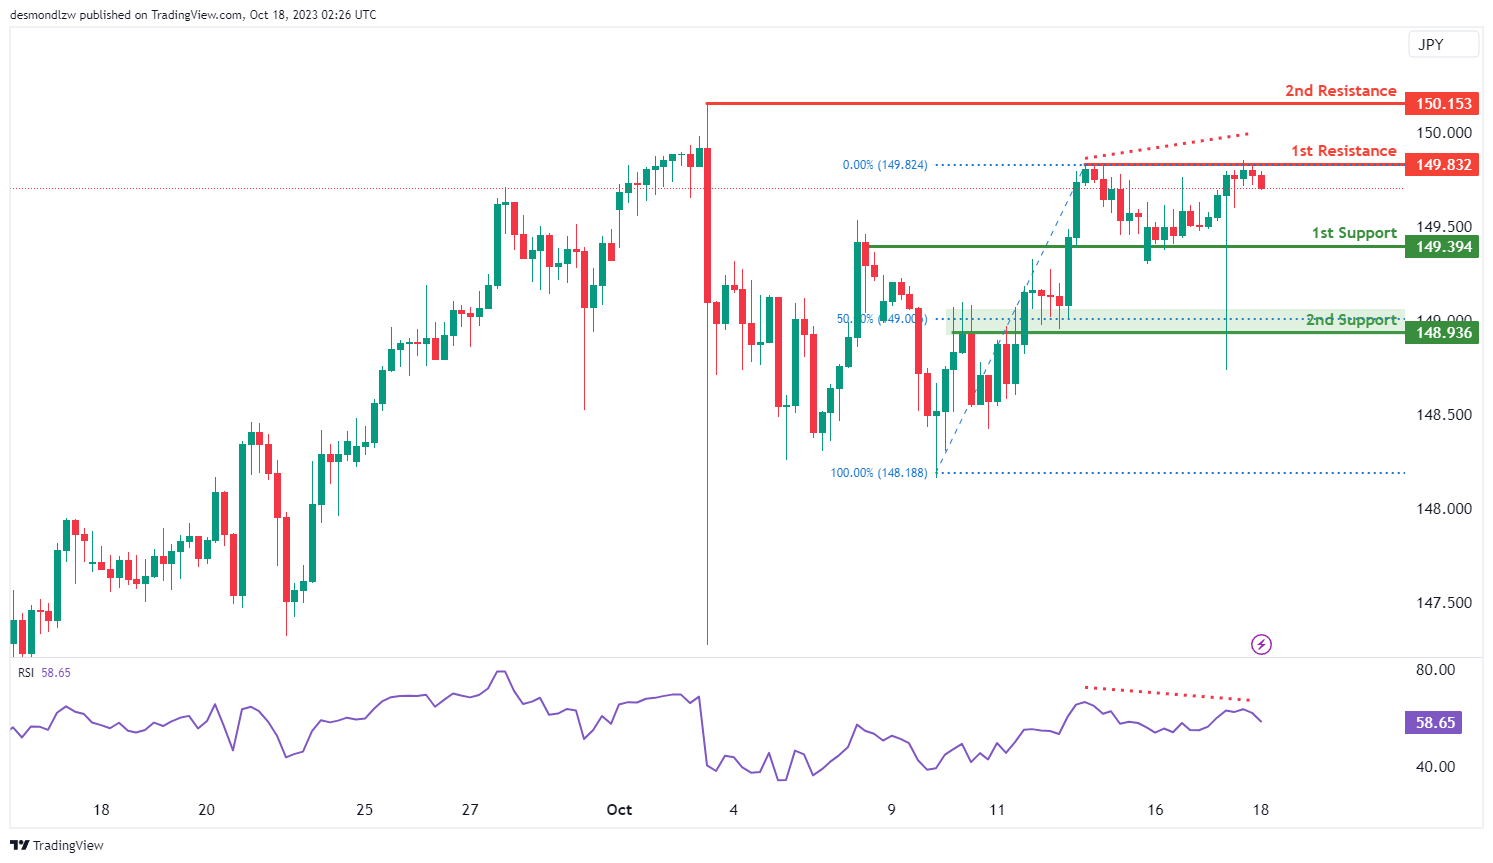
The USD/JPY chart currently exhibits bearish momentum, suggesting a potential scenario of a bearish reaction off the 1st resistance level and a drop towards the 1st support level.
The 1st support at 149.39 is considered significant as it aligns with an overlap support. Additionally, the 2nd support at 148.93 is identified as an overlap support and coincides with the 50% Fibonacci Retracement level, providing a strong foundation of potential support.
On the resistance side, the 1st resistance at 149.83 is characterized as a multi-swing high resistance level, and beyond this, the 2nd resistance at 150.15 is identified as a swing high resistance.
It’s worth noting that the RSI (Relative Strength Index) is also displaying bearish divergence versus price, suggesting that a reversal might occur soon. This divergence could further support the potential for a bearish reaction off the 1st resistance.
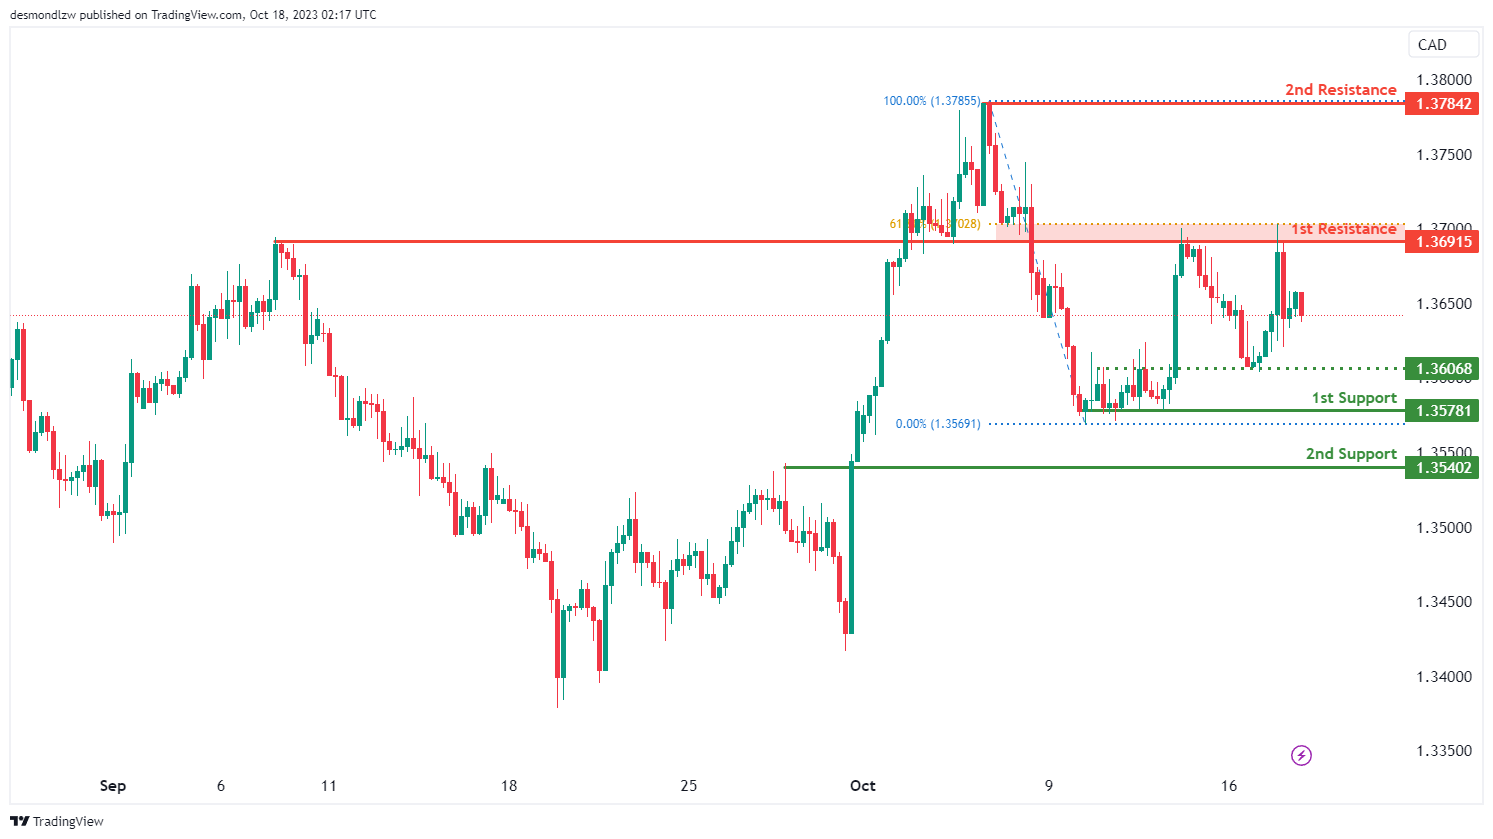
USD/CAD:
The USD/CAD chart currently exhibits a neutral momentum, suggesting a potential scenario for price to fluctuate between the 1st resistance and the 1st support levels.
The intermediate support level at 1.3607 is identified as an overlap support while the 1st support level at 1.3578 is marked as a pullback support. Additionally, the 2nd support level at 1.3540 is also noted as a pullback support, adding to its significance as a potential support zone.
To the upside, the 1st resistance level at 1.3692 is identified as an overlap resistance that aligns close to the 61.80% Fibonacci retracement level. Higher up, the 2nd resistance level at 1.3784 is noted as a swing-high resistance, potentially acting as a barrier to further bullish advances.
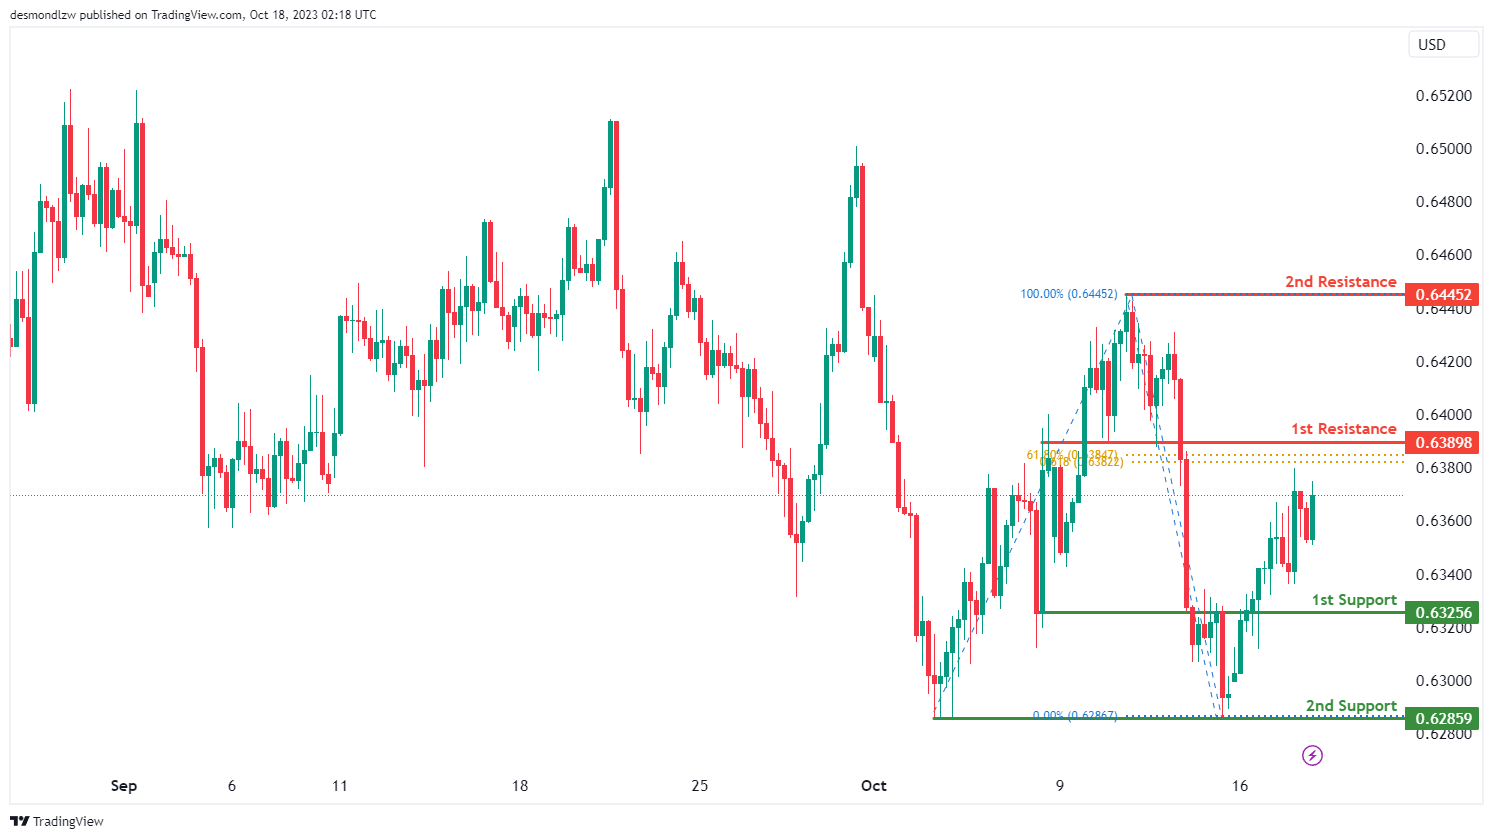
AUD/USD:
The AUD/USD chart currently exhibits a bullish momentum, indicating a potential scenario for price to make a bullish continuation towards the 1st resistance level.
The 1st resistance level at 0.6389 is identified as an overlap resistance that aligns with a confluence of Fibonacci levels i.e. the 61.80% retracement and the 61.80% projection levels. Beyond this, the 2nd resistance level at 0.6445 is noted as a swing-high resistance, making it a potentially strong resistance level.
To the downside, the 1st support level at 0.6326 is noted as an overlap support. Additionally, the 2nd support level at 0.6286 is marked as a multi-swing-low support, further reinforcing its importance as a potential support area.
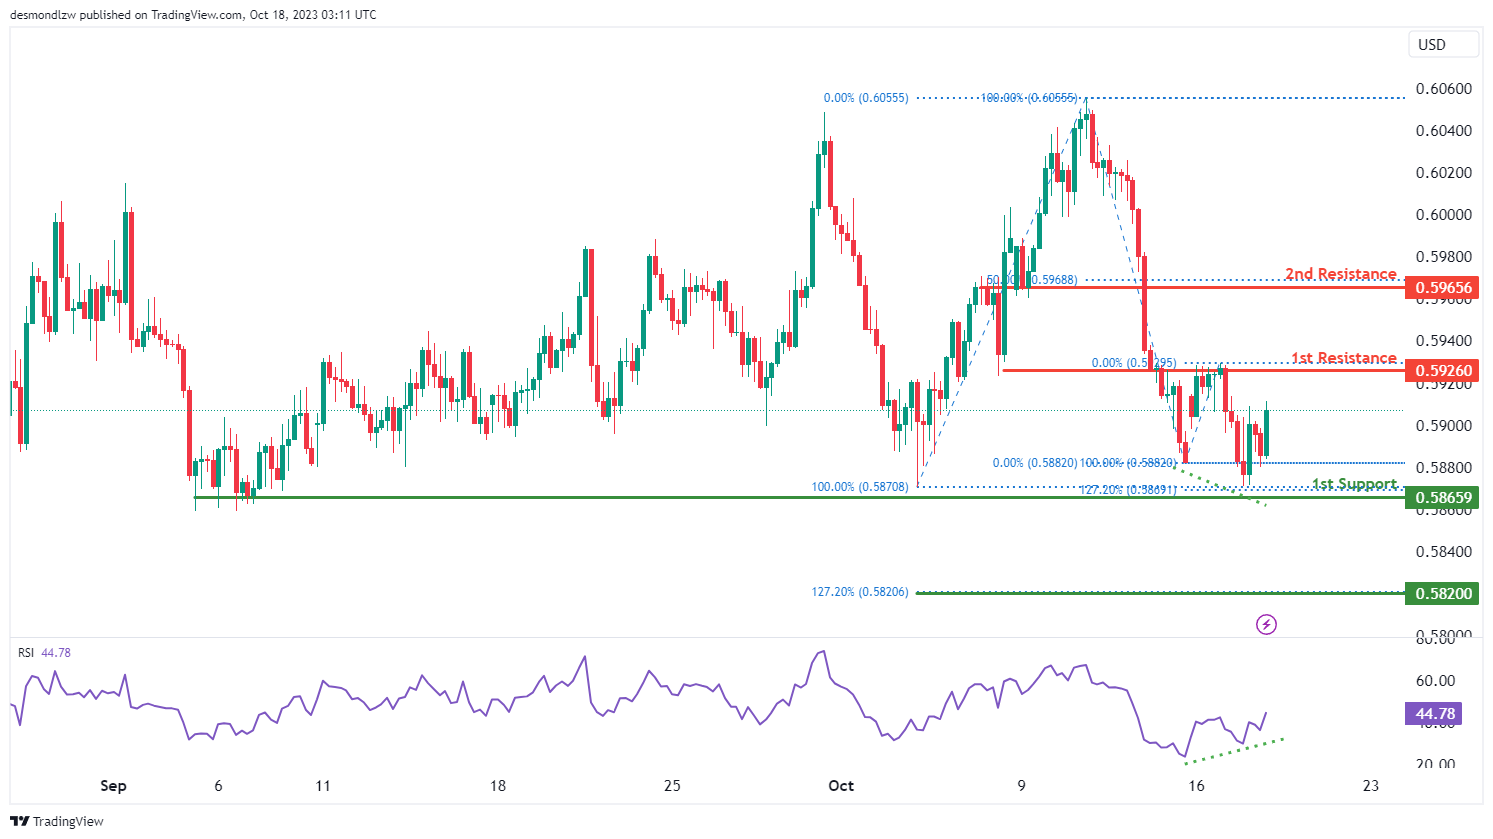
NZD/USD
The NZD/USD chart currently exhibits a neutral momentum, suggesting a potential scenario for price to fluctuate between the 1st resistance and the 1st support levels. However, the Relative Strength Index (RSI) is displaying a bullish divergence versus price. This divergence suggests that there is a potential scenario for price to rise towards the 1st resistance level.
The 1st resistance level at 0.5926 is identified as an overlap resistance. Beyond this, the 2nd resistance level at 0.5966 is also marked as an overlap resistance that aligns with the 50.00% Fibonacci retracement level, making it a potentially strong resistance level.
To the downside, the 1st support level at 0.5866 is identified as pullback support that aligns close to the 127.20% Fibonacci extension level. Further below, the 2nd support level at 0.5820 is noted as a support level that aligns with the 161.80% Fibonacci extension level, indicating a potential support zone.
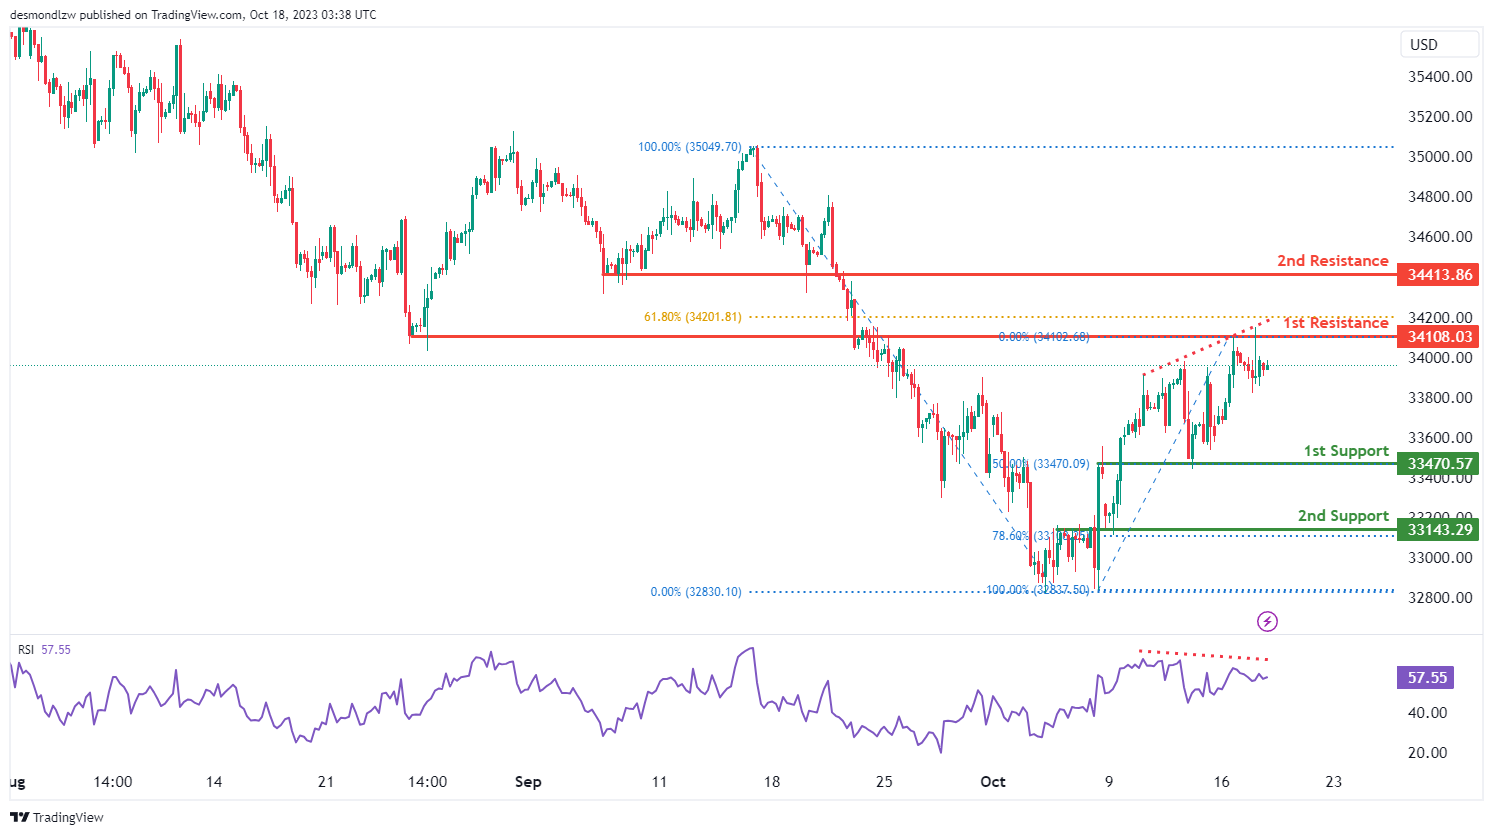
DJ30:
The instrument being analyzed is DJ30 (Dow Jones 30), and the current overall momentum of its chart is bearish.
There is a potential scenario where the price could make a bearish continuation towards the 1st support level, which is at 33470.57.
The 1st support at 33470.57 is considered significant because it acts as an overlap support and corresponds to a 50% Fibonacci Retracement level, providing a potential level of price support.
In addition, there is a 2nd support level at 33143.29, which is also valuable as it functions as an overlap support and aligns with a 78.60% Fibonacci Retracement, further enhancing its significance in the analysis.
On the resistance side, the 1st resistance level at 34108.03 is considered important because it represents an overlap resistance and aligns with a 61.80% Fibonacci Retracement, indicating that it might act as a barrier to further price increases.
Moreover, there is a 2nd resistance level at 34413.86, which is significant as it represents a pullback resistance. This level could potentially hinder the price from moving higher, contributing to the overall bearish outlook.
Additionally, you’ve mentioned that the RSI (Relative Strength Index) is displaying bearish divergence versus price, indicating the likelihood of a rapid decline in price. This divergence in RSI suggests a potential weakness in the bullish momentum, further supporting the bearish outlook for the DJ30.
GER40:
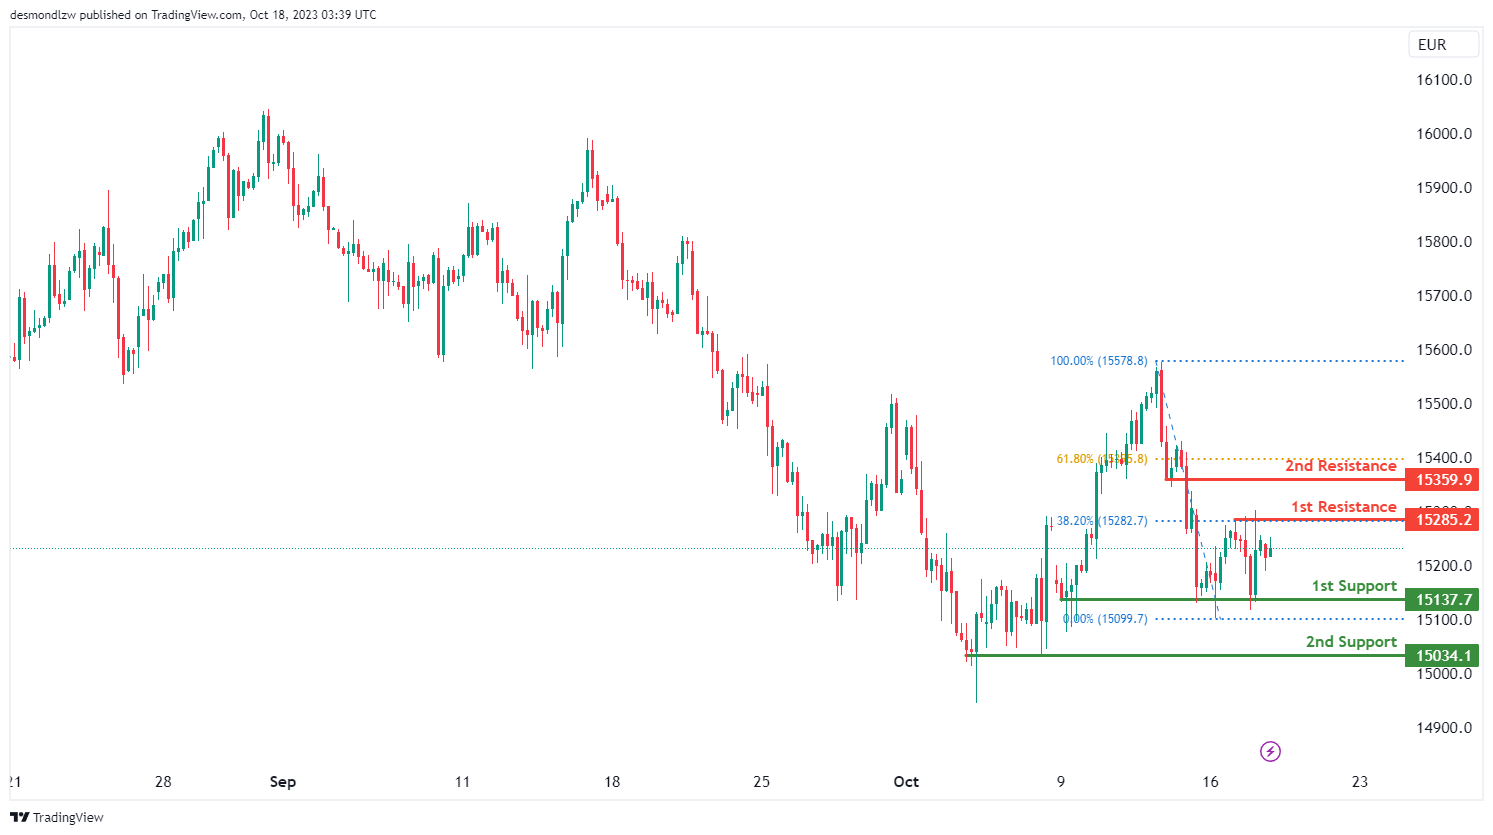
The instrument being analyzed is GER40 (Germany 40), and the current overall momentum of its chart is bearish.
There is a potential scenario where the price could make a bearish continuation towards the 1st support level, which is at 15137.70.
The 1st support at 15137.70 is considered significant because it represents a multi-swing low support, and it aligns with a 78.60% Fibonacci Retracement level. This level provides a potential area of price support.
Additionally, there is a 2nd support level at 15034.10, which is valuable because it also acts as a multi-swing low support. While this level is not associated with a specific Fibonacci level, it adds to the potential support zones in the chart.
On the resistance side, the 1st resistance level at 15285.20 is considered important because it represents a multi-swing high resistance. This level aligns with a 38.20% Fibonacci Retracement, suggesting it might act as a barrier to further price increases.
Moreover, there is a 2nd resistance level at 15359.90, which is significant as it represents a pullback resistance. This level aligns with a 61.80% Fibonacci Retracement, indicating that it could potentially hinder the price from moving higher, contributing to the overall bearish outlook for GER40.
`US500
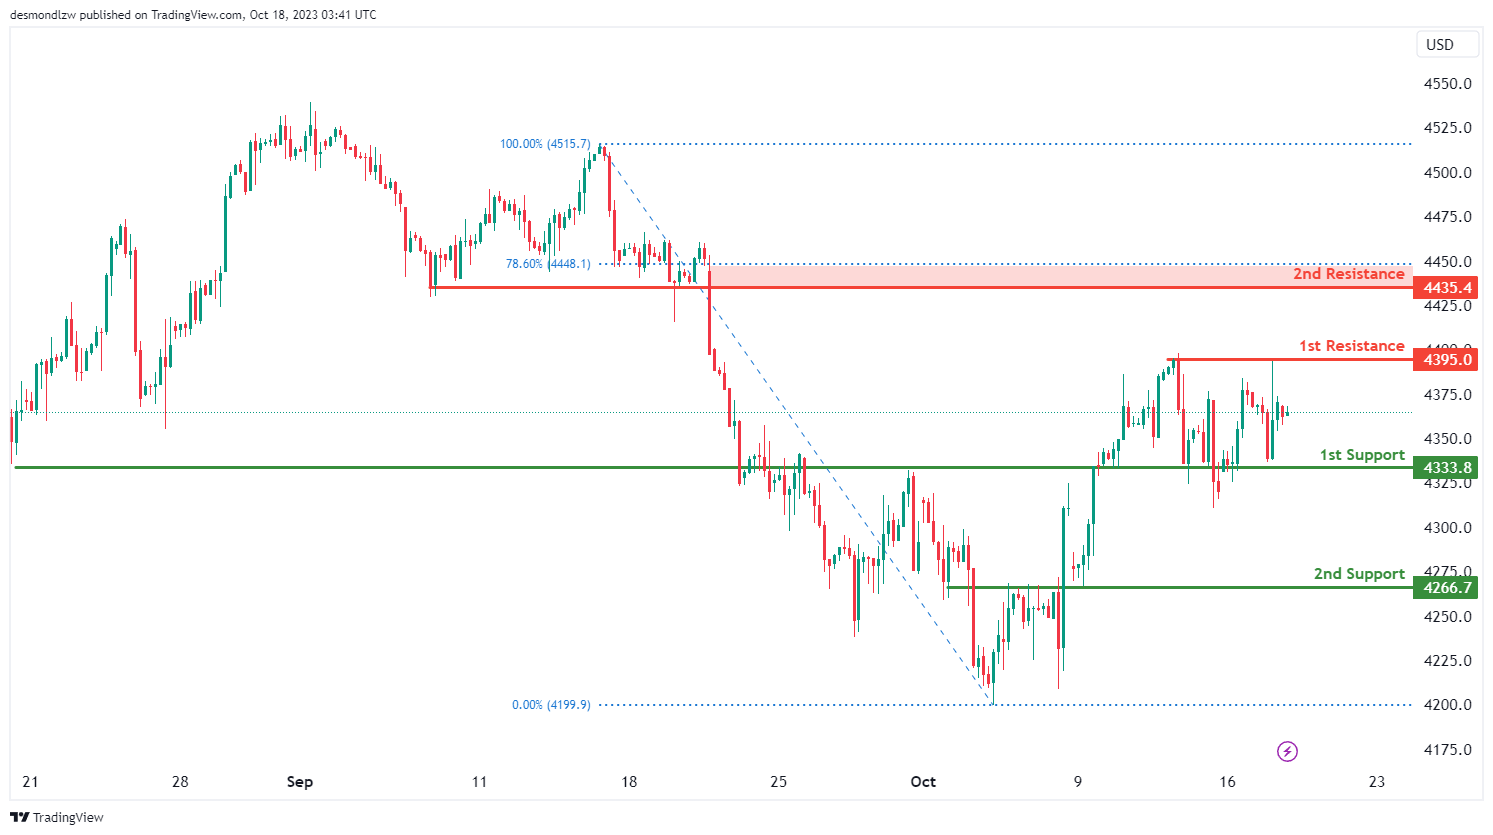
The instrument being analyzed is US500 (S&P 500), and the current overall momentum of its chart is bearish.
There is a potential scenario where the price could make a bearish continuation towards the 1st support level, which is at 4333.8.
The 1st support at 4333.8 is considered significant because it functions as an overlap support, providing a potential level of price support.
Additionally, there is a 2nd support level at 4266.7, which is also valuable because it acts as an overlap support. While this level is not associated with a specific Fibonacci level, it adds to the potential support zones in the chart.
On the resistance side, the 1st resistance level at 4395.0 is considered important because it represents a multi-swing high resistance. This level may act as a barrier to further price increases.
Moreover, there is a 2nd resistance level at 4435.4, which is significant as it represents a pullback resistance. This level aligns with a 78.60% Fibonacci Retracement, indicating that it could potentially hinder the price from moving higher, contributing to the overall bearish outlook for US500.
BTC/USD:
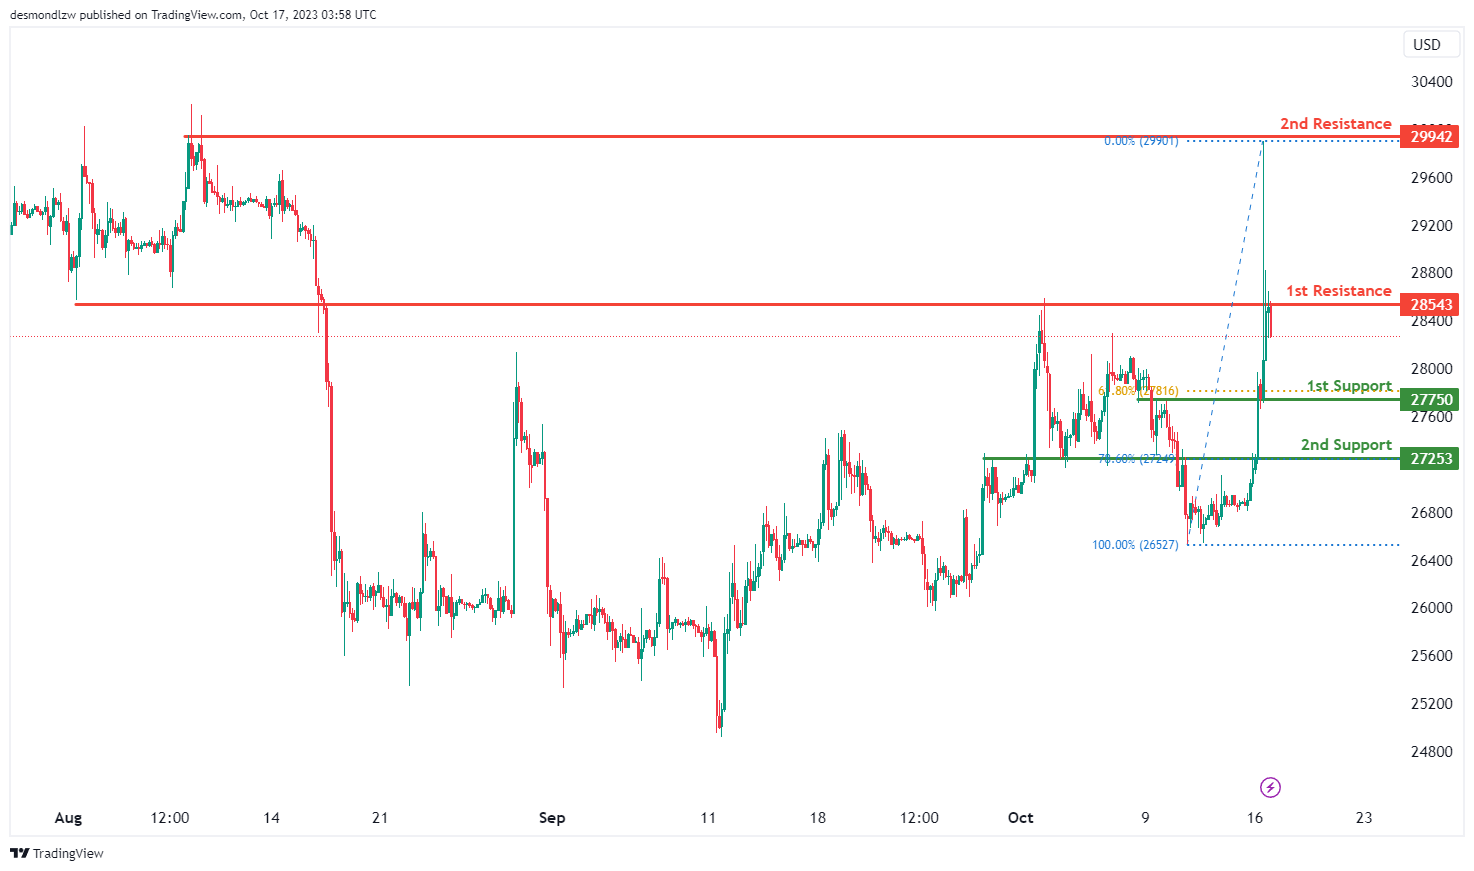
The instrument being analyzed is BTC/USD, and the current overall momentum of its chart is bearish.
There is a potential scenario where the price could make a bearish reaction off the 1st resistance level, which is at 28573, and drop to the 1st support level at 27750.
The 1st support at 27750 is considered significant because it acts as an overlap support and corresponds to a 61.80% Fibonacci Retracement level, providing a potential level of price support.
Additionally, there is a 2nd support level at 27253, which is also valuable because it functions as a pullback support and aligns with a 78.60% Fibonacci Retracement, further enhancing its significance in the analysis.
On the resistance side, the 1st resistance level at 28573 is considered important because it represents an overlap resistance, and this level may act as a barrier to further price increases.
Moreover, there is a 2nd resistance level at 29942, which is significant as it represents a multi-swing high resistance. This level could potentially hinder the price from moving higher, contributing to the overall bearish outlook.
ETH/USD:
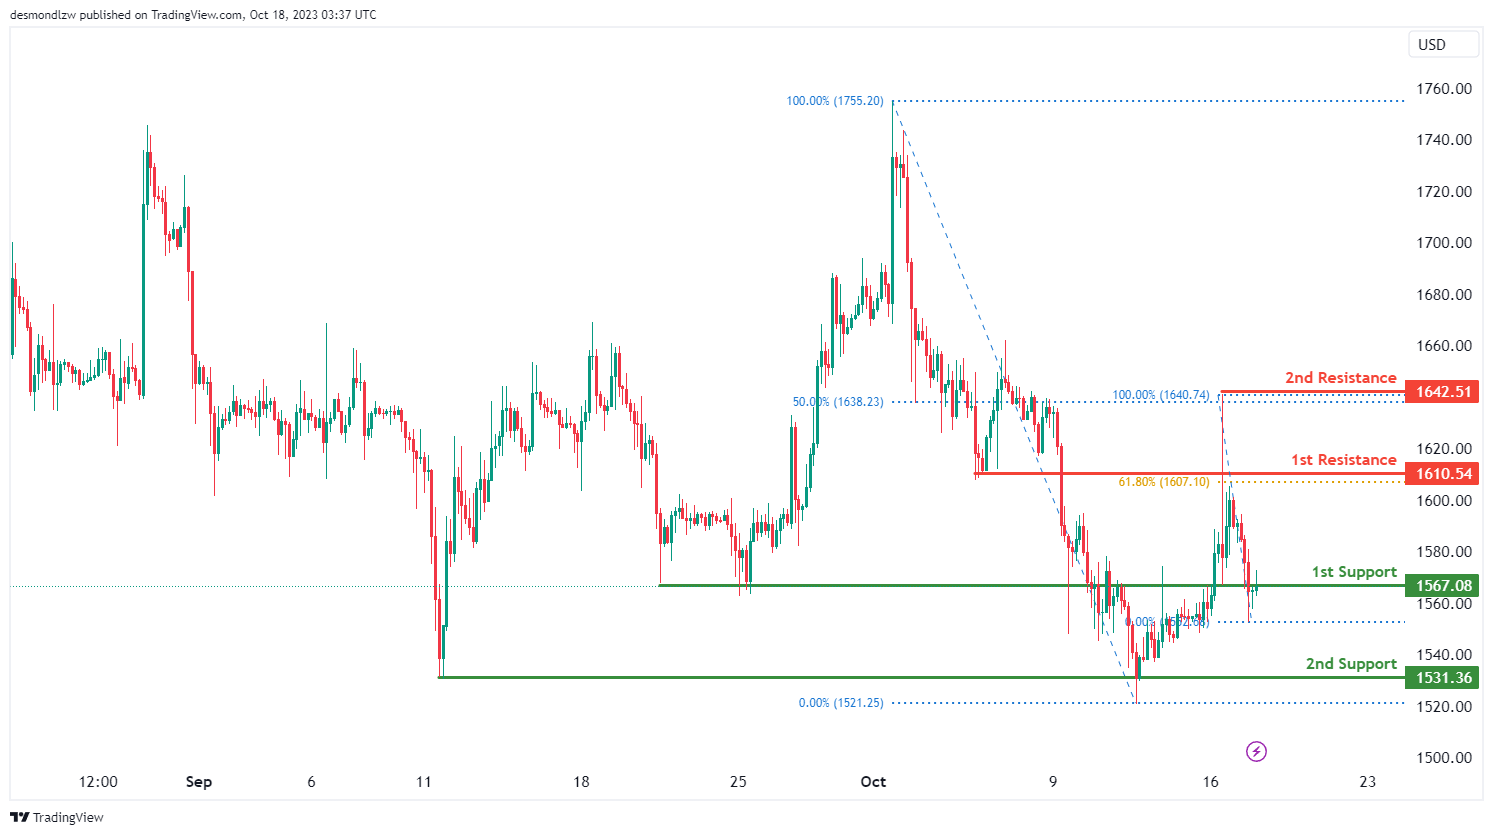
The instrument being analyzed is ETH/USD, and the current overall momentum of its chart is bullish.
There is a potential scenario where the price could make a bullish bounce off the 1st support level, which is at 1567.08, and head towards the 1st resistance level at 1610.54.
The 1st support at 1567.08 is considered significant because it acts as an overlap support, providing a potential level of price support.
In addition, there is a 2nd support level at 1531.36, which is also valuable as it functions as a multi-swing low support, further enhancing its significance in the analysis.
On the resistance side, the 1st resistance level at 1610.54 is considered important because it represents an overlap resistance. This level aligns with a 61.80% Fibonacci Retracement, indicating that it might act as a barrier to further price increases.
Moreover, there is a 2nd resistance level at 1642.51, which is significant as it represents a swing high resistance and corresponds to a 50% Fibonacci Retracement. This level could potentially hinder the price from moving higher, contributing to the overall bullish outlook.
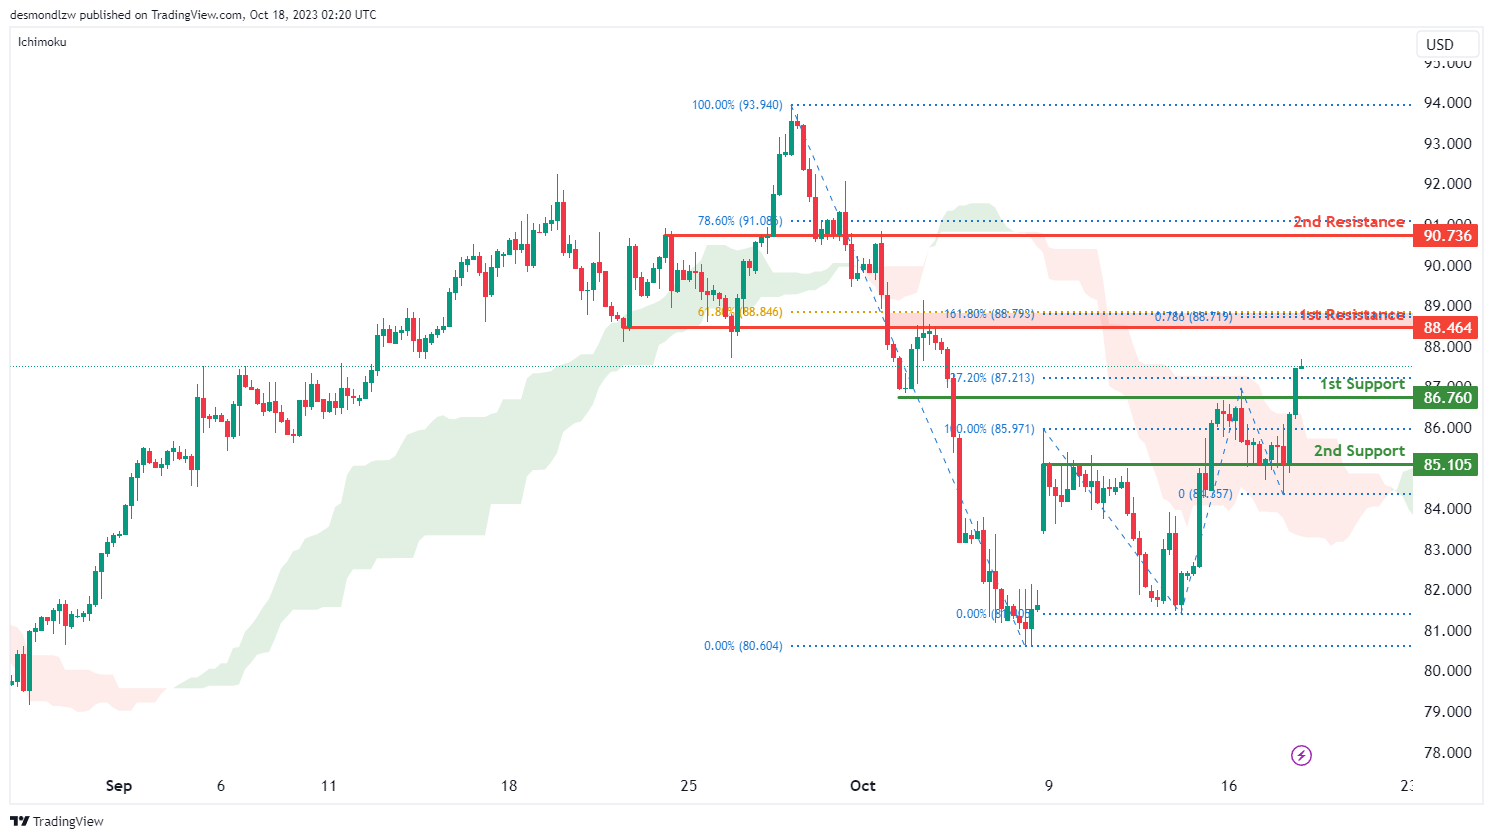
WTI/USD:
The WTI chart currently shows a bullish momentum with price breaking above the bearish Ichimoku cloud, indicating a potential scenario for price to make a bullish continuation towards the 1st resistance level.
The 1st resistance level at 88.46 is identified as an overlap resistance that aligns with a confluence of Fibonacci levels i.e. the 61.80% retracement, the 78.60% projection and the 161.80% extension levels. Beyond this, the 2nd resistance level at 90.74 is also marked as an overlap resistance level that aligns close to the 78.60% Fibonacci retracement level.
To the downside, the 1st support level at 86.76 is identified as an overlap support level. Additionally, the 2nd support level at 85.11 is also noted as an overlap support, indicating a potential support zone.
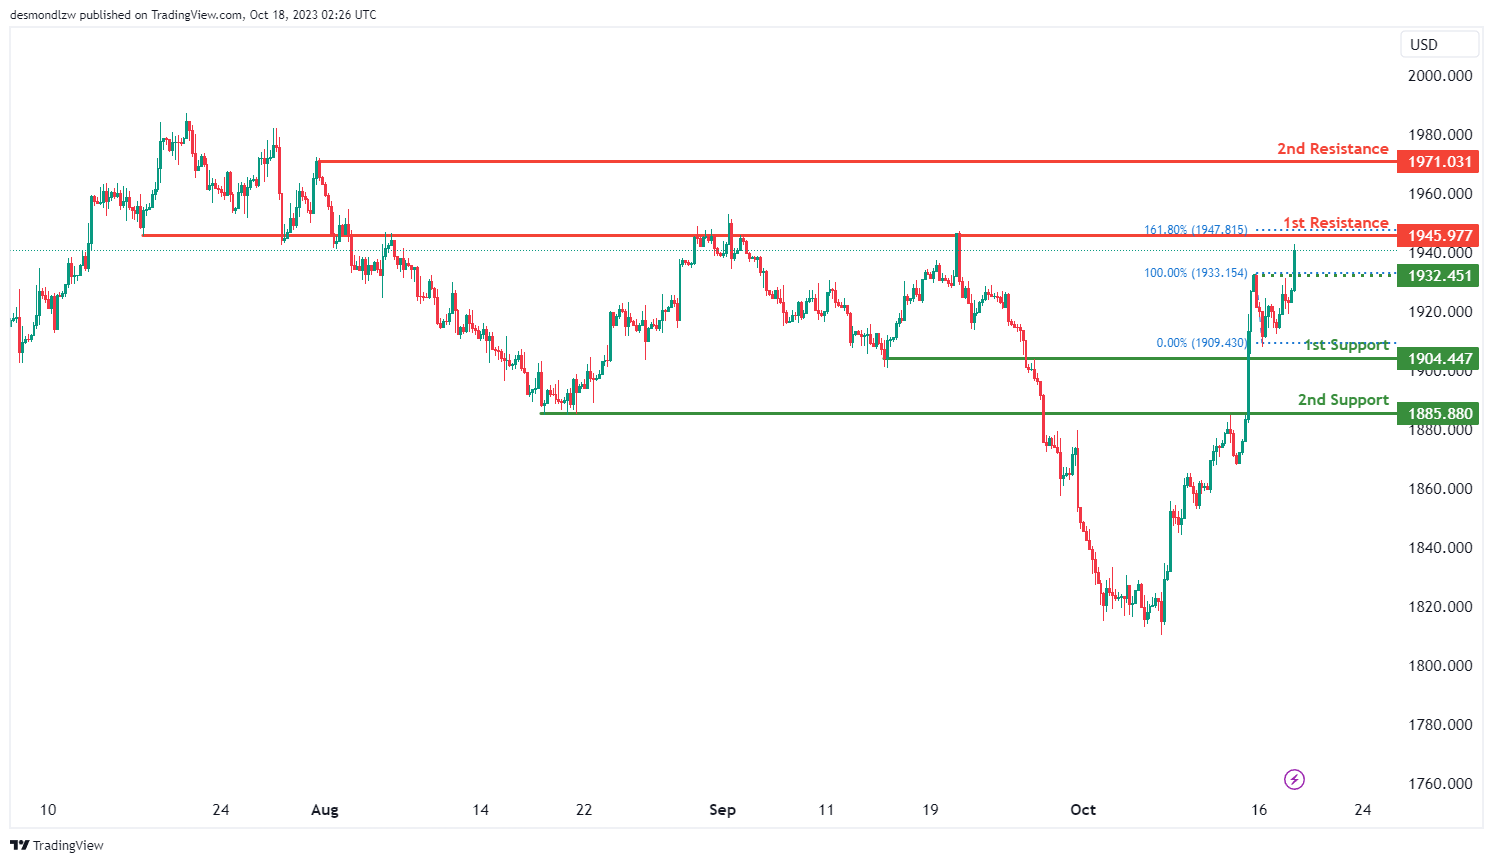
XAU/USD (GOLD):
The XAU/USD chart currently exhibits a bearish overall momentum, suggesting a potential bearish reaction off the 1st resistance level with a subsequent drop towards the 1st support level.
The 1st support at 1904.44 is considered significant as it aligns with a pullback support level. Additionally, the 2nd support at 1885.88 is also identified as a pullback support, providing further potential reinforcement for price support.
On the resistance side, the 1st resistance at 1945.97 is characterized as an overlap resistance level, and it coincides with the 161.80% Fibonacci Retracement level. Beyond this, the 2nd resistance at 1071.00 is identified as a swing high resistance
The accuracy, completeness and timeliness of the information contained on this site cannot be guaranteed. IC Markets does not warranty, guarantee or make any representations, or assume any liability regarding financial results based on the use of the information in the site.
News, views, opinions, recommendations and other information obtained from sources outside of www.icmarkets.com, used in this site are believed to be reliable, but we cannot guarantee their accuracy or completeness. All such information is subject to change at any time without notice. IC Markets assumes no responsibility for the content of any linked site.
The fact that such links may exist does not indicate approval or endorsement of any material contained on any linked site. IC Markets is not liable for any harm caused by the transmission, through accessing the services or information on this site, of a computer virus, or other computer code or programming device that might be used to access, delete, damage, disable, disrupt or otherwise impede in any manner, the operation of the site or of any user’s software, hardware, data or property.


