
Key risk events today:
Canada Inflation; US Building Permits.
(Previous analysis as well as outside sources – italics).
EUR/USD:
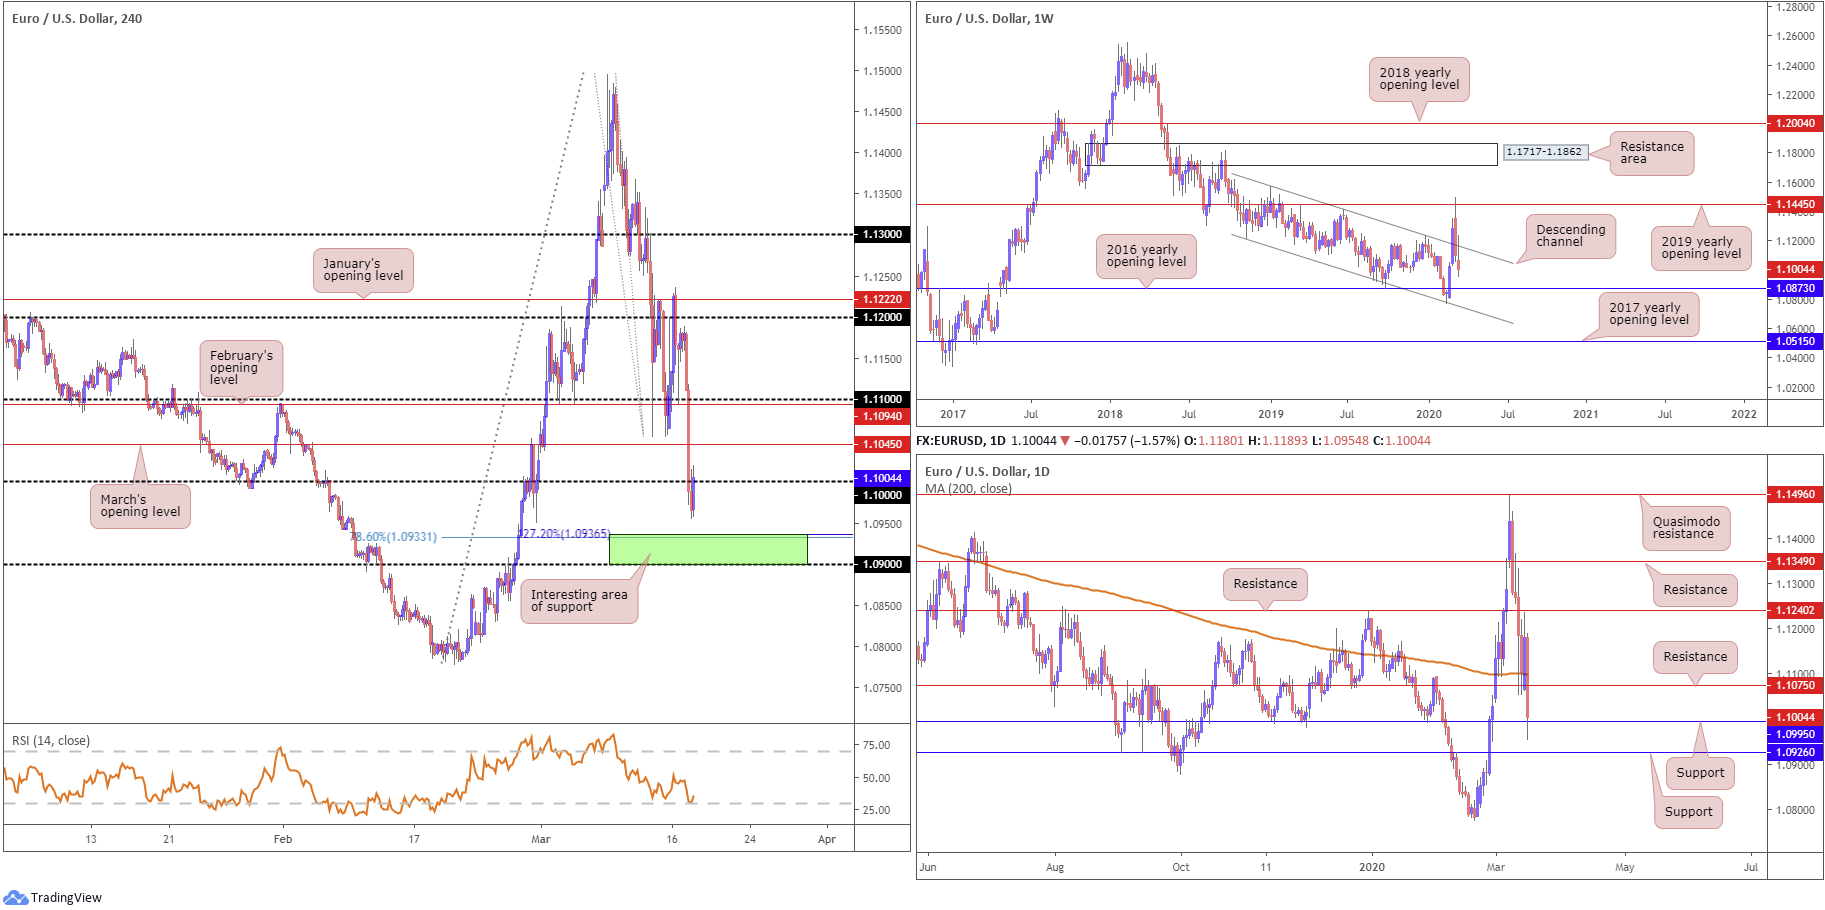
Europe’s shared currency went back to playing on the defensive against the US dollar Tuesday, shedding more than 1.50%, aided by a grim ZEW survey out of Germany. EUR/USD H4 dipped its toes south of the widely watched figure 1.10 going into US hours, tripping a large portion of sell-stops and exposing a 78.6% Fibonacci retracement level at 1.0933 and a 127.2% Fibonacci extension at 1.0936. Resistance north of 1.10 falls in close by at 1.1045, March’s opening level, followed by February’s opening level at 1.1094 and then the 1.11 handle. It’s also worth underscoring the fact the relative strength index (RSI) challenged its oversold base.
Further afield, daily movement sidestepped support at 1.1075 (now a serving resistance) and crossed swords with support coming in at 1.0995, sited just north of another layer of support at 1.0926. Technical research based on the weekly timeframe had the 2019 yearly opening level from 1.1445 elbow its way back into the spotlight last week, with bears reasserting their dominance and snapping a three-week winning streak. Down more than 180 points, price dipped its toes back within a descending channel formation (1.1569/1.1215), with the current week seen extending losses, potentially poised to approach the 2016 yearly opening level at 1.0873. Note the primary trend, seen clearly on the weekly timeframe, has drifted south since 2018.
Areas of consideration:
The support area between the 1.09 handle on the H4 timeframe and the Fibonacci collection highlighted above between 1.0933/1.0936 (green) likely has appeal today, knowing it houses within it the daily support at 1.0926. Traders will likely have crosshairs fixed on 1.10 as an upside target out of this zone.
Selling the underside of 1.10 may be appealing on the lower timeframes, and even trades in harmony with direction on the weekly timeframe, though traders must contend with daily price testing support at 1.0995.
GBP/USD:
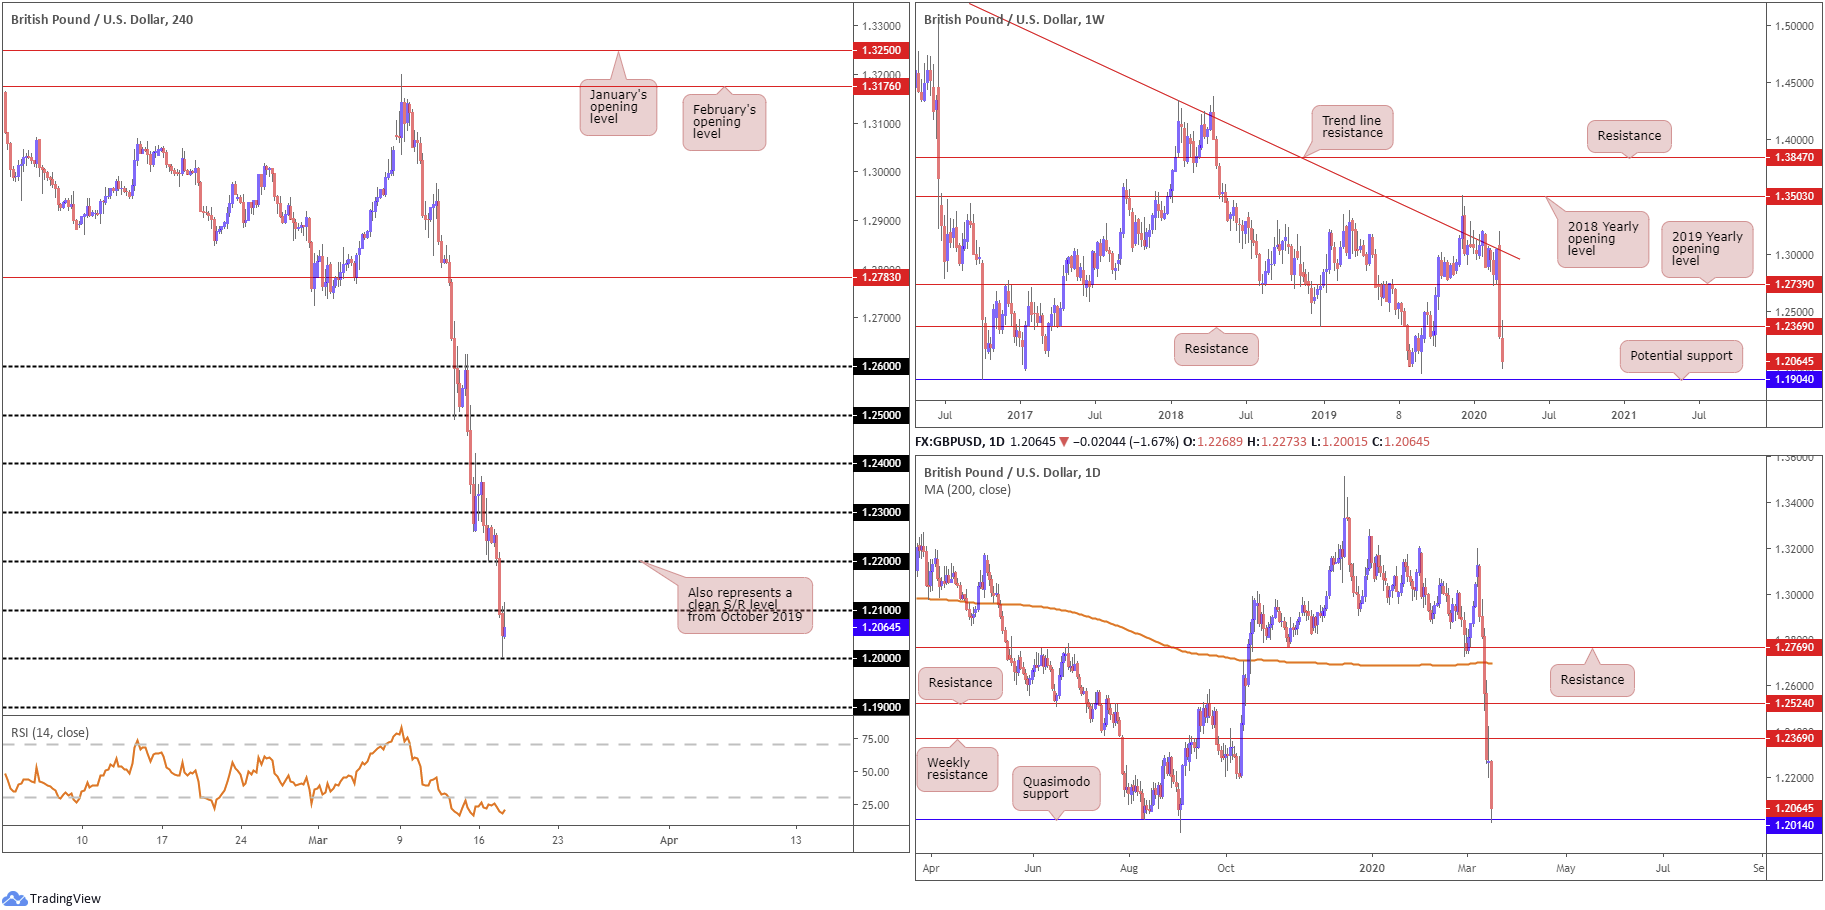
Sterling tore through 1.22 and 1.21 vs. the buck Tuesday on the way to the widely watched 1.20 key figure, irrespective of an encouraging jobs and earnings update. Bottoming a point north of 1.20, bolstered by daily price crossing paths with Quasimodo support at 1.2014 and confirmed by the relative strength index (RSI) trekking through oversold terrain on the H4, GBP/USD latched onto fresh bids in recent trade and revisited the underside of 1.21. A break above this hurdle today reveals 1.22, a level representing a strong S/R barrier taken from October 2019.
Higher-timeframe movement on the weekly timeframe retested support-turned resistance at 1.2369. Support resides around 1.1904, a level that capped downside in early October 2016, which is sited just south of the 1.1958 September 2nd low (2019).
Areas of consideration:
While weekly price indicates further downside, daily flow suggests a recovery from Quasimodo support underlined above at 1.2014.
1.21 on the H4 timeframe could hold today and serve as resistance, not only due to the weekly timeframe portending lower moves, but also given the majority of traders likely have no intention of buying GBP anytime soon owing to the precipitous decline over the past week. Therefore, traders may drill down to the lower timeframes around 1.21 and attempt to trade local structure, which could be something as simple as a bearish candlestick configuration, such as a shooting star pattern or bearish engulfing formation.
AUD/USD:
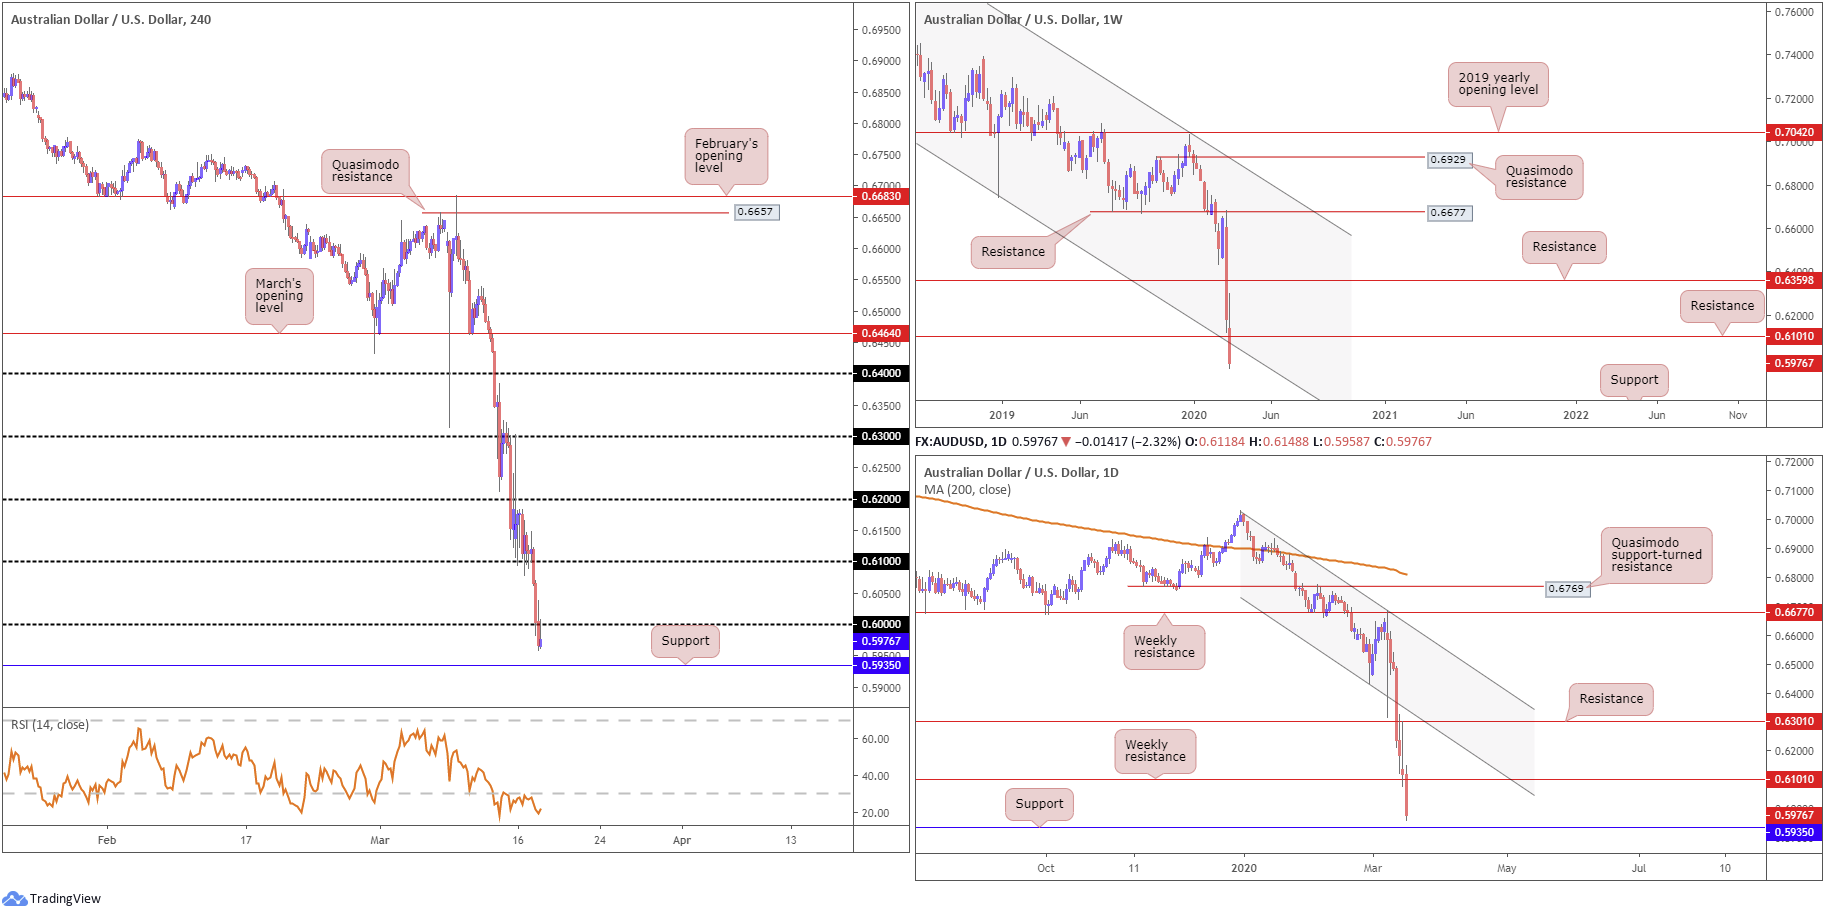
Tuesday had AUD/USD lose grip of the key figure 0.60, retesting the latter as resistance in recent hours. The Minutes of the Monetary Policy Meeting of the Reserve Bank Board confirmed that the decision to lower the cash rate from 0.75% to 0.5% was driven by the Board’s concern about the impact of COVID-19 on the Australian economy and the world economy. The RBA has also announced that additional policy initiatives will be outlined at 4pm on March 19th (Westpac).
Technical action on the weekly timeframe nosedived through support at 0.6101, coupled with channel support, taken from the low 0.6744, both now likely to serve as resistances going forward. Price currently fades lows at 0.5958, levels not seen since 2003, after breaking the major 0.6006 October 27th (2008) low. A closer reading of price action on the daily timeframe reveals the unit trading within striking distance of support at 0.5935, after engulfing the weekly support underlined above at 0.6101.
Across the page on the H4 timeframe, as briefly highlighted above, the pair lost grip of the 0.60 figure yesterday, though is seen retesting the latter, as we write. In terms of the relative strength index (RSI), we remain working our way through oversold waters, unable to exit 30.00. Daily support emphasised above at 0.5935 also represents a valid downside target on the H4 scale.
Areas of consideration:
According to the primary trend and overall technical structure, the outlook is not bright for AUD/USD.
As a result of the above, traders will likely be seeking intraday (possibly transitioning into long-term positions) bearish setups from 0.60 today, targeting 0.5935 as an initial take-profit target. This may involve drilling down to the lower timeframes and seeking entry using local structure, trend line break/retest setups, for example.
USD/JPY:
Persistent upside witnessed in the US dollar index, as well as a risk-on trading environment, guided safe-haven markets lower Tuesday, including the Japanese yen. Disappointing US Retail Sales data was largely ignored.
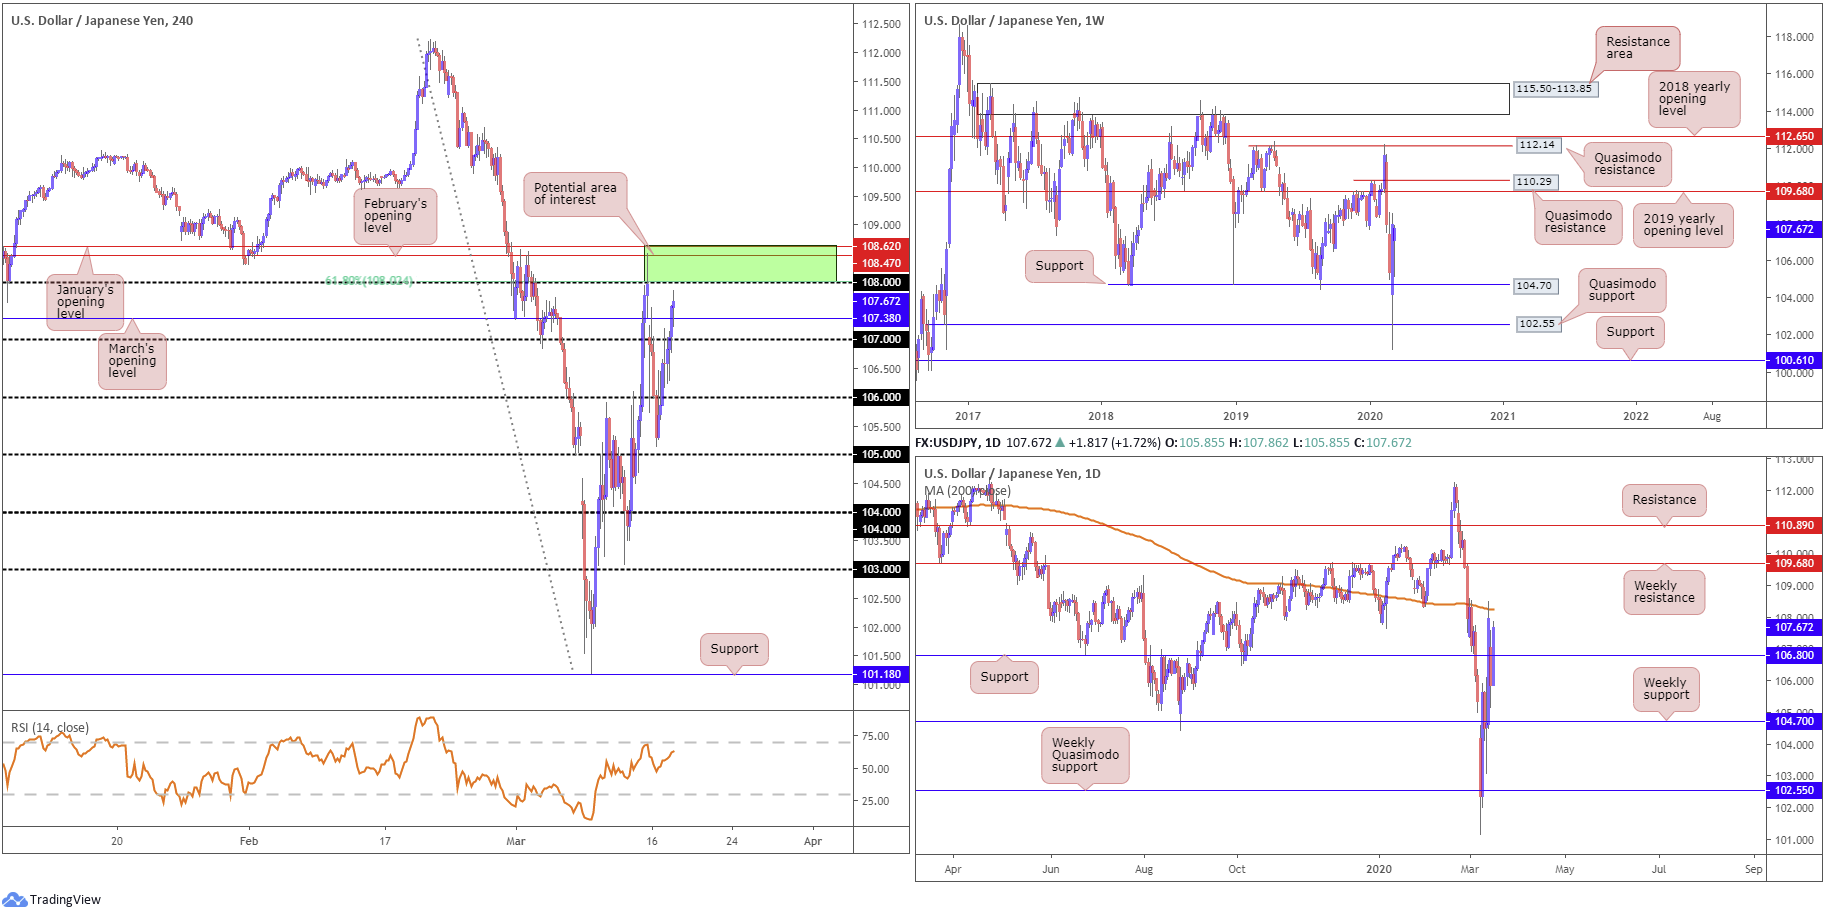
Up 1.70%, the H4 candles recently jumped through 1.07 and overthrew March’s opening level at 107.38, consequently revealing 1.08 as potential resistance, closely followed by February and January’s opening levels at 108.47 and 108.62, respectively. The relative strength index (RSI) for those who follow momentum oscillators, will note the indicator hovers a touch south of overbought terrain.
Weekly support remains in view at 104.70, with eyes on the 2019 yearly opening level at 109.68 as resistance, followed by a Quasimodo formation at 110.29. Meanwhile, on the daily timeframe, price nudged above resistance at 106.80, laying the foundations for an approach to the 200-day SMA (orange – 108.23), with a break exposing 109.68 based on the weekly timeframe, highlighted above.
Areas of consideration:
The area between 108.62/108 is likely of interest for sellers today on the H4, in spite of recent upside.
Comprised of January’s opening level at 108.62, February’s opening level at 108.47, the round number 108, a 61.8% Fibonacci retracement at 108.02 and the 200-day SMA (108.23), this area could entice sellers in the event the zone makes an appearance. Downside targets will likely be set around 107 and daily support at 106.80, with a break perhaps prompting moves to 106.
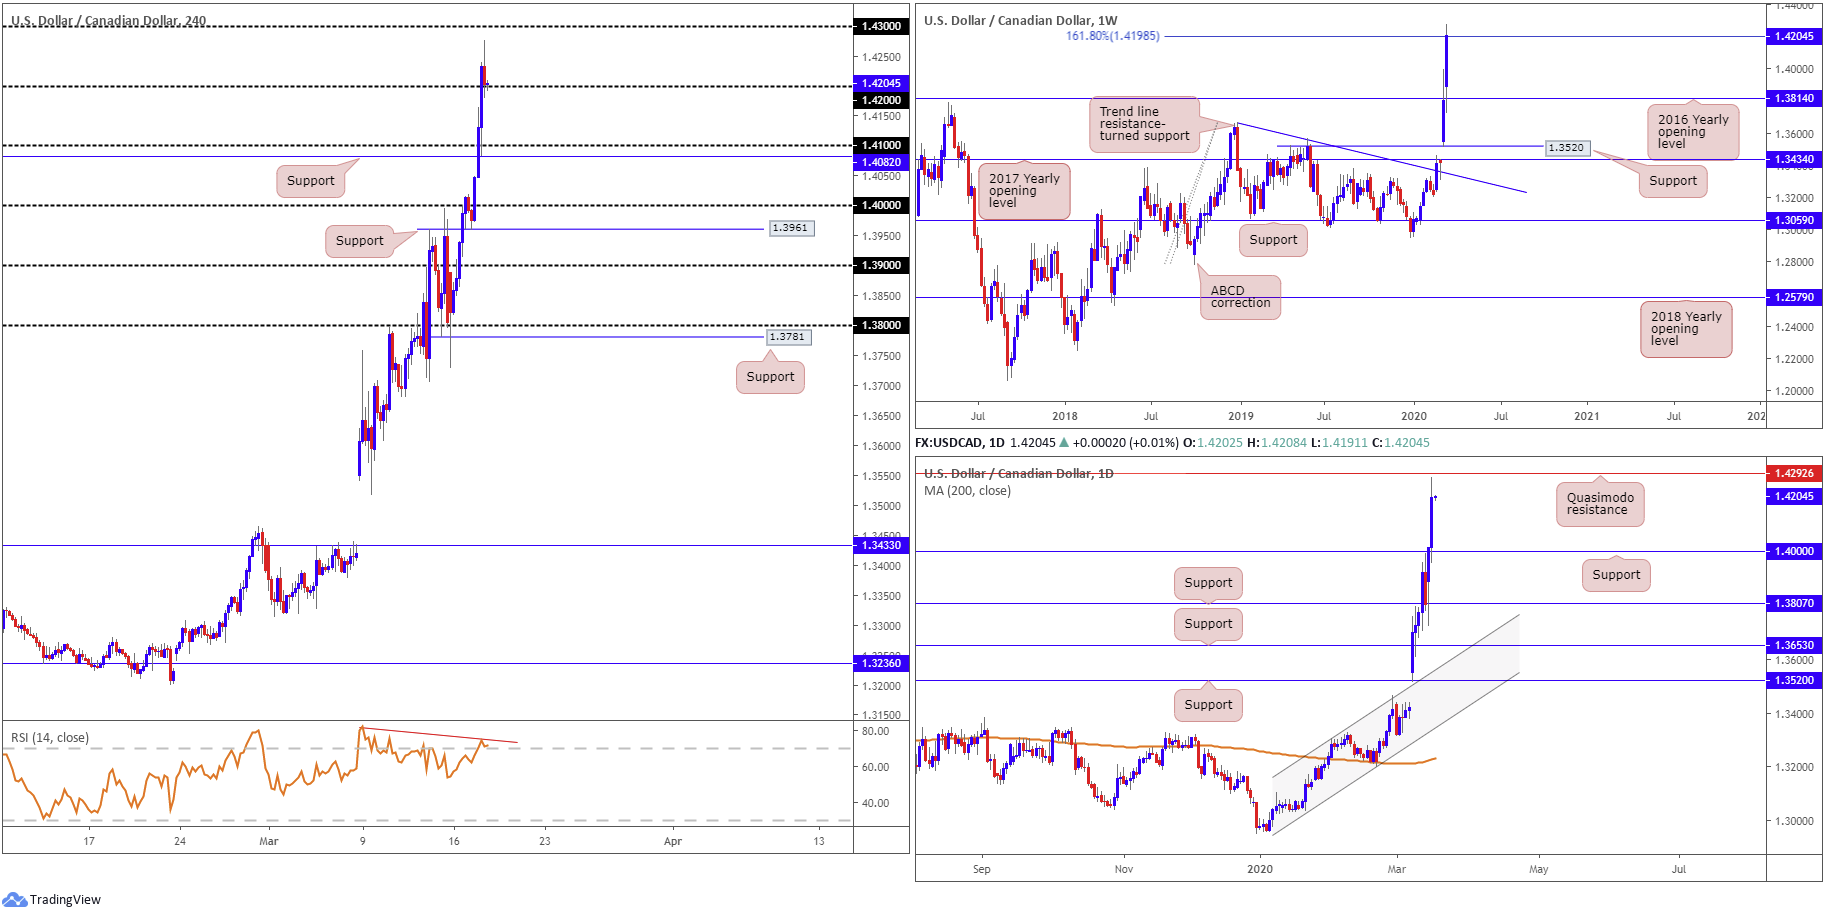
USD/CAD:
USD/CAD bulls remained on the offensive Tuesday, reinforced by a strongly bid dollar across the board and falling WTI prices.
Price action on the weekly timeframe, following a near-to-the-point-retest at the 2016 yearly opening level from 1.3814, crossed paths with a 161.8% Fibonacci extension at 1.4198. A break here highlights the 1.4689 January 18th high (2016).
Lower on the curve, daily flow chalked up a mild end-of-day correction just south of a Quasimodo formation at 1.4292, with a pullback from here targeting 1.4000. The story on the H4 timeframe is currently retesting 1.42 as support, after chalking up highs at 1.4276. It might also be worth noting the relative strength index (RSI) is seen producing clear-cut bearish divergence out of overbought territory.
Areas of consideration:
The general sense on the weekly timeframe suggests a move to the downside may occur as 161.8% Fibonacci extension levels, particularly those fixed on higher-timeframe charts, tend to offer at least a bounce. Before this materialises, however, traders may want to pencil in the possibility of daily price nudging higher to draw in Quasimodo resistance at 1.4292. A H4 close below 1.42 may be interpreted as downside confirmation off the 161.8% Fibonacci level on the weekly timeframe, in which case would likely see a wave of sellers enter the fight, attempting a move towards 1.41. Conservative traders may opt to wait and see if a retest at 1.42 plays out before committing. This helps confirm seller intent.
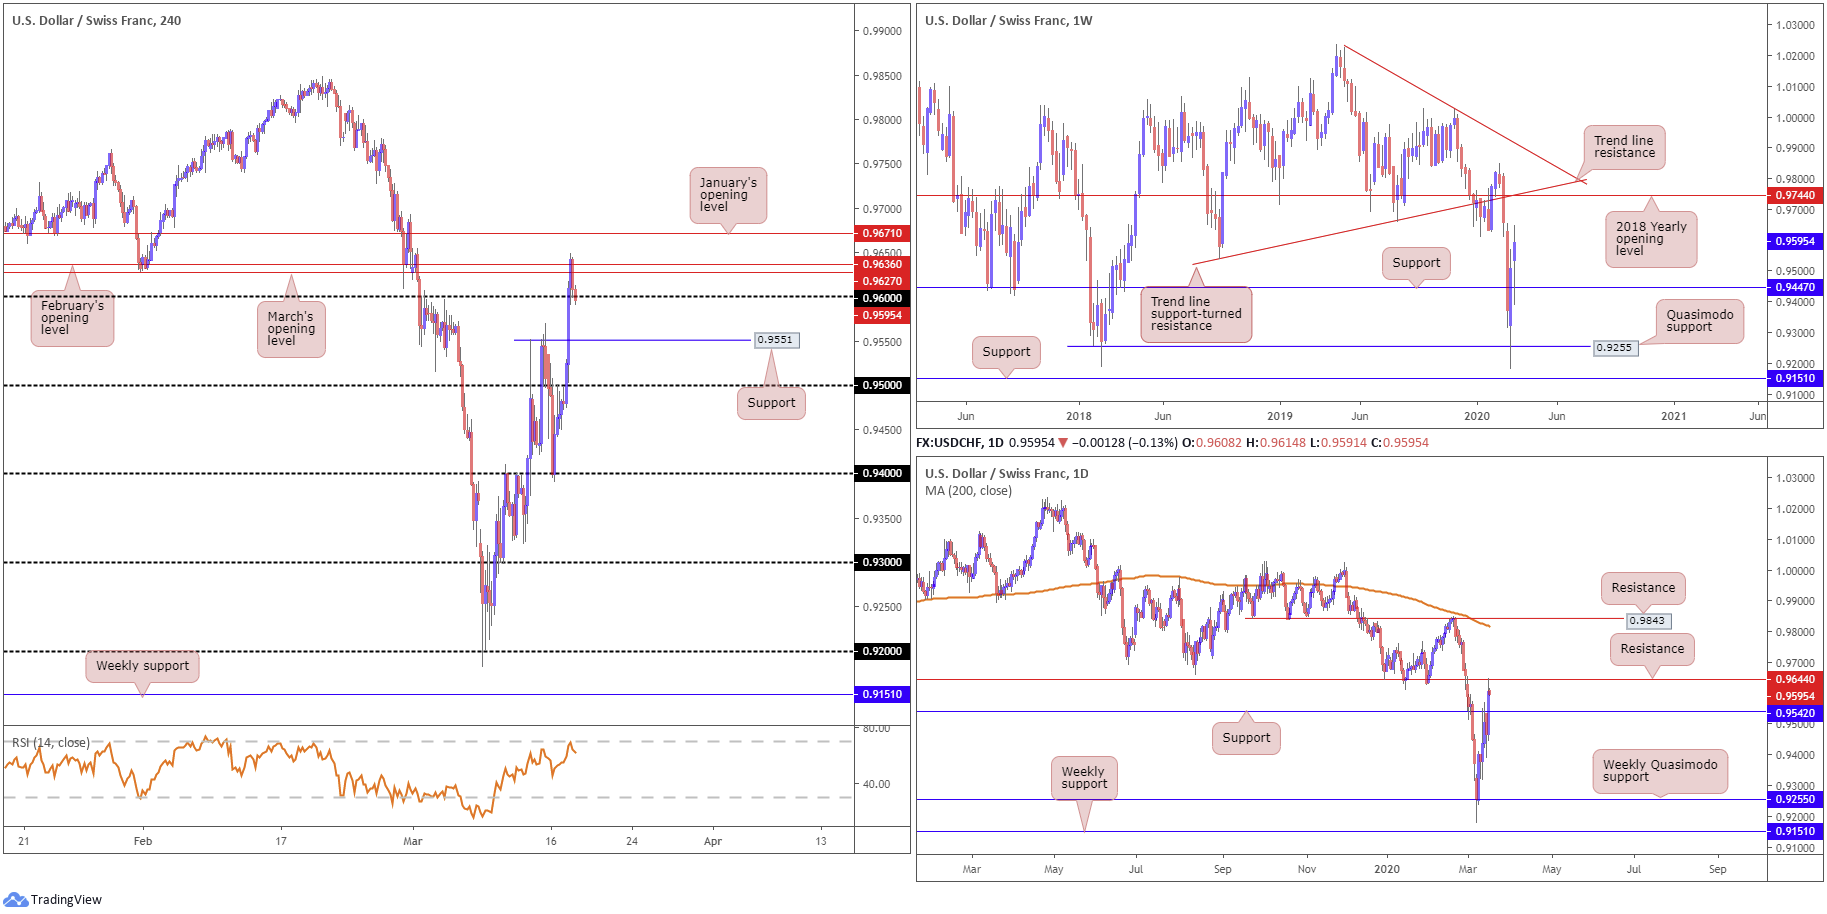
USD/CHF:
Concerns over a shortage of USD funding prompted a fresh USD bid Tuesday, with the US dollar index gravitating to three-week highs, set a touch south of 100.00. This lifted USD/CHF through 0.96 to a session high at 0.9648, grasping March and February’s opening levels at 0.9627 and 0.9636, respectively.
Pressure from daily resistance at 0.9644 recently making an appearance, along with the monthly opening levels mentioned above and the H4 relative strength index (RSI) testing overbought status is, as we write, seen driving price south of 0.96. Continued downside has H4 support at 0.9551 to target, followed by support on the daily timeframe at 0.9542.
Further out on the weekly timeframe, however, price is seen establishing a firm footing above support at 0.9447. The general sense on this timeframe is that continued buying will draw the spotlight towards the 2018 yearly opening level at 0.9744, joined closely by two weekly trend line resistances (0.9542/1.0226).
Areas of consideration:
A H4 close beneath 0.96 today, preferably followed up with a retest motion, would likely awaken sellers, targeting H4 support at 0.9551 and daily support priced in at 0.9542, with a break likely unshackling downside to 0.95.
Conservative traders are likely to prefer a retest at the underside of 0.96 before pulling the trigger, owing to the threat of further buying on the weekly timeframe.
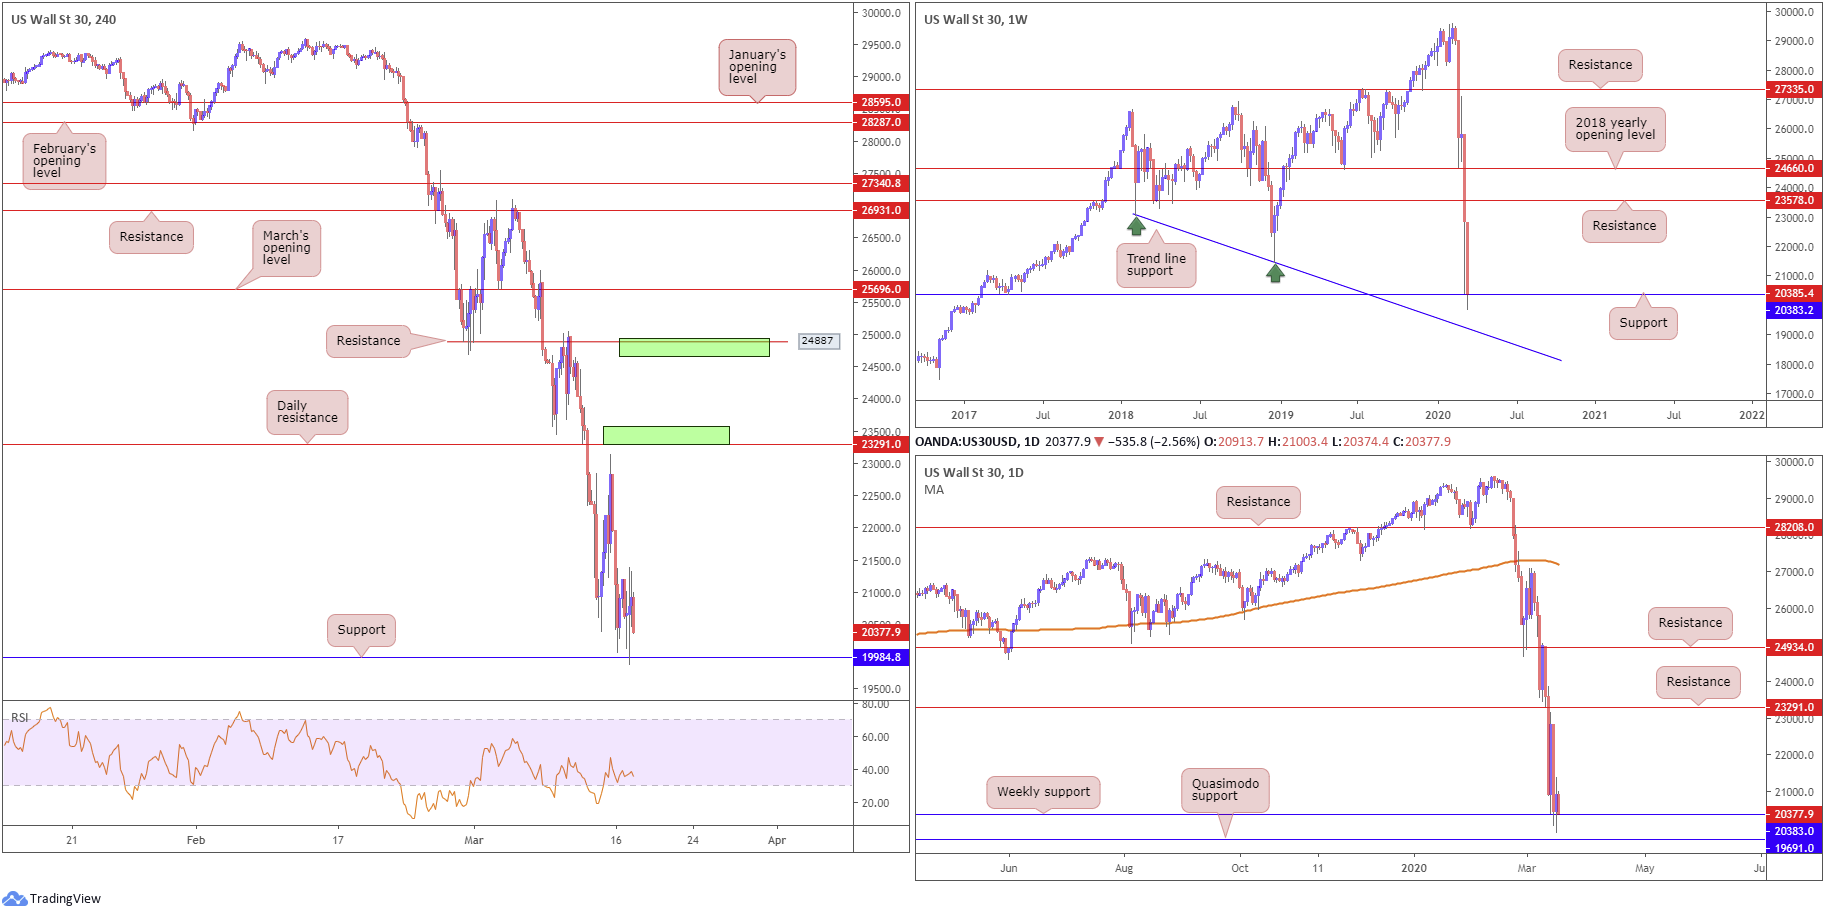
Dow Jones Industrial Average:
US equities staged a modest recovery Tuesday, following the Fed unleashing additional emergency moves to assist credit markets, consequently clawing back just over a third of Monday’s historic 3,000-point plunge. The Dow Jones Industrial Average added 1048.86 points, or 5.20%; the S&P 500 also climbed 143.04 points, or 5.99%, and the tech-heavy Nasdaq 100 ended higher by 453.57 points, or 6.46%.
From a technical perspective, price action on the weekly timeframe remains testing support at 20383. Continued decline, though, may see sellers embrace trend line support, pencilled in from the low 23055. A rejection off 20383, on the other hand, has resistance at 23578 to target, whereas a move off 20383, based on the daily scale, has resistance plotted at 23291 in sight.
Moves beneath the weekly support on the daily timeframe will likely steamroll price action into a Quasimodo support at 19691. Also of note on the daily timeframe is the 200-day SMA (orange – 27209) seen turning lower. It might also interest some traders to note that in between daily Quasimodo support at 19691 and weekly support at 20383, we have a H4 support currently in motion at 19984.
Areas of consideration:
The combination of weekly support at 20383, shadowed closely by daily Quasimodo support at 19691 and H4 support at 19984, may be enough to encourage further upside. As of yet, though, H4 action has failed to print anything of worth to the upside, in terms of candlestick patterns.
In the event further recovery does materialise, traders may recall the following zones highlighted in previous analysis:
The H4 zone marked in green (lower area) between 23578/23291 represents weekly and daily resistances, an area sellers may have on the radar for potential shorting opportunities, in the event we get back to these levels. Another area of interest (upper green zone), should 23578/23291 fail to produce much, is seen between 24934/24660, a zone made up of the 2018 yearly opening level at 24660, daily resistance at 24934 and H4 resistance at 24887.
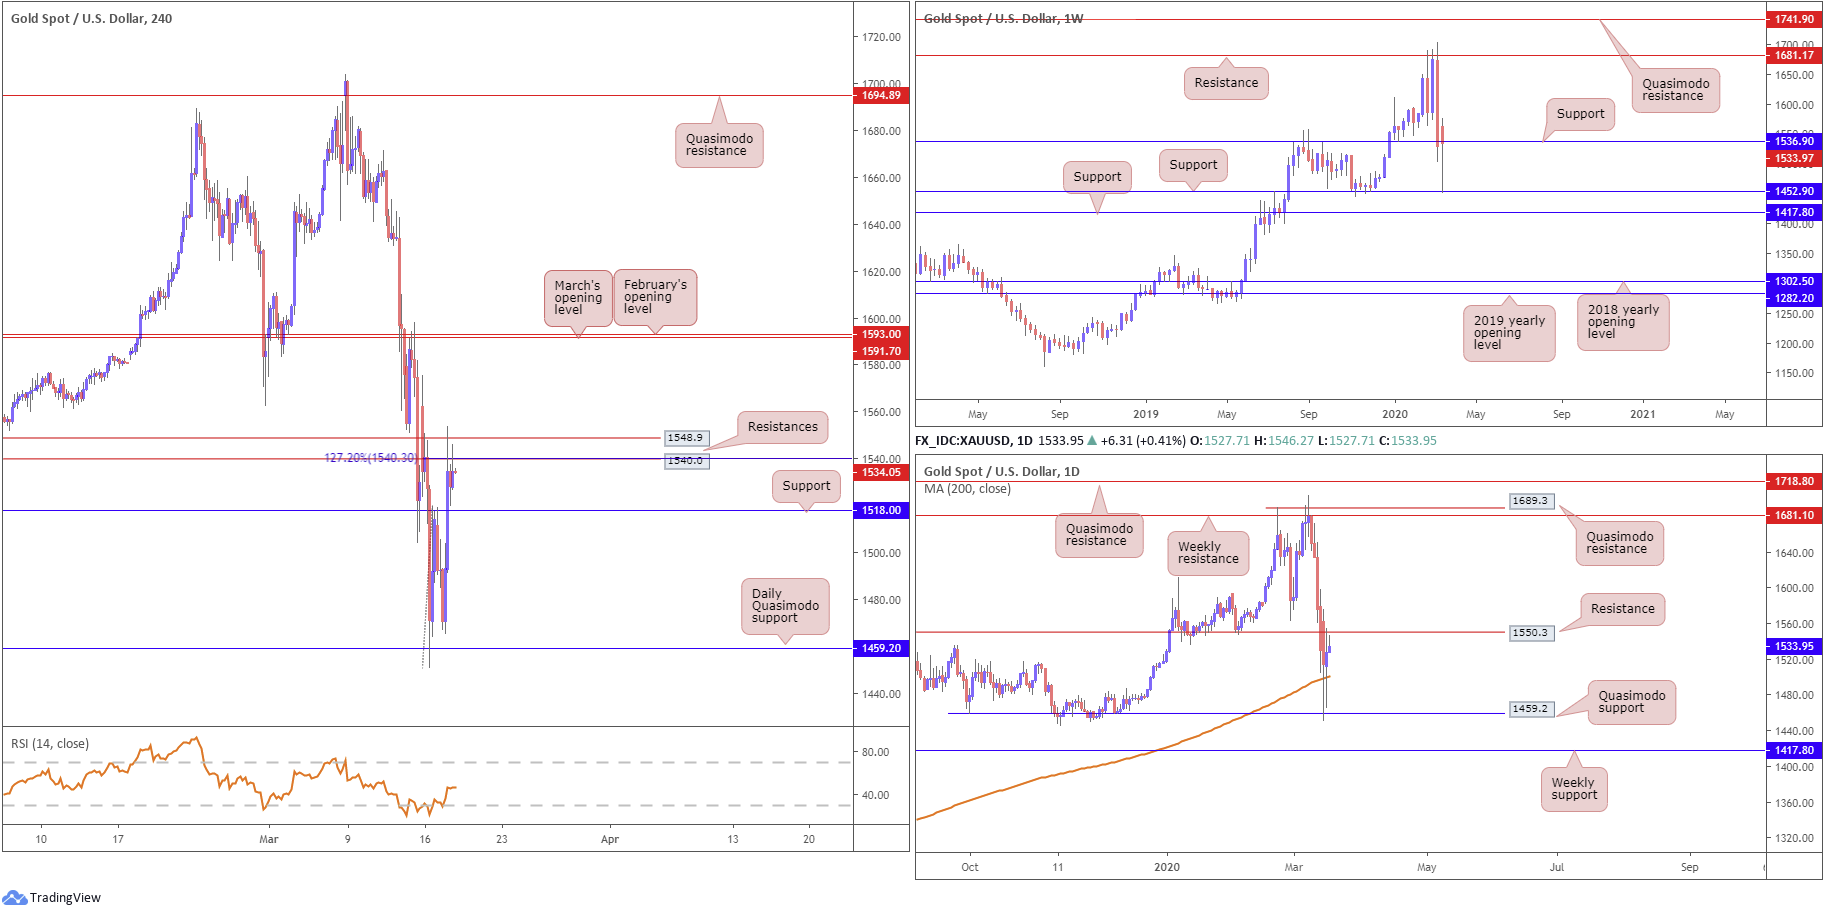
XAU/USD (GOLD):
Technical developments based on the weekly timeframe has price action attempting to regain a foothold north of support at 1536.9, following a near-to-the-point recovery off support coming in at 1452.9. Moves higher may lay the foundations for an approach back towards resistance priced in at 1681.1.
Closer analysis of price action on the daily timeframe has bullion shaking hands with its 200-day SMA (orange – 1500.1) and fading Quasimodo support from 1459.2, sited just north of the current weekly support level. Despite building a reasonably solid defence off 1459.2, resistance at 1550.3 is proving a troublesome hurdle to conquer. A decisive break higher from here builds a possible foundation to regroup with the aforementioned weekly resistance, followed closely by a daily Quasimodo resistance at 1689.3.
Resistance at 1518.0 on the H4 timeframe gave way Tuesday (now a serving support), with price challenging H4 resistances at 1548.9 and 1540.0, along with a 127.2% Fib ext. level at 1540.3. The relative strength index (RSI) is also beginning to make a show, breaking out of oversold territory and approaching 50.00.
Areas of consideration:
Technically speaking, price could swing either way today. However, should a H4 close form below support at 1518.0, knowing we’re trading below resistance at 1550.3 on the daily timeframe, this may generate additional downside, with a revisit to daily Quasimodo support at 1459.2 a possibility.
Alternatively, a decisive H4 close above 1548.9, which theoretically should also clear daily resistance and push weekly price further above 1536.9, underlines a potential run to March and February’s opening levels at 1591.7 and 1593.0, respectively.
The accuracy, completeness and timeliness of the information contained on this site cannot be guaranteed. IC Markets does not warranty, guarantee or make any representations, or assume any liability regarding financial results based on the use of the information in the site.
News, views, opinions, recommendations and other information obtained from sources outside of www.icmarkets.com.au, used in this site are believed to be reliable, but we cannot guarantee their accuracy or completeness. All such information is subject to change at any time without notice. IC Markets assumes no responsibility for the content of any linked site.
The fact that such links may exist does not indicate approval or endorsement of any material contained on any linked site. IC Markets is not liable for any harm caused by the transmission, through accessing the services or information on this site, of a computer virus, or other computer code or programming device that might be used to access, delete, damage, disable, disrupt or otherwise impede in any manner, the operation of the site or of any user’s software, hardware, data or property.


