
Key risk events today:
ECB President Lagarde Speaks; German Ifo Business Climate; UK CPI y/y, PPI Input m/m; Canada CPI m/m, Common CPI y/y, Median CPI y/y, Trimmed CPI y/y; Crude Oil Inventories.
EUR/USD:
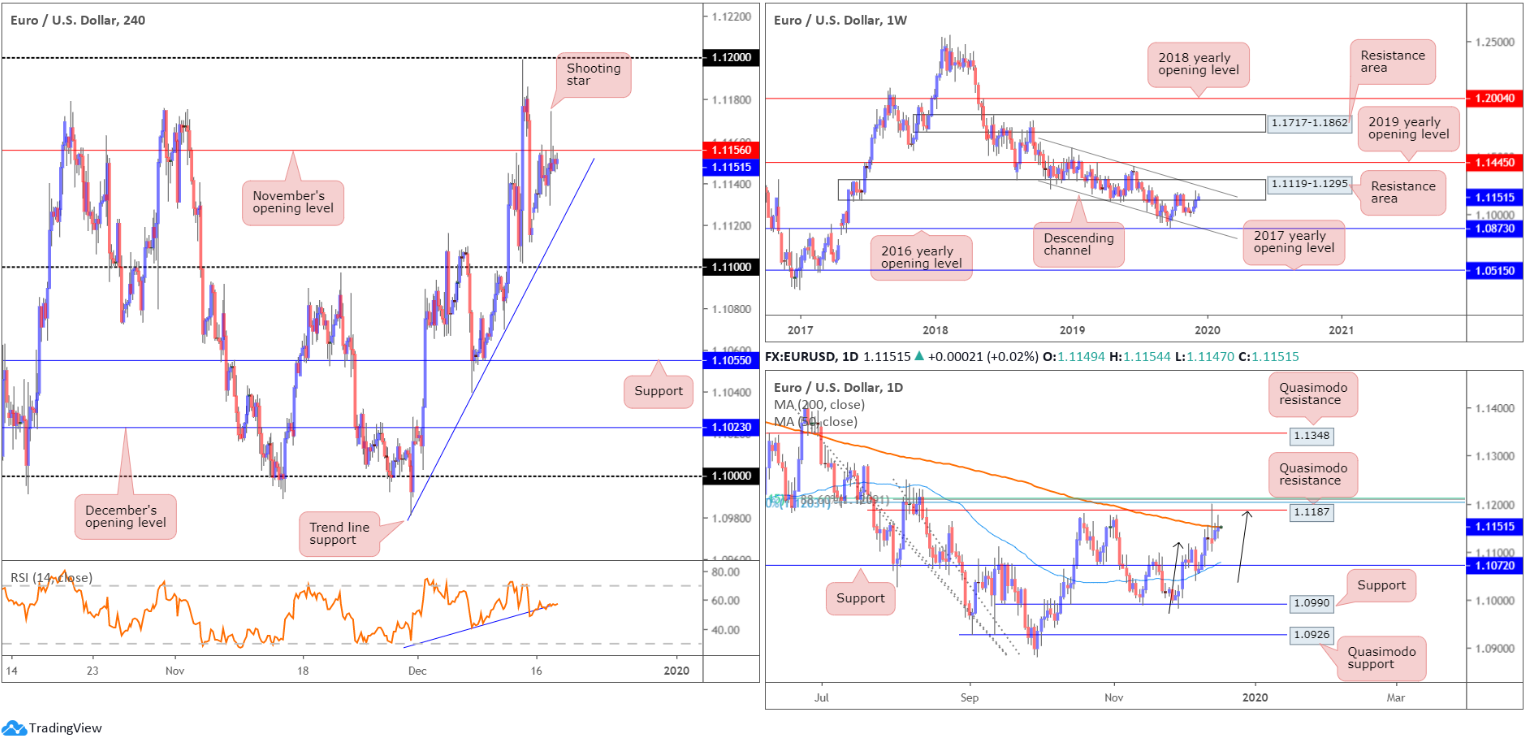
Europe’s single currency concluded Tuesday mixed against the greenback, after failing to sustain gains north of November’s opening level at 1.1156. As evident from the H4 timeframe this morning, traders are left with a shooting star candlestick pattern (considered a bearish signal at troughs), which could entice selling towards nearby trend line support, extended from the low 1.0981. A violation of the said trend line exposes the 1.11 handle, whereas a break above 1.1156 has the 1.12 handle to target. Indicator-based traders may also wish to note the relative strength index (RSI) rests above its 50.0 value, though is still attempting to break a trend line support (blue line). This may be an early warning sign we’re heading lower.
Weekly flow remains contained south of a long-standing resistance area at 1.1119-1.1295, which happens to intersect closely with a channel resistance, extended from the high 1.1569. Downside objectives visible from here fall in at the 2016 yearly opening level at 1.0873 and channel support, taken from the low 1.1109.
A closer reading of technical movement on the daily timeframe reveals the 200-day SMA (orange – 1.1150) holds price lower. Previously, however, price whipsawed through the said SMA and connected with Quasimodo resistance at 1.1187, positioned a few points south of a Fibonacci cluster around the 1.1206 neighbourhood. What’s also notable from a technical perspective is the bearish ABCD correction (black arrows) that terminated at the aforementioned Quasimodo resistance. Therefore, based on daily analytics, further downside could be seen. Support on this timeframe rests at 1.1072/50-day SMA (1.1078), with a break of this level potentially setting the stage for a push towards support at 1.0990.
Areas of consideration:
Shorts on the back of the reaction off November’s opening level at 1.1156 is an option, basing entry and risk levels on the recently formed H4 shooting star pattern. This is bolstered by weekly and daily structure. Ultimately, sellers will be looking for a break of the current H4 trend line, though 1.11 is likely set as the first take-profit zone. Reducing risk to breakeven at 1.11 is an idea, with daily support at 1.1072 set as the next take-profit target.
Knowing daily support at 1.1072 lurks beneath 1.11, and given psychological levels are prone to fakeouts, the likelihood of a fakeout developing through 1.11 to 1.1072 remains high, according to the chart studies. In the event a fakeout through 1.11 takes form, longs on a H4 close back above the round number could be a possibility, targeting November’s opening level at 1.1156 as the initial port of call. However, this will have you competing with weekly sellers, therefore strict trade management is an absolute must.
GBP/USD:
Sterling ceded further ground to its US counterpart Tuesday, yielding more of its GE-related gains as focus shifts back to Brexit and the risk of a no-deal departure from the European Union.
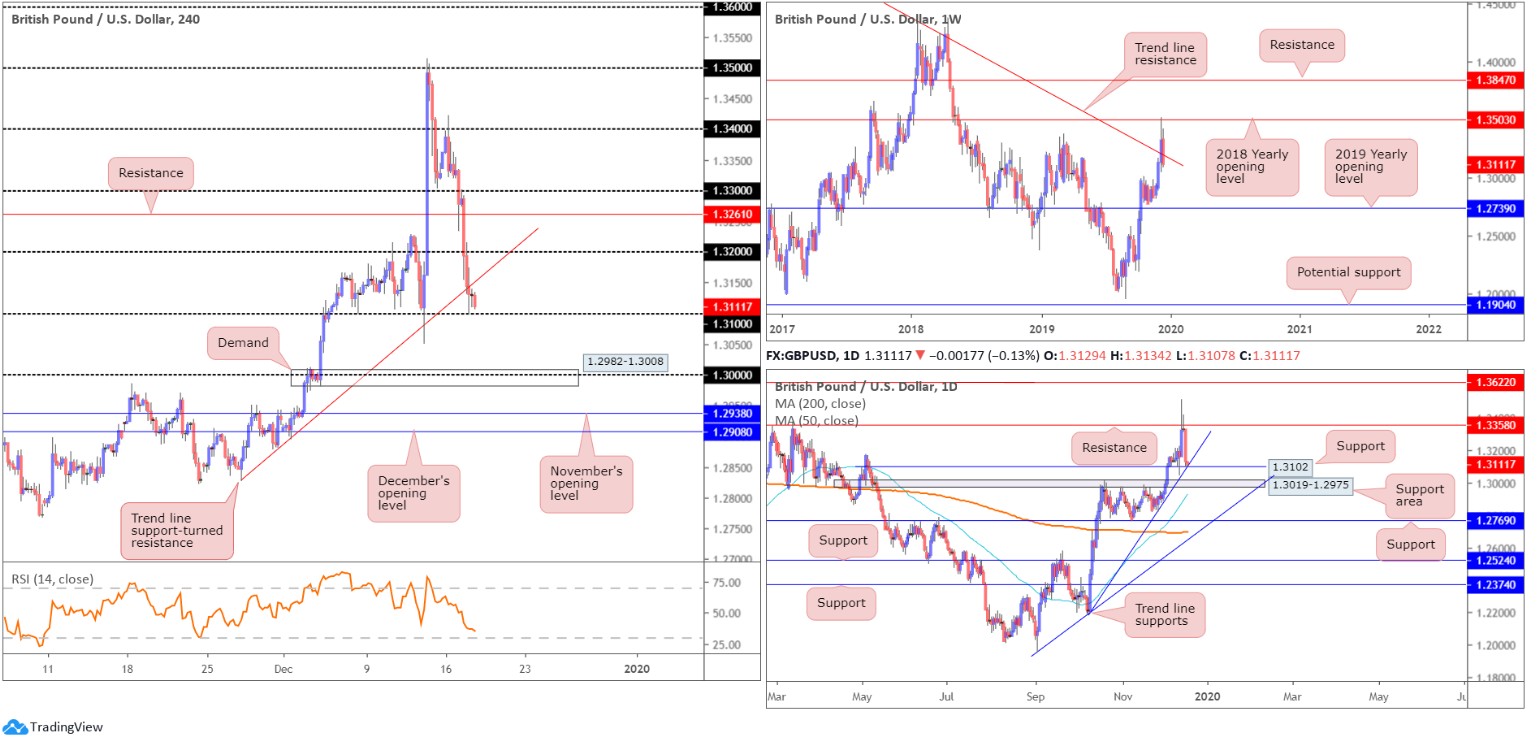
Down more than 200 points, weekly price crossed back through long-standing trend line resistance, pencilled in from the high 1.5930. A defined close south of this barrier highlights a possible approach towards the 2019 yearly opening level at 1.2739.
H4 price dethroned a number of key technical supports yesterday, including the 1.32 handle and trend line support, taken from the low 1.2827. 1.31 entered the mix late in the session and remains supportive as the pair tests pre-election levels.
The reason behind 1.31 holding may have something to do with the fact it aligns with daily support at 1.3102/trend line support, etched from the low 1.2197. A break of 1.31, according to the chart studies, clears the runway for an approach to H4 demand plotted at 1.2982-1.3008, which happens to merge with the key figure 1.30.
Areas of consideration:
On the one hand, we have 1.31 holding ground, with additional support emerging from the daily timeframe. On the other hand, a break of 1.31 is also a possibility having seen weekly price reclaim trend line resistance. A H4 close below 1.31 likely clears the river south to H4 demand at 1.2982-1.3008.
With higher timeframes typically controlling more weight, a break of 1.31 is the more likely route today. Therefore, keep an eye out for bearish scenarios sub 1.31, traders.
AUD/USD:
The lack of tier-1 data kept traders’ focus on external headlines Tuesday, with the overall risk tone remaining under pressure amid fears of a hard Brexit and prolonged US/China tension.
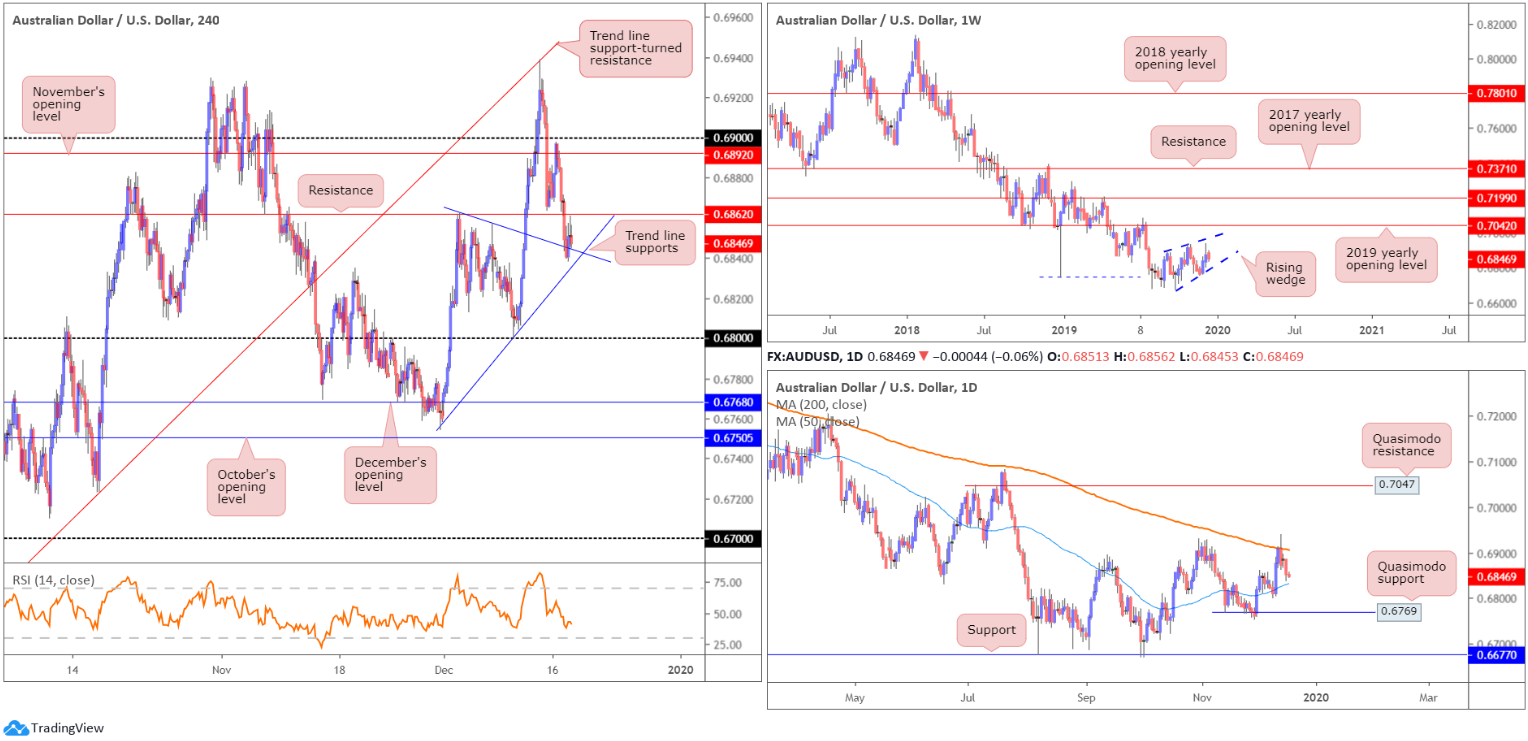
Down 0.50%, yesterday witnessed AUD/USD tunnel through H4 support at 0.6862 and cross swords with trend line support, taken from the high 0.6862. Note, a touch beneath here we also have another trend line support, extended from the low 0.6754. Beneath here, however, the 0.68 handle awaits.
Technical action based on the weekly timeframe shows the candles have been busy carving out what appears to be a rising wedge formation, since registering a bottom in late September at 0.6670. This is typically considered a continuation pattern. As the 2019 yearly opening level at 0.7042 is seen close by, the aforementioned rising wedge could potentially continue advancing until connecting with this angle. The primary downtrend, visible from this timeframe, has also been in play since early 2018, consequently adding weight to a breakout south possibly emerging.
The story on the daily timeframe reveals the unit recently crossed paths with the 200-day SMA (orange – 0.6906). Note AUD/USD has traded south of the said SMA since April 2019, therefore seeing this dynamic value continue to offer resistance is not a surprise. In terms of support, the 50-day SMA (blue – 0.6832) is visible nearby, with a break perhaps clearing the path south to Quasimodo support at 0.6769.
Areas of consideration:
Although the current H4 trend line supports could continue holding price, the fact weekly price displays scope to explore lower ground may instigate a break lower to at least the 50-day SMA.
As such, a H4 close beneath the said H4 trend line supports, preferably followed up with a retest in the form of a bearish candlestick signal, is likely enough to draw in sellers today, targeting 0.6832. followed by 0.68.
USD/JPY:
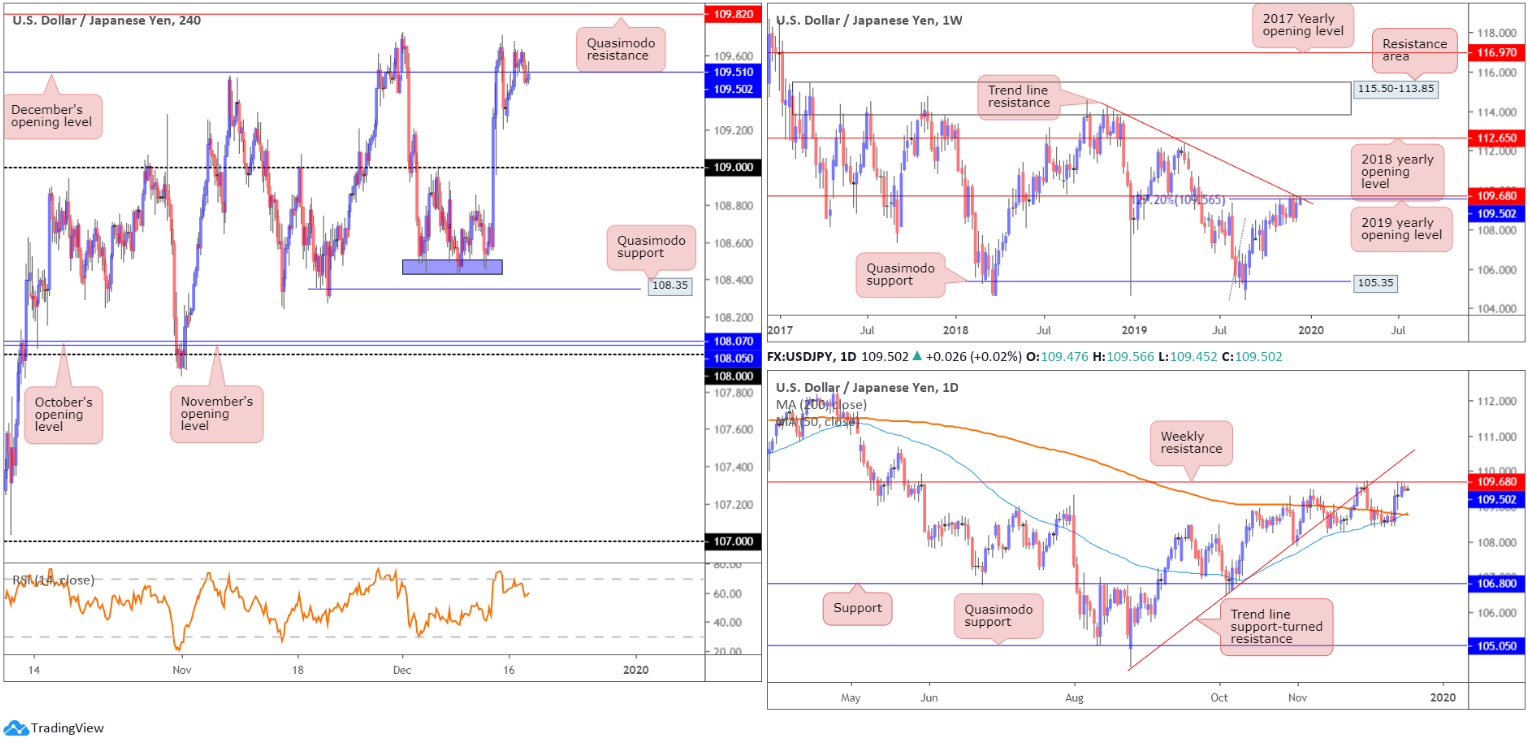
USD/JPY wrapped up Tuesday mostly unmoved, circulating around December’s opening level at 109.51 on the H4 timeframe. In light of this lacklustre performance, much of Tuesday’s thoughts will be echoed in the following piece.
Quasimodo resistance at 109.82 remains the next upside objective on the H4 scale. Alone, this Quasimodo formation is unlikely to produce much, though given its connection to the higher timeframes, we may have something here:
A collection of weekly resistances are in motion: a 127.2% Fibonacci ext. point at 109.56 (taken from the low 104.44), resistance formed at 109.68, the 2019 yearly opening level and trend line resistance, extended from the high 114.23. Aside from the 106.48 September 30 swing low, limited support is evident on the weekly timeframe until shaking hands with Quasimodo support at 105.35. A break north, however, highlights the 2018 yearly opening level at 112.65 as the next possible layer of resistance.
Daily action is also seen shaking hands with the said weekly resistances. The difference on this scale, nonetheless, is the downside targets. The 200/50-day SMAs (orange – 108.76/blue – 108.81) rest as potential support. Also note, the 50-day SMA appears poised to cross above the 200-day SMA, generally viewed as a bullish indicator (a Golden Cross).
Areas of consideration:
Quasimodo resistance on the H4 timeframe at 109.82 is likely of interest today. Knowing it boasts a strong connection to weekly resistances, it could produce a sizable move. Nevertheless, entering short from here entails going against the immediate uptrend. Therefore, traders may opt to wait for additional candlestick confirmation to form before pulling the trigger (entry/risk levels can be set according to this pattern).
USD/CAD:
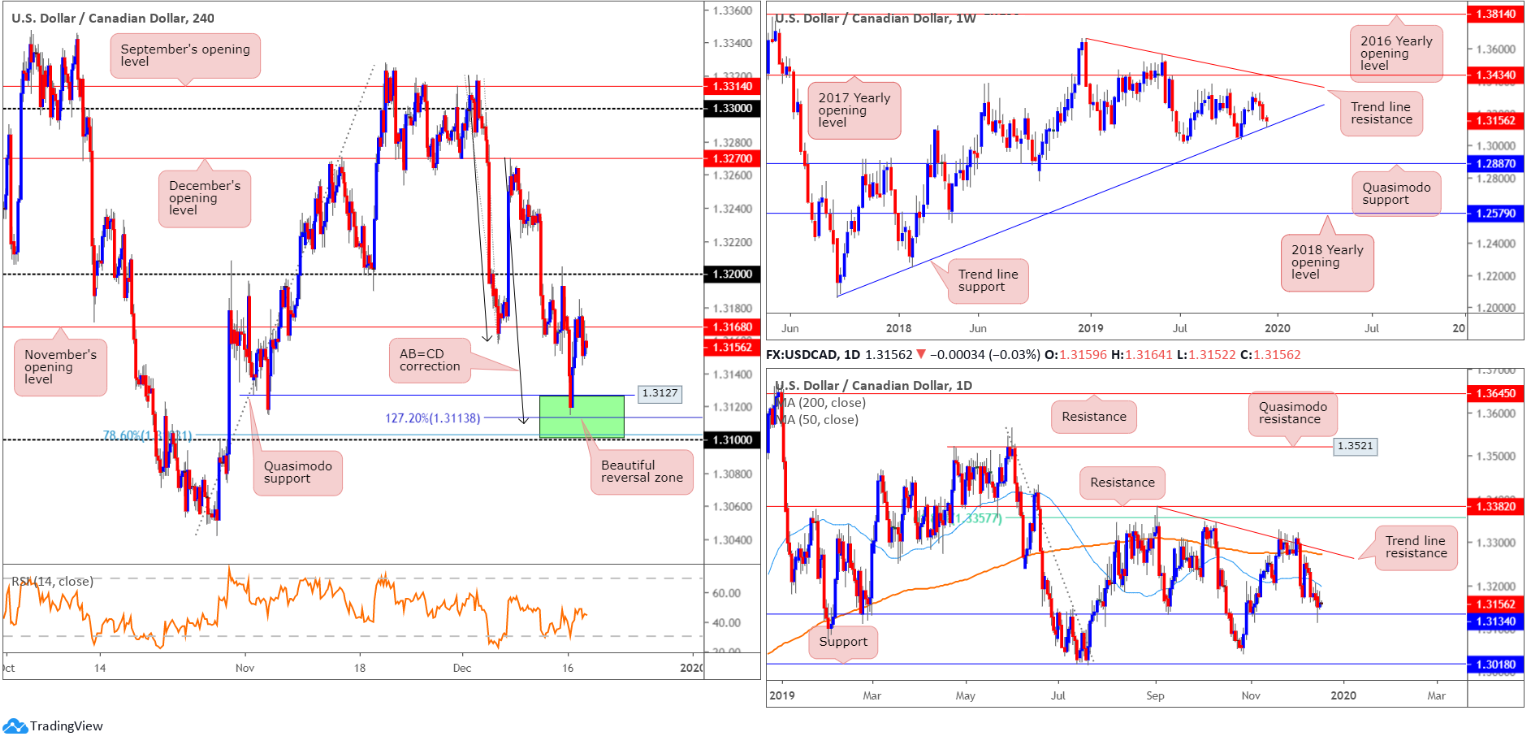
Following a slide to monthly bottoms of 1.3115 Monday, USD/CAD staged a modest recovery out of a H4 reversal zone at 1.31/1.3127 (green). Price failed to sustain gains beyond Tuesday’s 1.3185 session high, and turned lower to reclaim November’s opening level at 1.3168.
For traders who read Monday’s technical briefing you may recall the piece highlighted 1.31/1.3127 as a potential reversal zone on the H4 timeframe. Comprised of the 1.31 handle, a 127.2% Fibonacci extension at 1.3113, a 78.6% Fibonacci retracement ratio at 1.3103 and a symmetrical AB=CD bullish pattern at 1.3109 (black arrows), this area held ground and forced a move higher in recent trade.
What was also interesting about 1.31/1.3127 was its connection to the higher timeframes. As evident from the weekly timeframe, trend line support, extended from the low, intersected with the H4 base. Additionally, daily price found support a few points north of the H4 area at 1.3134.
In view of the confluence within the H4 reversal area, higher levels are still likely on the cards.
Areas of consideration:
Well done to any readers who managed a long from 1.31/1.3127. The initial upside objective, November’s opening level 1.3168, was recently hit and price is in the process of pulling back. The next port of call beyond here is the 1.32 handle, which coincides with the 50-day SMA (blue – 1.3197), applied to the daily timeframe.
USD/CHF:
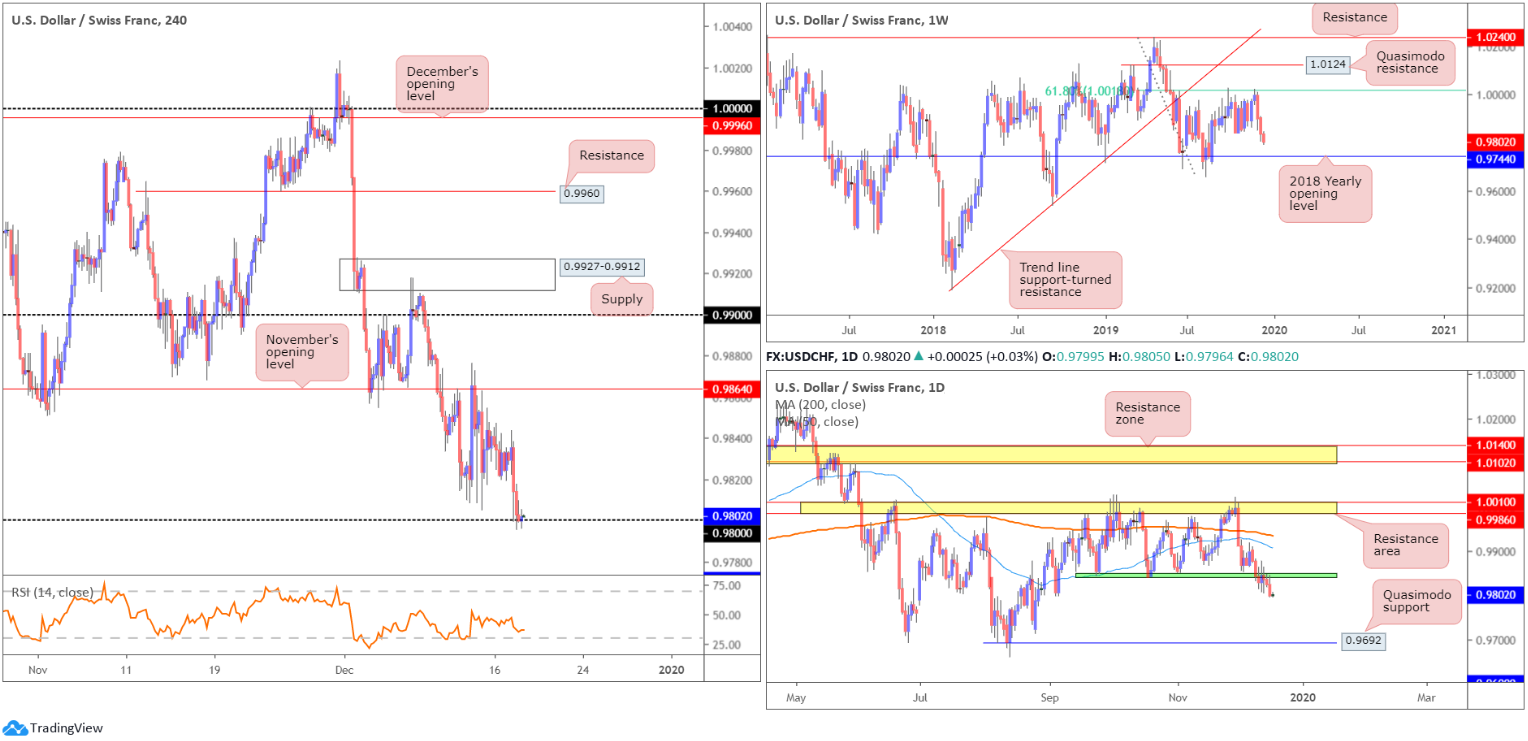
USD/CHF surrendered additional ground Tuesday, weighed by a sour market mood that favoured the safe-haven Swiss franc. In recent hours, buyers and sellers have been squaring off at the 0.98 handle, applied to the H4 timeframe.
Sub 0.98 exhibits scope to approach nearby support at 0.9771 (not visible on the screen). The key observation here, however, is the higher timeframes, with weekly and daily charts both showing room to explore lower ground.
Weekly price remains capped by a 61.8% Fibonacci retracement ratio at 1.0018. Of late, two decisive bearish candles formed, testing lows of 0.9805. Equally impressive is the 2018 yearly opening level at 0.9744. Capping downside since the beginning of the year, this level is considered the next support target on the weekly scale. According to the primary trend, price reflects a slightly bullish tone.
In conjunction with weekly flow, the lower edge of a 3-month consolidation at 0.9845ish gave way last week. 0.9744 is the primary downside target on the weekly timeframe, while on the daily timeframe, Quasimodo support coming in at 0.9692 appears a valid target.
Areas of consideration:
As weekly and daily timeframes suggest further downside could be in store, a H4 close beneath 0.98 is likely eyed. Although H4 support rests close by at 0.9771, this should not deter selling south of 0.98, given the room seen to move lower on the bigger picture. Traders have a choice of either selling the H4 breakout candle or, more conservatively, waiting and seeing if a retest at 0.98 forms before pulling the trigger. The latter can sometimes get traders in at unfavourable price levels; this is the cost of additional confirmation.
Dow Jones Industrial Average:
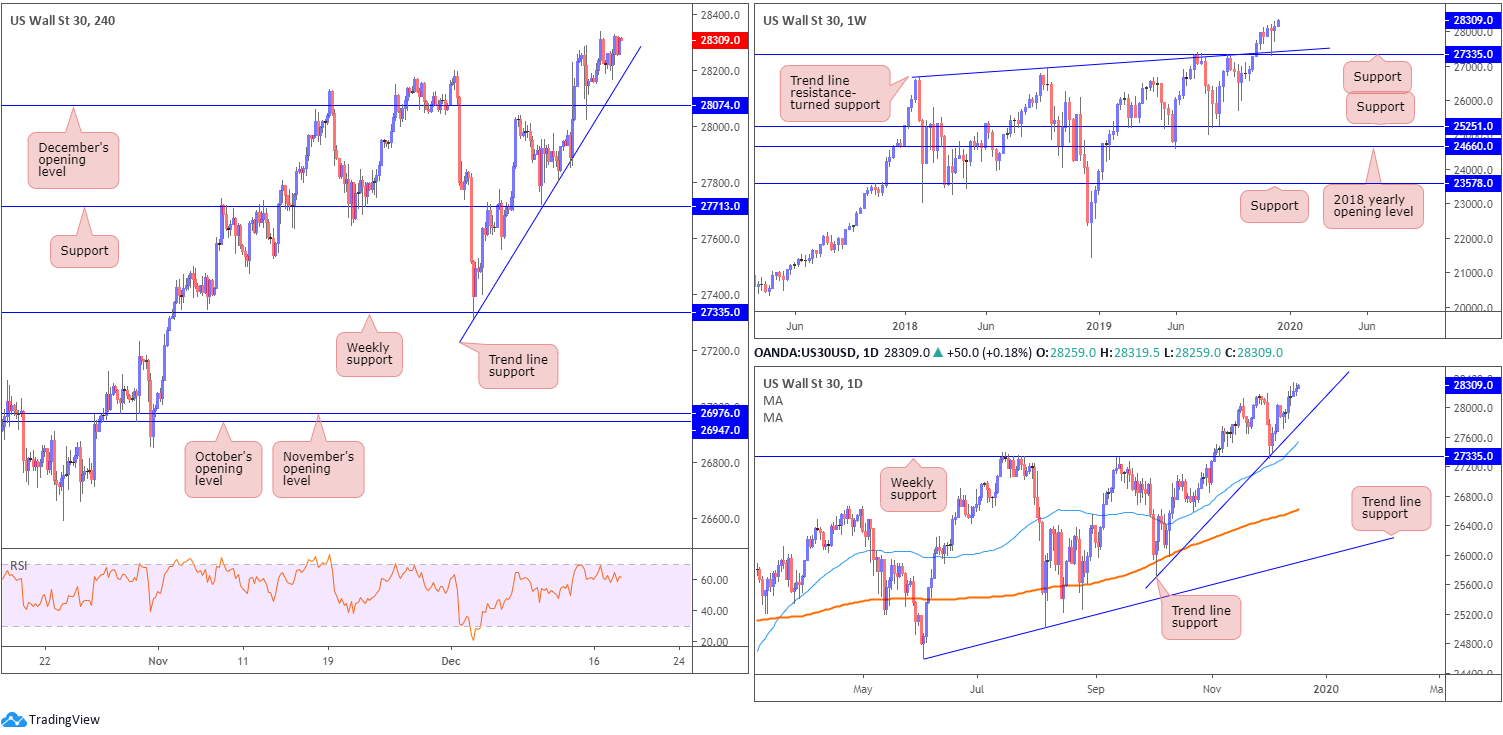
It was a reasonably quiet day in the equities space Tuesday, with the DJIA contained within the prior day’s range between 28339/28152. The Dow Jones Industrial Average added 31.27 points, or 0.11%, the S&P 500 advanced 1.07 points, or 0.03% and the tech-heavy Nasdaq 100 added 5.37 points, or 0.06%.
Technically, structure remains unchanged.
H4 trend line support, extended from the low 27314, remains close by, with a break exposing December’s opening level at 28074. It might also interest some traders that the relative strength index (RSI) recently struck the 70.00 overbought value and turned lower.
Weekly price continues to trade north of support drawn from 27335, along with trend line support etched from the high 26670. This follows a strong weekly hammer candlestick formation (considered a buy signal at troughs), formed the week prior. Meanwhile, on the daily timeframe, trend line support, extended from the low 25710, could offer the market a floor this week. A break lower, nonetheless, may draw in the 50-day SMA (blue – 27541) and then weekly support mentioned above at 27335.
Areas of consideration:
The fact we’re trading not too far off record peaks, and entrenched within a monstrous uptrend, this clearly remains a buyers’ market right now. H4 trend line support highlighted above could very well hold price action higher today/this week, though given the close proximity of December’s opening level at 28074 threatening a possible fakeout, traders will likely wait for additional candlestick confirmation before committing to a position (entry/risk levels can be determined according to this pattern).
XAU/USD (GOLD):
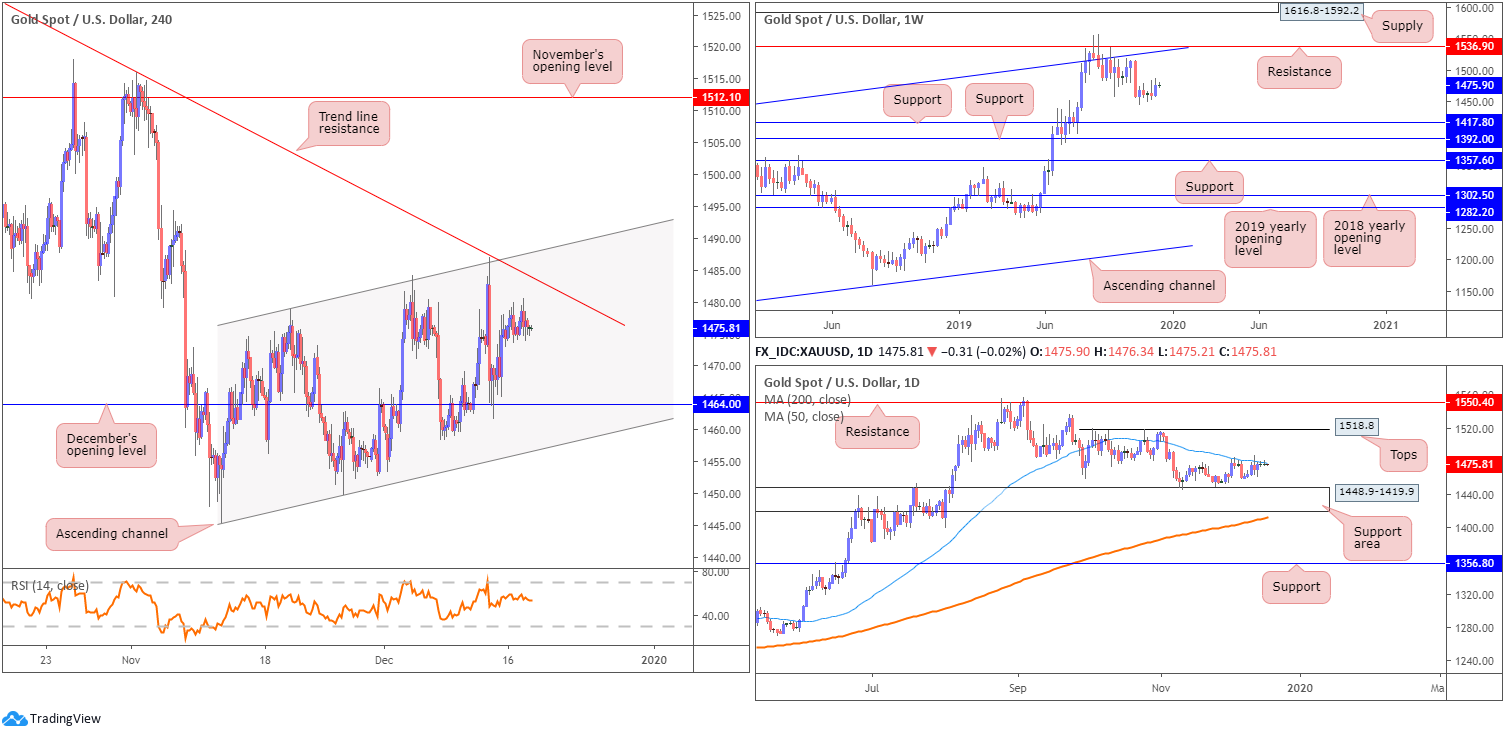
Bullion remained subdued for a second successive session, consequently chalking up back-to-back daily indecision candles. Unmoved on the week, the following piece will echo thoughts put forward in Tuesday’s technical briefing.
Following a near-to-the-point test of H4 channel resistance, taken from the high 1478.8, gold retested December’s opening level at 1464.4 and held north of here into the weekly close.
On more of a broader perspective, since connecting with resistance at 1536.9 and channel resistance, extended from the high 1375.1, weekly price has been in a mild decline. Further downside from here potentially sets the stage for a move towards two layers of support at 1392.0 and 1417.8. Overall, however, the primary trend has faced a northerly trajectory since bottoming in early December 2015.
The 50-day SMA (blue – 1477.6) continues to offer resistance on the daily timeframe, hampering upside from the support area coming in at 1448.9-1419.9. A break through the current SMA could lead to an attack at tops around 1518.8, closely followed by resistance at 1550.4. Traders may also benefit in noting the 200-day SMA (orange – 1411.9) is seen crawling north just beneath the aforementioned support zone.
Areas of consideration:
As daily price remains capped beneath the 50-day SMA, additional short entries at the current H4 trend line resistance may be an option. However, with limited confluence in view, aside from the 50-day SMA, traders are urged to consider confirmed entries, candlestick confirmation, for example. This not only helps identify seller intent, it also provides entry and risk levels to work with.
(italics represents previous analysis)
The accuracy, completeness and timeliness of the information contained on this site cannot be guaranteed. IC Markets does not warranty, guarantee or make any representations, or assume any liability regarding financial results based on the use of the information in the site.
News, views, opinions, recommendations and other information obtained from sources outside of www.icmarkets.com.au, used in this site are believed to be reliable, but we cannot guarantee their accuracy or completeness. All such information is subject to change at any time without notice. IC Markets assumes no responsibility for the content of any linked site.
The fact that such links may exist does not indicate approval or endorsement of any material contained on any linked site. IC Markets is not liable for any harm caused by the transmission, through accessing the services or information on this site, of a computer virus, or other computer code or programming device that might be used to access, delete, damage, disable, disrupt or otherwise impede in any manner, the operation of the site or of any user’s software, hardware, data or property.


