
EUR/USD:
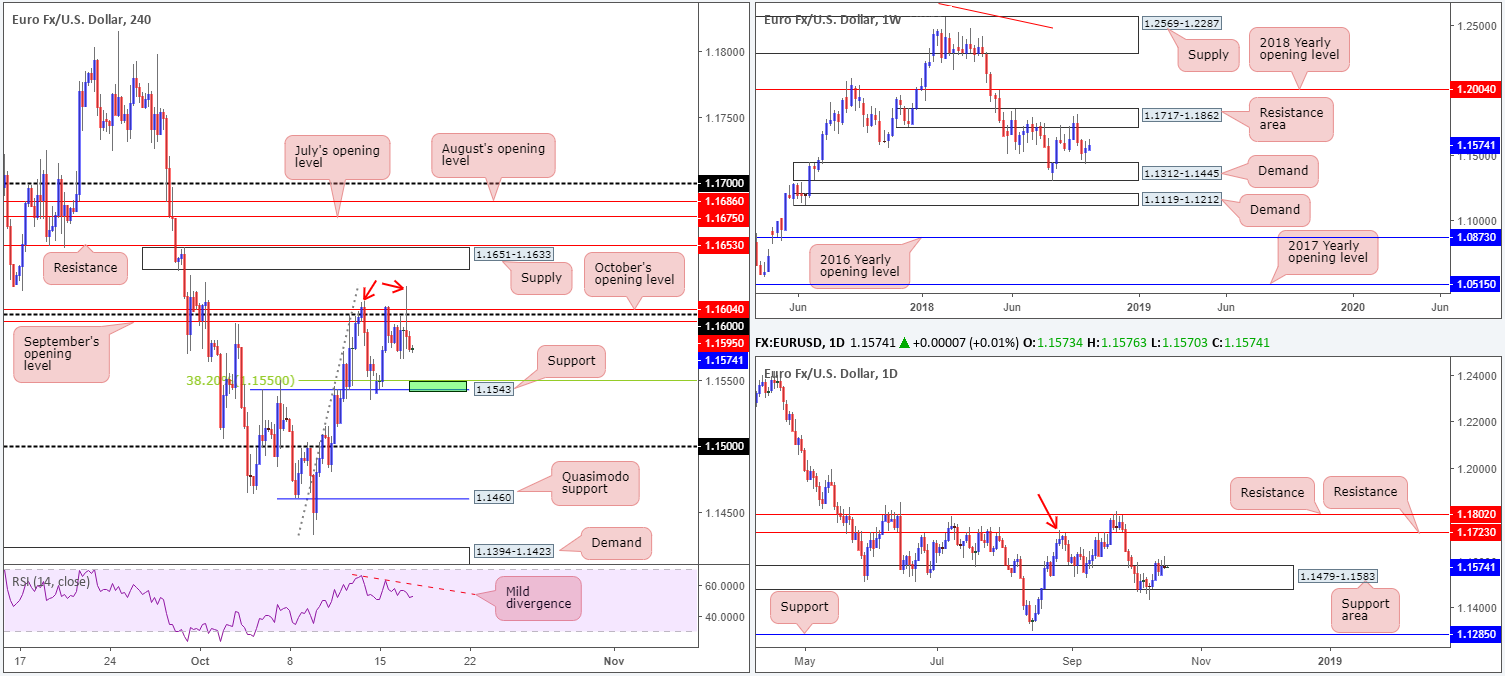
Despite an earnest effort to overthrow 1.16 (and surrounding monthly opening levels from October and September at 1.1604 and 1.1595, respectively) on Tuesday, the shared currency failed to sustain gains beyond 1.1621, consequently concluding the day more or less unchanged.
In light of yesterday’s push to fresh highs (red arrows), another retest of H4 support at 1.1543 (unites with a 38.2% Fib support at 1.1550) might be on the cards today for a possible long (small green H4 zone). Also worth acknowledging on this scale is the RSI displaying mild divergence just south of its overbought value.
Higher-timeframe technicals bring light to a weekly demand at 1.1312-1.1445, which, as you can see, is holding ground after a two-week bearish stint out of a neighbouring resistance area at 1.1717-1.1862. This is now considered a ranging market on this scale.
The daily support area at 1.1479-1.1583, although suffering a sizable breach to its lower edge in the early stages of last week in the shape of a bullish-pin-bar formation, remains in the fold. Bringing with it a notable history dating back as far as October 2017, the next upside target on this scale can be seen at resistance drawn from 1.1723 (sited within the walls of the noted weekly resistance area, as well as representing a nearby Quasimodo resistance based on the high marked with a red arrow at 1.1733). Traders may also want to note on this timeframe a bearish pin-bar formation took shape as a result of yesterday’s movement.
Areas of consideration:
As highlighted above, H4 support at 1.1543 and its nearby a 38.2% H4 Fib support at 1.1550 is an area worth watching for a bounce back towards the 1.16 region. Waiting for additional candlestick confirmation before pulling the trigger, however, is recommended.
In the event we eventually do conquer 1.16 to the upside (a H4 close), space to maneuver on the H4 timeframe is limited. Supply at 1.1651-1.1633, shadowed closely by resistance marked at 1.1653, could hinder buying from an intraday perspective. These areas are closely trailed by two monthly opening levels from August and July at 1.1686 and 1.1675, respectively.
Should traders avoid executing long positions above 1.16? Absolutely not! Higher-timeframe direction, for the most part, is on our side. Just ensure risk/reward parameters are kept in mind as there’s little over 30 pips of room to play with between 1.16 and the lower edge of H4 supply at 1.1651-1.1633.
Today’s data points: EU economic summit; German Buba President Weidmann speaks; US housing figures; FOMC member Brainard speaks; FOMC meeting minutes; Treasury currency report.
GBP/USD:
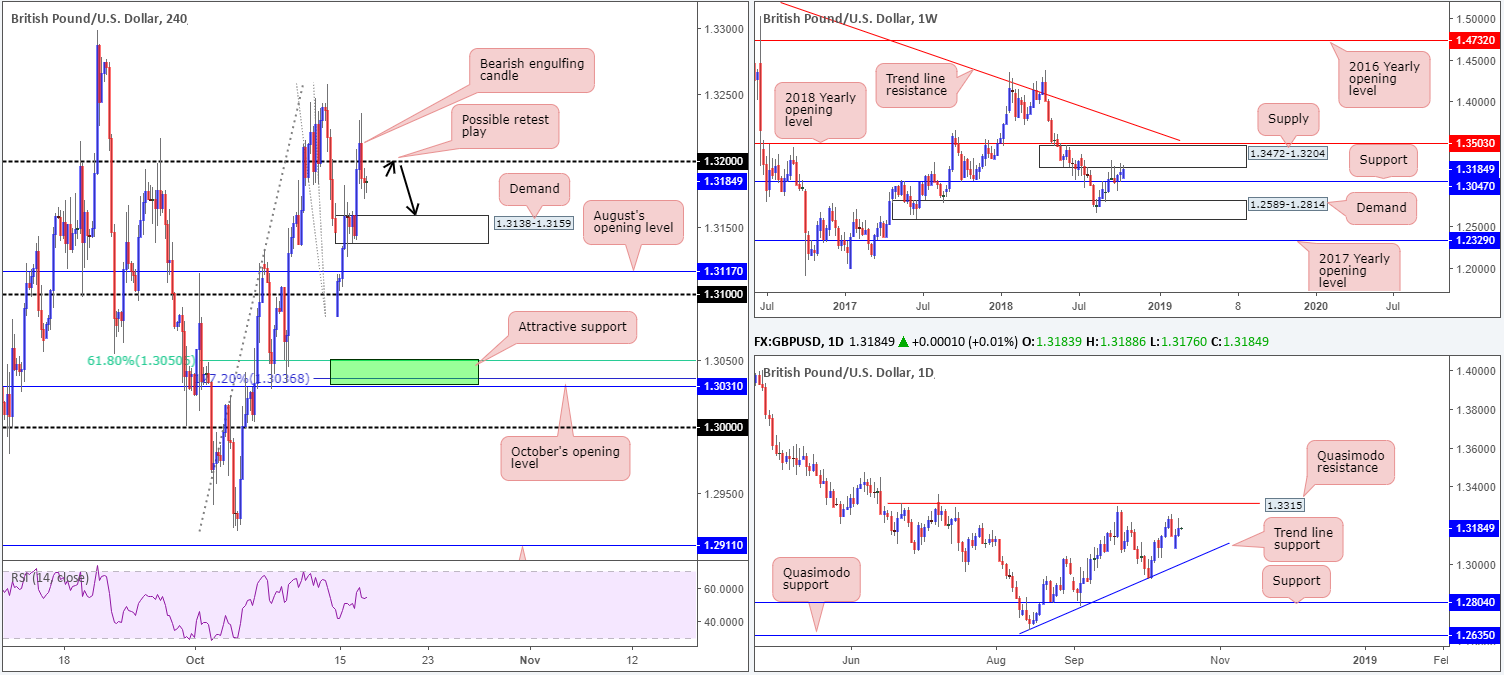
Underpinned in the form of upbeat UK average earnings as well as hopes for a Brexit deal, cable explored ground beyond its 1.32 handle yesterday, reaching highs of 1.3236. Sentiment, however, turned sour going into US hours, chalking up a H4 bearish engulfing pattern and closing the day out sub 1.32.
EU Brexit Negotiator Barnier stated ‘we will work seriously for a Brexit deal in the coming weeks’, though EU Council President Tusk was more explicit, maintaining there were no grounds for optimism in Brexit talks at the summit today.
H4 technicals show demand resting nearby at 1.3138-1.3159. This is considered a reasonably significant base given it was likely here the decision was made to push through 1.32. A break of 1.3138-1.3159 to the downside has August’s opening level at 1.3117 and the nearby 1.31 handle to target.
The story on the weekly timeframe positions the market around the underside of notable supply marked at 1.3472-1.3204. This could be sufficient enough to pull GBP lower towards its neighbouring support at 1.3047 (which happens to converge nicely with an area of H4 support [green] at 1.3031-1.3050). A closer look at price action on the daily chart draws attention to a Quasimodo resistance at 1.3315 and an ascending trend line support (etched from the low 1.2661).
Areas of consideration:
In view of the H4 bearish engulfing candle, along with weekly price shaking hands with supply, further downside is likely to take shape today/this week.
A retest of 1.32 as resistance, supported with lower-timeframe candlestick confirmation (stop/entry parameters taken from this structure), could be something worth watching for today, targeting H4 demand mentioned above at 1.3138-1.3159 as the initial take-profit zone. The ultimate target, nevertheless, falls in around the green area of H4 support highlighted above at 1.3031-1.3050.
Today’s data points: UK inflation figures; MPC member Broadbent speaks; US housing figures; FOMC member Brainard speaks; FOMC meeting minutes; Treasury currency report.
AUD/USD:
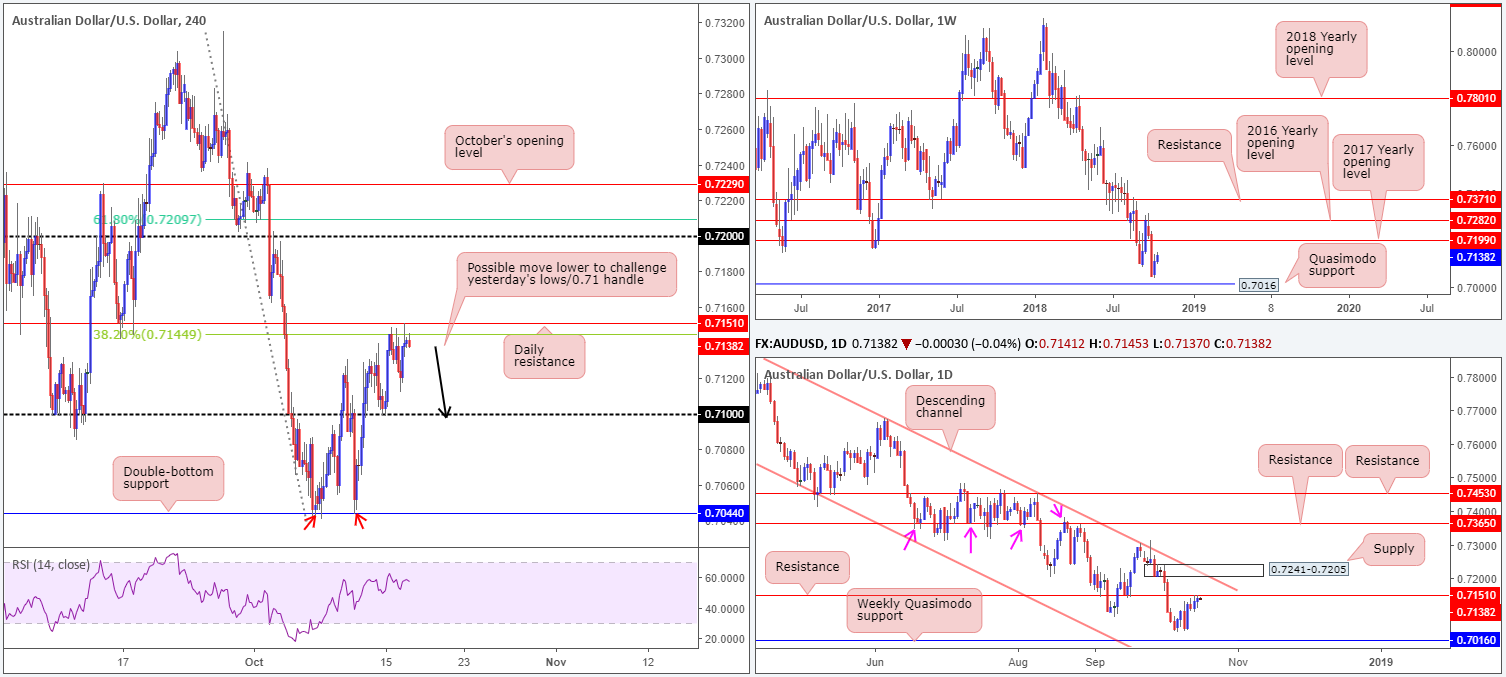
During Tuesday’s Asian session, the market witnessed a dip to lows of 0.7112. It was at this point, London’s opening bell, we observed buyers enter the fray, eventually testing daily resistance coming in at 0.7151 amid US hours. This was a take-profit target for those long off 0.71 – well done to any of our readers who hung in there!
As is evident from the H4 timeframe, not only do we have daily resistance in play, a 38.2% H4 Fib resistance at 0.7144 is also in motion. Technically speaking, this could lead to a move lower today, potentially breaking through yesterday’s low and retesting 0.71.
In the event price fails to push lower and conquers daily resistance, H4 players will likely be honing in on the 0.72 region. Daily action, on the other hand, will have has eyes on supply from 0.7241-0.7205, which happens to be positioned just above north of the 2017 yearly level on the weekly timeframe at 0.7199, and also ties in nicely with a long-term daily channel resistance (etched from the high 0.8135). Therefore, plenty of resistance to look forward to around 0.72.
Areas of consideration:
Intraday traders are likely looking for price to at least dip to yesterday’s lows before considering longs in this market – best, of course, would be a fake of the said lows to 0.71. A H4/H1 bearish candlestick formation printed at current price would, technically speaking, likely prompt further downside. Not only will this provide traders stop/entry levels, it’ll also display bearish intent.
Today’s data points: US housing figures; FOMC member Brainard speaks; FOMC meeting minutes; Treasury currency report.
USD/JPY:
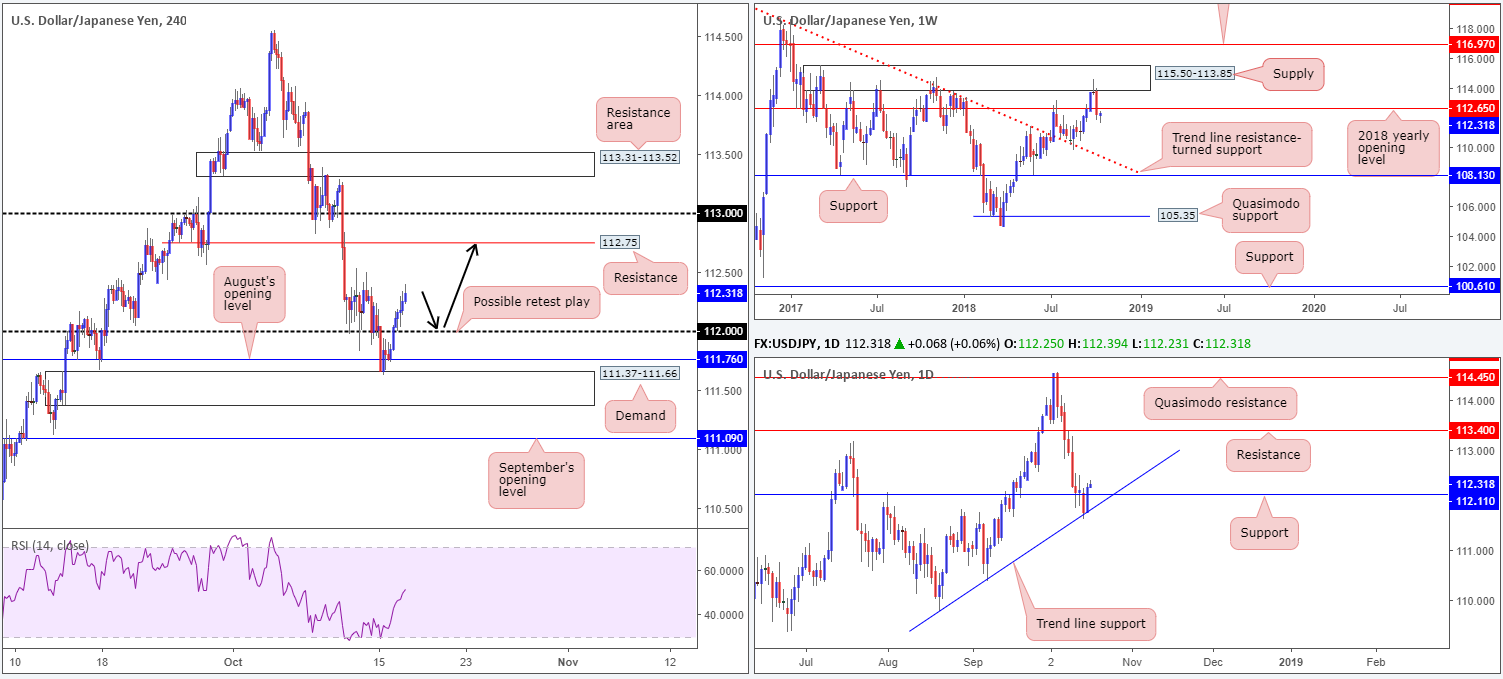
Bolstered by robust movement in US equities, along with H4 demand at 111.37-111.66 and a daily trend line support (etched from the low 109.77), the USD/JPY firmly reclaimed its 112 handle on Tuesday.
Aside from tops seen around the 112.50ish neighbourhood on the H4, intraday traders are likely honing in on resistance plotted at 112.75. Despite this, traders need to be prepared for the possibility of price stumbling prior to reaching this level, given 10 pips south of here we have the 2018 yearly opening level at 112.65 to contend with on the weekly timeframe. Contrary to both weekly and H4 structure, daily flow, after retaking its resistance at 112.11 (now acting support), has eyes on resistance drawn from 113.40.
Areas of consideration:
Seeing all three timeframes exhibit space to press for higher ground, a retest of 112 (preferably in the shape of a H4 bullish candlestick formation as this will provide traders both an entry and stop level) as support may be on the cards (black arrows), targeting the underside of the 2018 yearly opening level at 112.65 mentioned above on the weekly timeframe.
The one caveat to this forecast, however, is price MUST not test 112.65 prior to retesting 112. This could bring in strong weekly sellers, therefore invalidating longs.
Today’s data points: US housing figures; FOMC member Brainard speaks; FOMC meeting minutes; Treasury currency report.
USD/CAD:
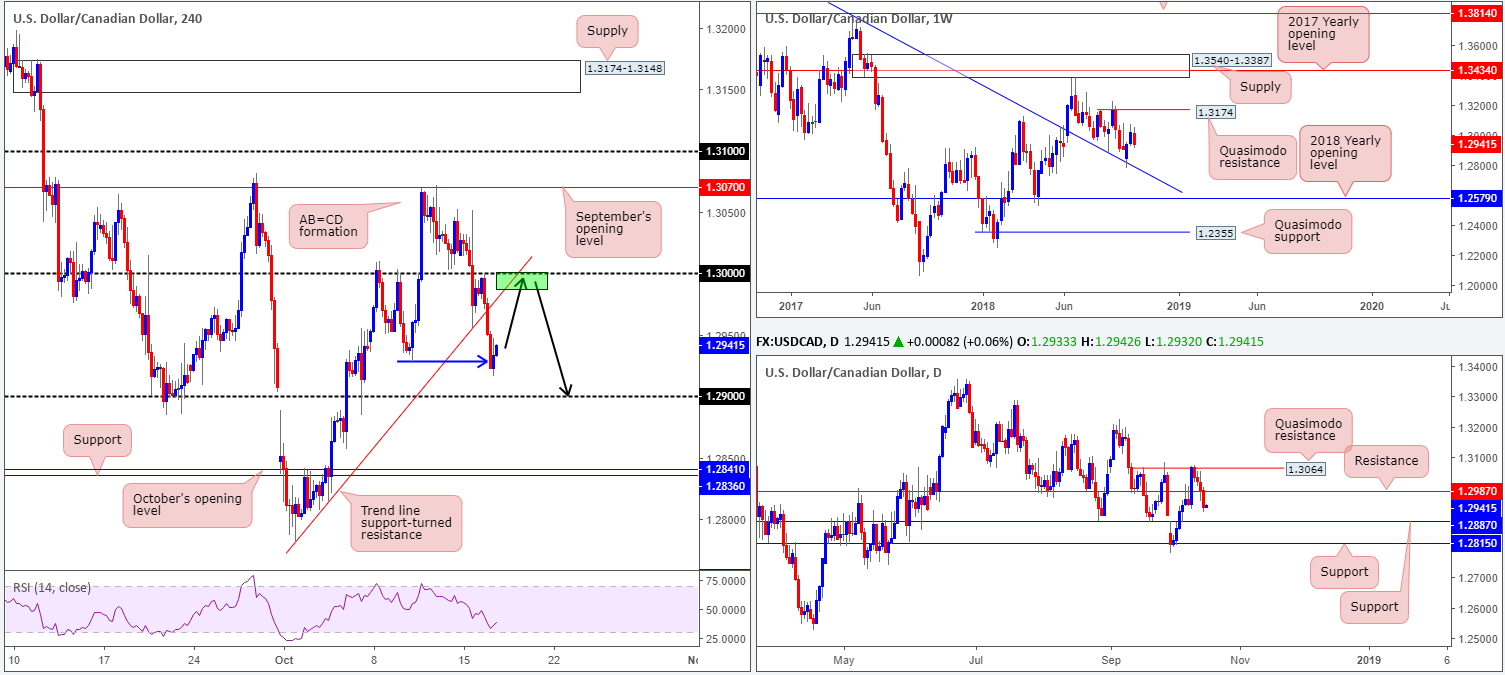
The US dollar ceded further ground to its Canadian counterpart on Tuesday, as advancing crude prices bolstered the CAD.
The market lost its footing after the H4 candles came within a pip of retesting the underside of the key figure 1.30 in the shape of a bearish engulfing candle. The October 10 low of 1.2926 was, as you can see, firmly taken out as a result of yesterday’s move lower, potentially clearing the pathway south towards its 1.29 handle.
Scope for a retest of 1.30, alongside its connecting H4 trend line support-turned resistance (taken from the low 1.2782), is an option today (black arrows). Another key point to note is daily support-turned resistance at 1.2987. This level, assuming the USD/CAD rate increases today, may obstruct price from testing 1.30. Therefore, the sell zone should be drawn between 1.30/1.2987, with a target objective set at 1.29, followed closely by daily support at 1.2887.
Areas of consideration:
The H4 green area marked at 1.30/1.2987 is considered a high-probability sell zone for today’s sessions.
Aggressive traders will likely enter short from 1.2987 with stops plotted a few pips above 1.30. This is a chancy play, though could work out handsomely should we reach 1.29.
Conservative traders, on the other hand, may opt for entry based on additional H4 candlestick confirmation: a bearish pin-bar formation or engulfing pattern etc. Besides offering traders entry/stop parameters, a bearish pattern out of the H4 sell zone helps ‘confirm’ seller intent.
Today’s data points: US housing figures; FOMC member Brainard speaks; FOMC meeting minutes; Treasury currency report; Canadian manufacturing sales m/m; Crude oil inventories.
USD/CHF:
Coming in from the top this morning, traders are reminded weekly supply at 0.9984-0.9894 remains in the fight. Additional selling out of this zone could see the market decline as far south as its 2018 yearly opening level at 0.9744. Traders may also wish to pencil in the 2016 yearly opening level at 1.0029 in the event we push for higher ground.
On the other side of the spectrum, daily movement is seen bouncing from the top edge of a support area coming in at 0.9866-0.9830. Assuming further upside is observed, resistance at 0.9986 (sited two pips beyond the current weekly supply) is the next obvious barrier on the hit list.
Intraday flow on the H4 timeframe, however, recently reclaimed 0.99+ status. While technically this is considered a bullish cue, caution is advised. Just ahead we have two close-knit supply areas seen at 0.9968-0.9943 and 0.9933-0.9916. Not exactly ideal buying conditions!
Areas of consideration:
Based on the above reading, neither a long nor short seems attractive at this point (see points in bold).
Irrespective of the direction one selects today, opposing structure is clearly seen.
Today’s data points: US housing figures; FOMC member Brainard speaks; FOMC meeting minutes; Treasury currency report.

Dow Jones Industrial Average:
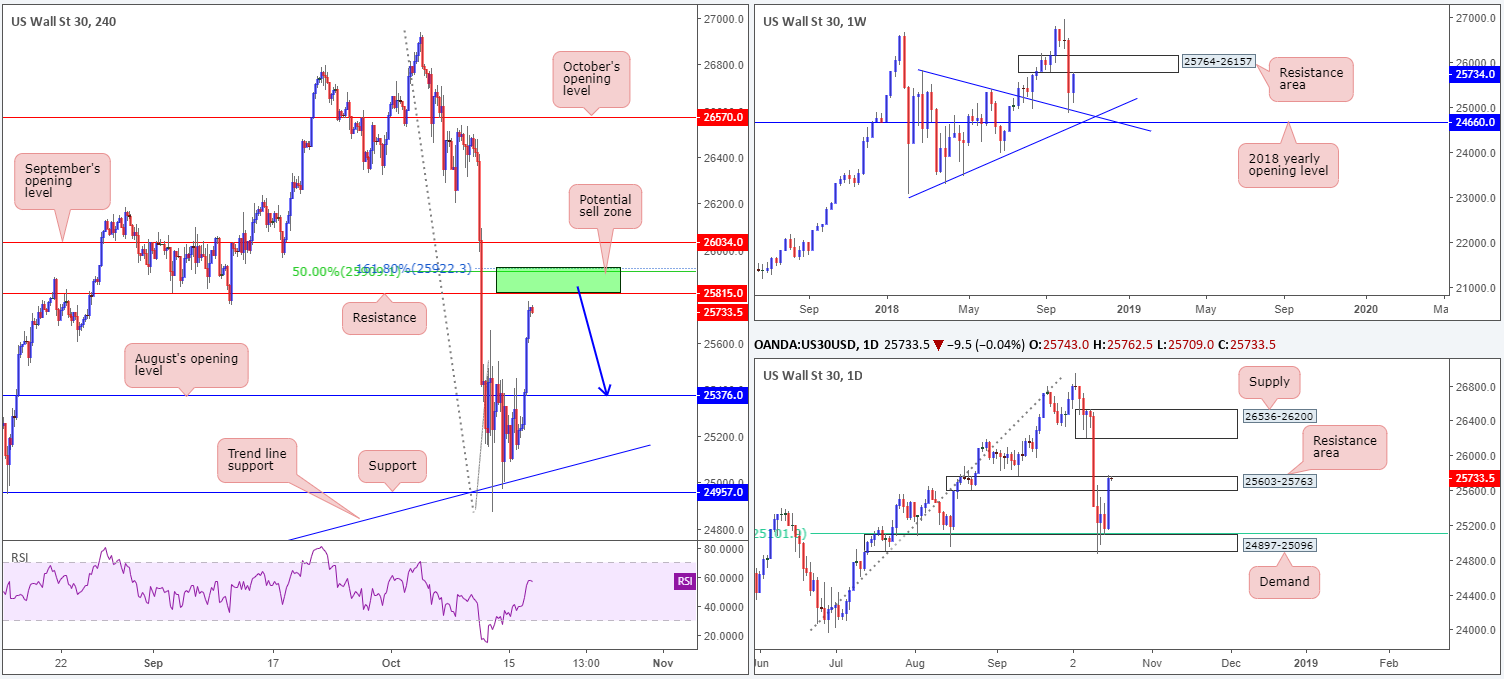
Following heavy losses during last week’s collapse, the Dow Jones Industrial Average printed an impressive recovery on Tuesday, up 2.25% on the day. Led by technology and healthcare sectors, the H4 candles reclaimed its August’s opening level at 25376 and concluded trade within a stone’s throw away from resistance marked at 25815.
What’s also notable from a technical perspective is weekly price recently crossed swords with the underside of a demand-turned resistance area at 25764-26157. In addition to this, we can also see daily price flirting with the top edge of a demand-turned resistance area at 25603-25763.
Areas of consideration:
The H4 resistance mentioned above at 25815 – coupled with a 161.8% H4 Fib ext. point at 25922, a 50.0% H4 resistance value at 25909 and current higher-timeframe resistance areas – forms a high-probability sell zone (Green). In the event this area holds and price action heads for lower ground, the first port of call will likely be August’s opening level highlighted above at 25376. In regard to stop-loss placement, a couple of points above 25922 should suffice. Conservative traders, on the other hand, may want to consider waiting for additional candlestick confirmation before pulling the trigger, as there’s always a chance a fakeout north may be seen before rotating lower.
Today’s data points: US housing figures; FOMC member Brainard speaks; FOMC meeting minutes; Treasury currency report.
XAU/USD (Gold):
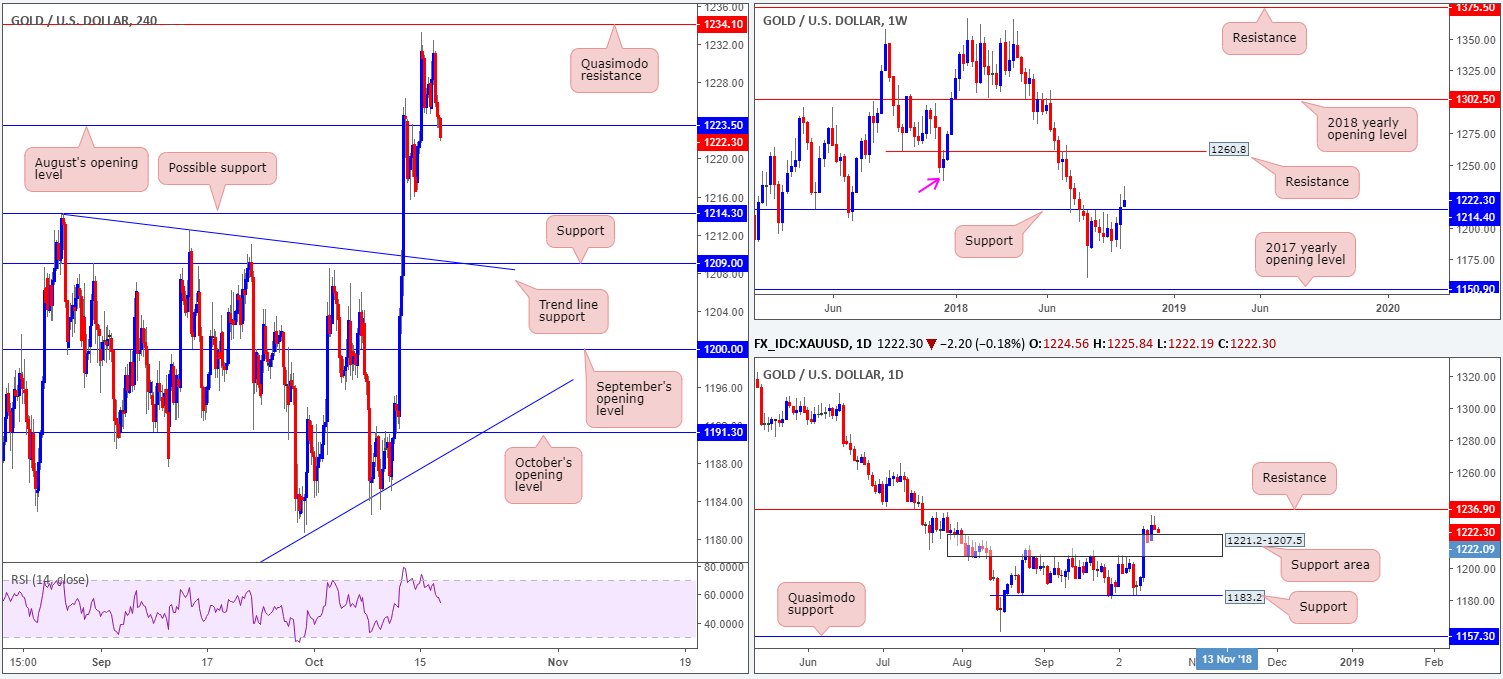
The gold market surrendered a portion of Monday’s advance on Tuesday, shaping a nice-looking daily bearish pin-bar formation. On this scale, a nearby support area rests at 1221.2-1207.5, with resistance not entering the fold until around 1236.9.
In addition to this, recent hours brought H4 price mildly beneath August’s opening level at 1223.5, which possibly opens up the stage to further downside today towards support at 1214.3 (August 28 high), and also 1209.0 (intersects with a trend line resistance-turned support taken from the high 1214.3).
Note weekly support at 1214.4 lines up beautifully with H4 support mentioned above at 1214.3. The next upside target on the weekly scale does not come into view until swing resistance is evident at 1236.6 (pink arrow – essentially the same level as daily resistance mentioned above at 1236.9), though the majority of eyes on the weekly scale are likely honed in on resistance chiseled in at 1260.8.
Areas of consideration:
On the whole, further upside is still favoured given where we’re positioned on the weekly/daily timeframes at the moment.
To that end, longs from H4 support emerging from 1214.3 (August 28 high), and also at 1209.0, could be an option today. Note both levels are housed within the aforementioned daily support area.
Judging which support is worthy of a long is difficult as both are viable. To help decide, traders may want to consider waiting for H4 candlestick confirmation to take shape before pulling the trigger. Not only will this provide entry/stop parameters, it’ll also help display buyer intent.
The use of the site is agreement that the site is for informational and educational purposes only and does not constitute advice in any form in the furtherance of any trade or trading decisions.
The accuracy, completeness and timeliness of the information contained on this site cannot be guaranteed. IC Markets does not warranty, guarantee or make any representations, or assume any liability with regard to financial results based on the use of the information in the site.
News, views, opinions, recommendations and other information obtained from sources outside of www.icmarkets.com.au, used in this site are believed to be reliable, but we cannot guarantee their accuracy or completeness. All such information is subject to change at any time without notice. IC Markets assumes no responsibility for the content of any linked site. The fact that such links may exist does not indicate approval or endorsement of any material contained on any linked site.
IC Markets is not liable for any harm caused by the transmission, through accessing the services or information on this site, of a computer virus, or other computer code or programming device that might be used to access, delete, damage, disable, disrupt or otherwise impede in any manner, the operation of the site or of any user’s software, hardware, data or property.


