
Key risk events today:
UK Inflation; Canada Inflation; US Building Permits; Fed Chair Powell Testifies.
(Previous analysis as well as outside sources – italics).
EUR/USD:
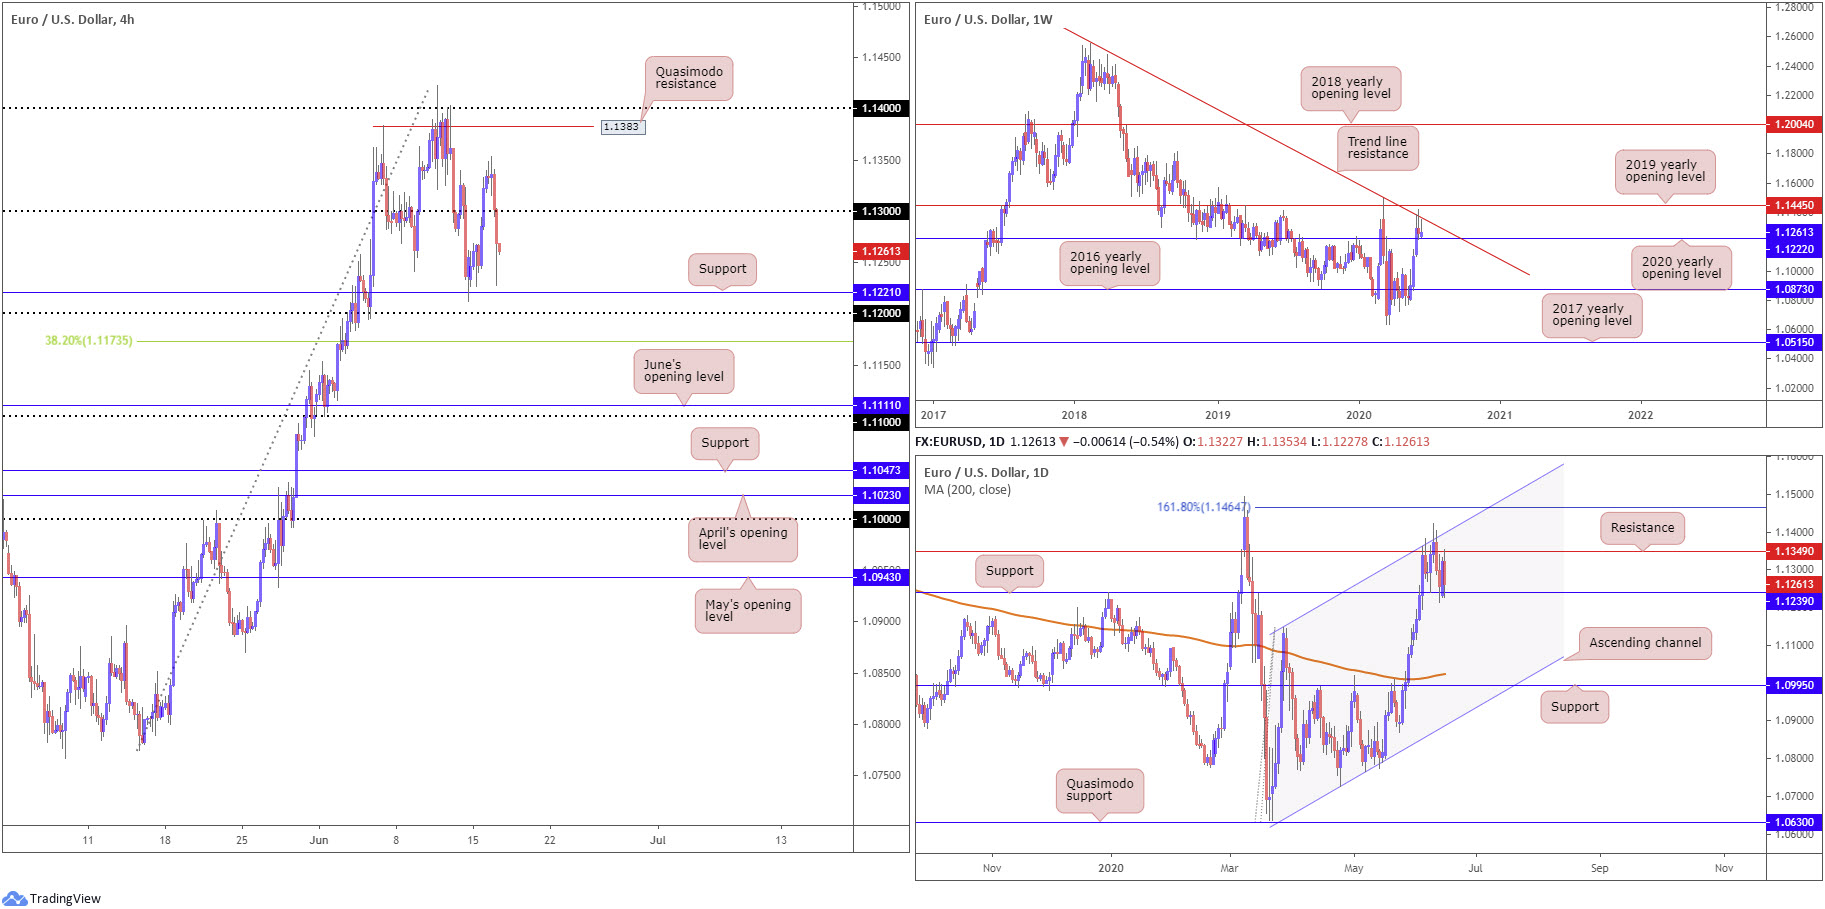
Unable to withstand the dollar’s resurgence – the US dollar index jolted above 97.00 in wake of a pronounced rebound in US retail sales – Europe’s shared currency failed to hold 1.1350 Tuesday, unwinding through 1.13 on the H4.
EUR/USD H4 movement came within touching distance of reaching support at 1.1221 (a prior Quasimodo resistance), before marginally recoiling. This level joins closely with the 1.12 handle and 38.2% Fibonacci retracement ratio at 1.1173. Above 1.13, assuming a breach of 1.1350, traders can look forward to Quasimodo resistance at 1.1383, followed by 1.14.
Across the page, buyers and sellers continue to battle for position on the weekly timeframe between the 2020 yearly opening level at 1.1222 and long-standing trend line resistance, extended from the high 1.2555. A strong bid could override the aforementioned trend line resistance for the 2019 yearly opening level at 1.1445, while beneath 1.1222 we have the 2016 yearly opening level at 1.0873 noted as support. In view of the long-term trend, the pair has remained under pressure since topping in early February 2018.
Buyers and sellers are also going toe to toe on the daily timeframe between resistance at 1.1349, a level positioned closely with channel resistance, taken from the high 1.1147, and support from 1.1239. A break of this support would be quite significant, perhaps exposing downside to the 200-day SMA (orange – 1.1024), which is on the point of turning higher after drifting south for several months.
Areas of consideration:
The combination of H4 support at 1.1221, the round number 1.12 and 38.2% Fibonacci retracement ratio at 1.1173 offers a frame to base some form of support today. This area also benefits from weekly convergence at 1.1222 and daily support a touch above at 1.1239 (which was recently tested).
Conservative traders will look for at least a H4 bullish candlestick signal to form within the said zone before pulling the trigger. Not only does this help identify buyer intent, it provides entry and risk levels to work with.
GBP/USD:
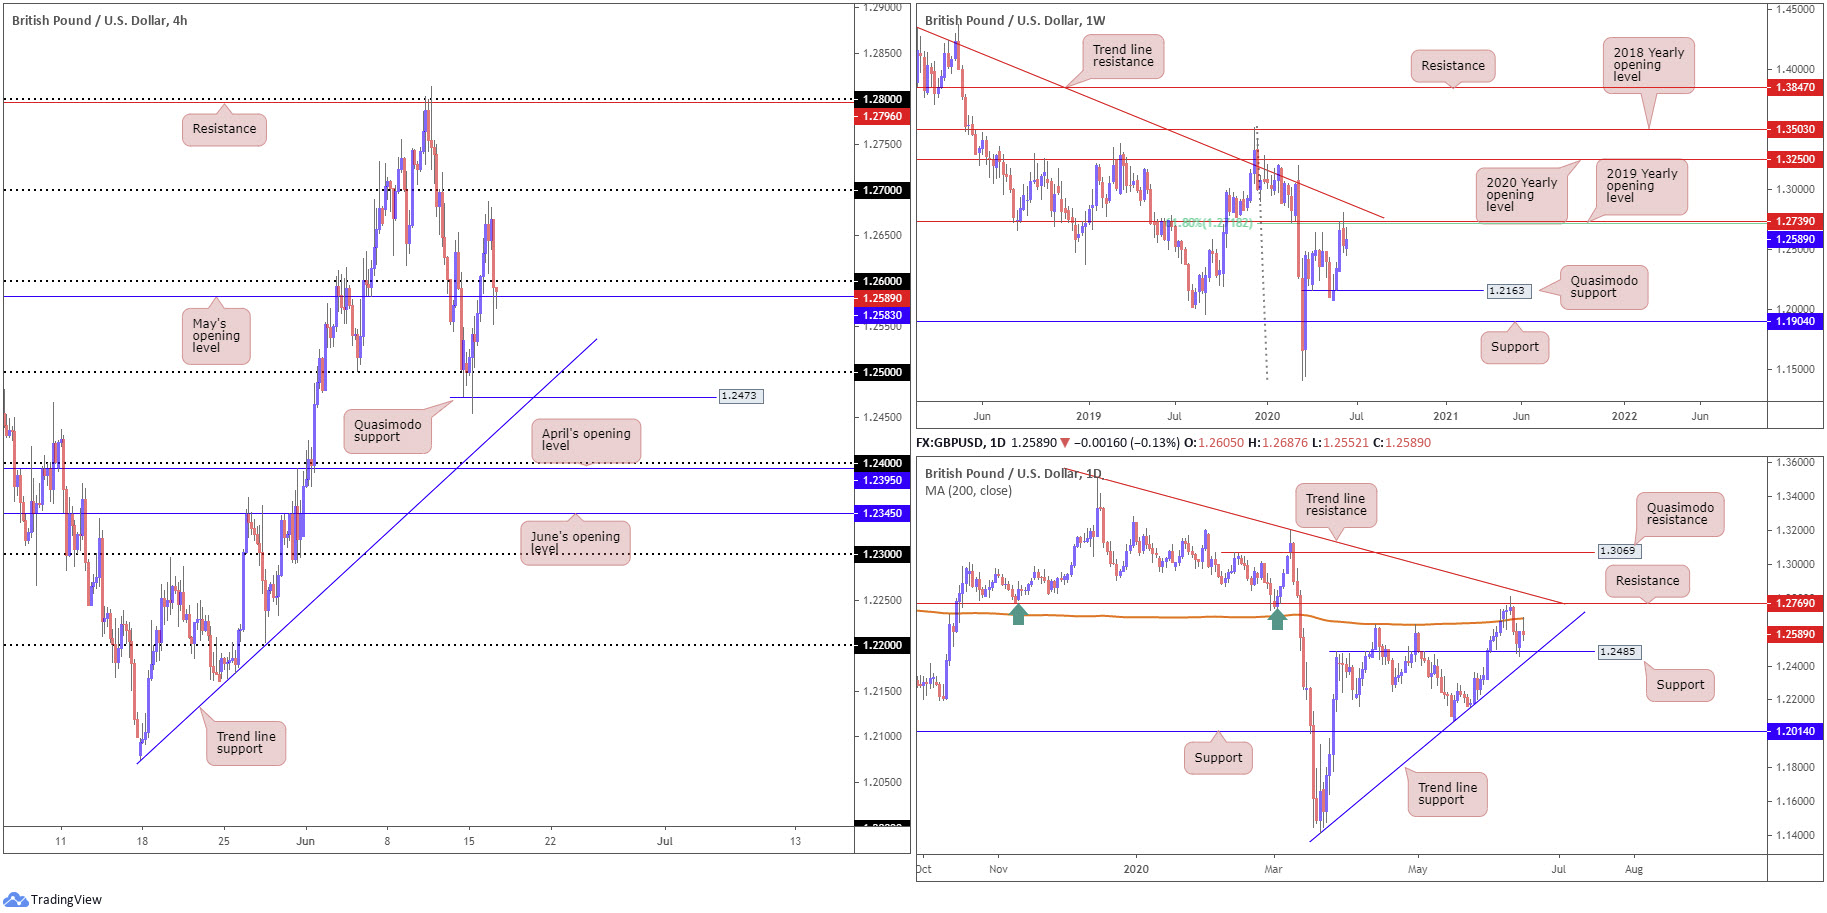
Finding thin air ahead of the 1.27 handle left the round number unchallenged Tuesday, dipping into US hours and overrunning orders at 1.26. H4 price is currently feeling its way around May’s opening level at 1.2583, which so far has been unable to generate much upside momentum. The 1.25 handle sits as the next downside target, closely merging with trend line support, taken from the low 1.2075, and Quasimodo support coming in at 1.2473.
In terms of the weekly timeframe, price action continues to languish under the 61.8% Fibonacci retracement ratio at 1.2718 and 2019 yearly opening level at 1.2739. It should also be emphasised these levels are positioned beneath a long-term trend line resistance, extended from the high 1.5930. Increased selling from here, in line with the overall trend, throws Quasimodo support at 1.2163 in the pot as a feasible downside target on this timeframe.
The story on the daily timeframe, a day after putting forward a strong rebound off support at 1.2485, had price action shake hands with the 200-day SMA (orange – 1.2681). Although we printed a reasonably solid rejection from the SMA yesterday, traders will note resistance at 1.2769, followed by trend line resistance, extended from the high 1.3514.
Areas of consideration:
H4 price closing under 1.26 may interest sellers, particularly if we also close below May’s opening level at 1.2583. From that point, the technical picture suggests a move to 1.25 could be on the cards.
Another scenario worthy of the watchlist is, should we run lower today, a mild fakeout through the 1.25 handle could emerge. This would potentially trip stops and draw in daily buyers from support at 1.2485. A H4 close back above 1.25 may, therefore, be considered a buy signal.
AUD/USD:
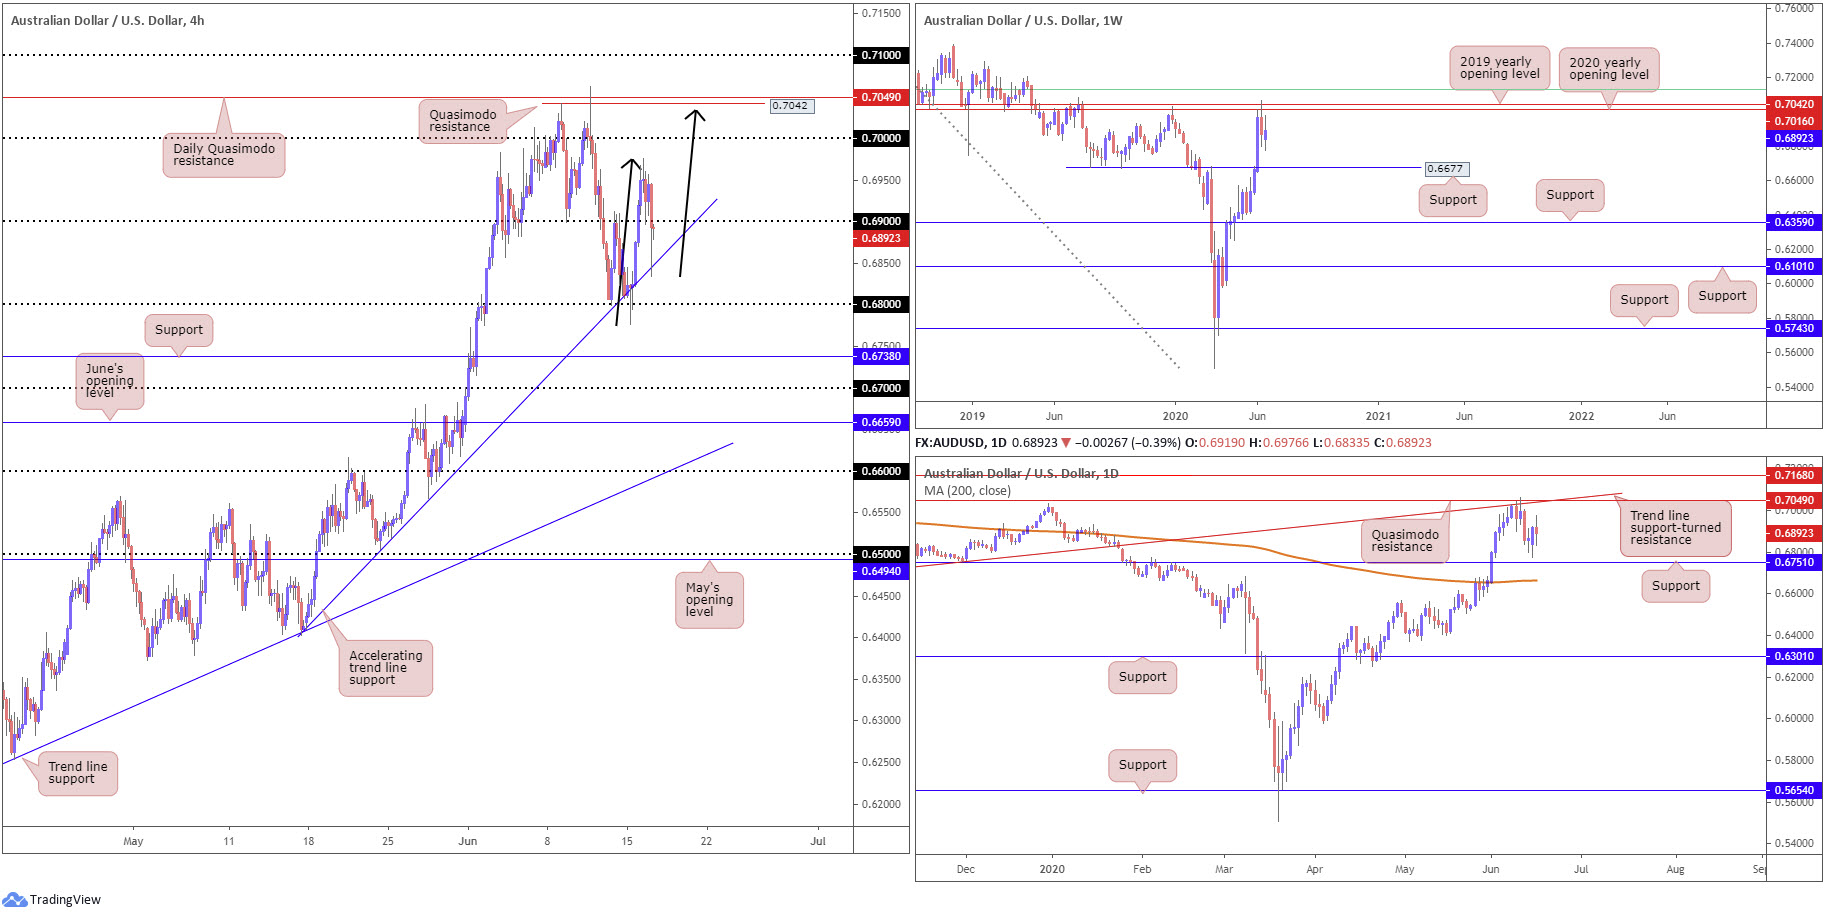
The Australian dollar edged lower against the buck Tuesday, weighed on reports out of China concerning more reclosures and a rise in the COVID-19 alert level. This, alongside a healthy DXY bid, sent AUD/USD H4 price through 0.69 to trend line support, taken from the low 0.6402. Reclaiming the round number to the upside today could eventually put forward an AB=CD bearish configuration (black arrows) that terminates ahead of H4 Quasimodo resistance at 0.7042, listed just under daily Quasimodo resistance at 0.7049.
Interestingly, daily price not only has Quasimodo resistance in view, we also see trend line support-turned resistance, taken from the low 0.6670. Attention on this timeframe also remains at support coming in from 0.6751, placed above the 200-day SMA (orange – 0.6664) which appears poised to turn higher.
Resistance, forged in the shape of the 2020 yearly opening level and the 2019 yearly opening level at 0.7016 and 0.7042, respectively, challenged buyers on the weekly timeframe in recent trading. It might also interest some traders to note that just above the said resistances we also have a 61.8% Fibonacci retracement ratio stationed at 0.7128 (green). While we cannot rule out the possibility of upside attempts, support could eventually spin into sight at 0.6677.
Areas of consideration:
Although it may not materialise today, H4 Quasimodo resistance at 0.7042 is a level of note. Not only does it come with a possible H4 AB=CD pattern, the level benefits from daily Quasimodo resistance at 0.7049. Collectively, this forms formidable resistance, despite positioned against the immediate trend (though overall we have been lower since June 2011).
A H4 close back above 0.69 may also refresh buyer interest, particularly if we retest the latter as support. Intraday targets from here can be found at yesterday’s high 0.6976, the 0.70 handle and finally our watched resistances around 0.7040ish.
USD/JPY:
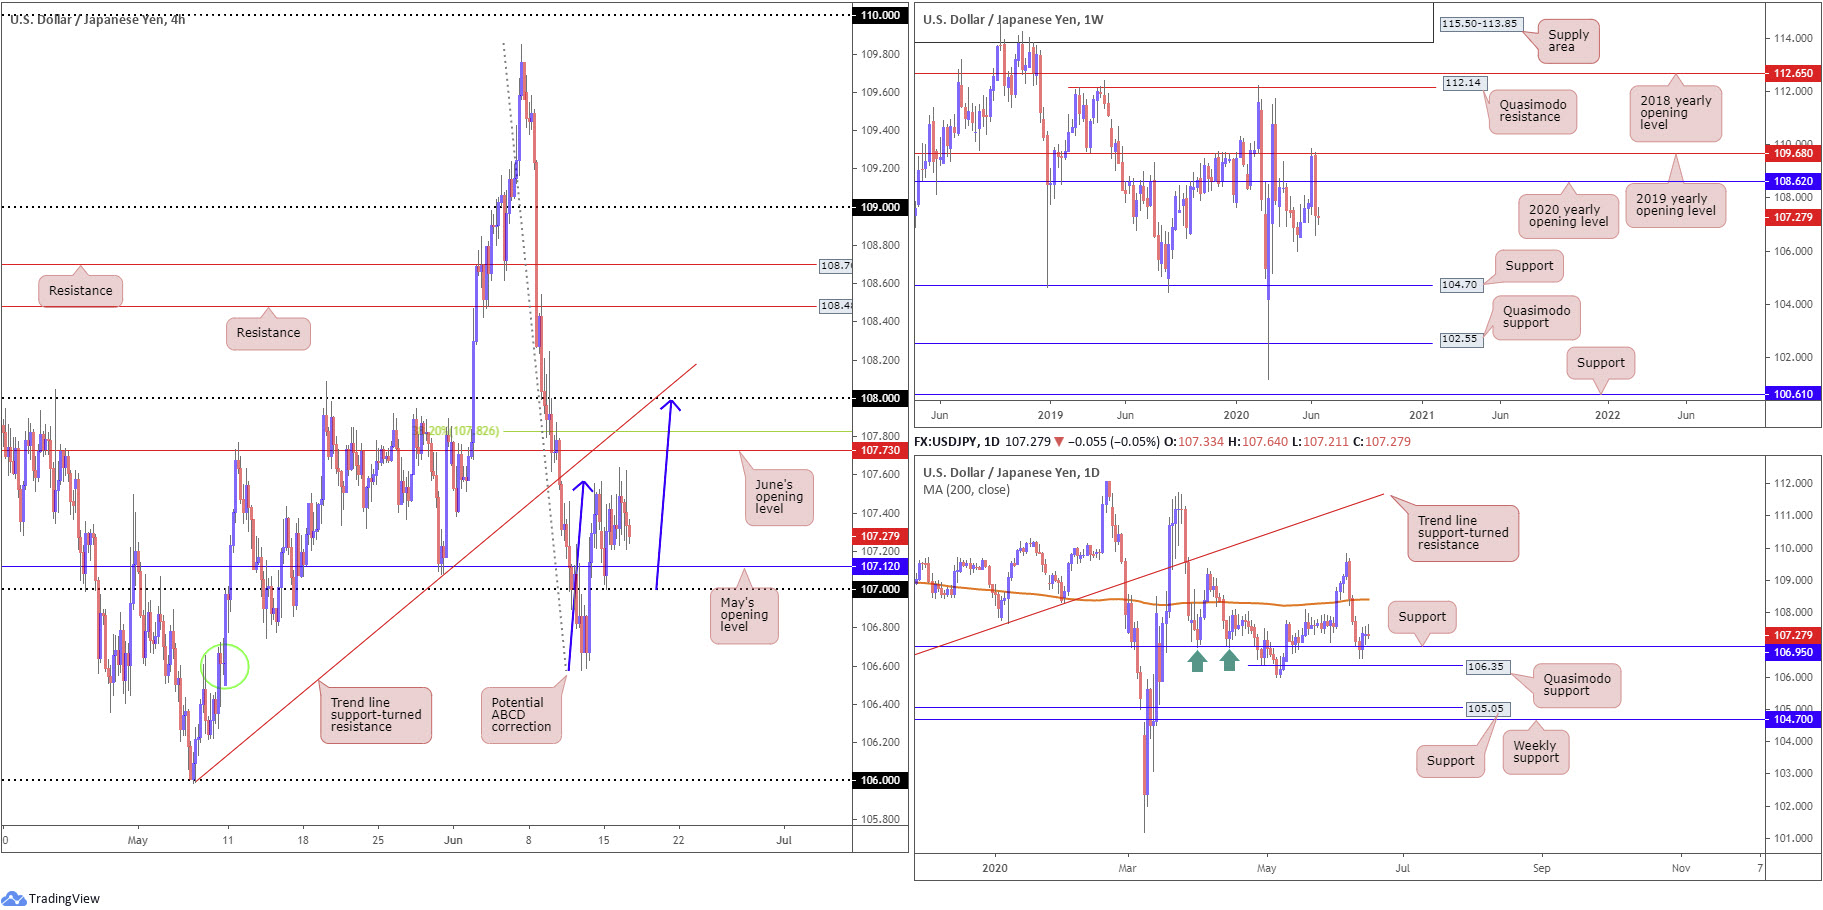
Tuesday, much like Monday’s session, concluded off best levels. As a result, much of the following piece will echo thoughts put forward in Monday’s briefing.
This week has seen H4 price dip through May’s opening level at 107.12 and retest 107, which held to the pip. This brings out June’s opening level at 107.73 as possible resistance, stationed close by trend line support-turned resistance (extended from the low 105.99) and the 38.2% Fibonacci retracement ratio at 107.82. 108 is also a level to keep an eye on here, given the potential formation of an ABCD correction (blue arrows).
From the weekly timeframe:
Erasing all the prior week’s gains and snapping a four-week bullish phase, last week’s swing lower may eventually reinforce further selling. Down more than 200 pips into last week’s wrap, after firmly rejecting the 2019 yearly opening level at 109.68 and cruising through the 2020 yearly opening level at 108.62, this shifts focus to the 105.98 6th May low as the next downside target on this timeframe.
From the daily timeframe:
Contrary to the weekly timeframe’s position, end-of-week trade had daily movement cross swords with support at 106.95, missing Quasimodo support at 106.35 by a hair. Friday observed buyers make a comeback off support at 106.95, swinging the 200-day SMA (orange – 108.41) back on to the radar. So far, though, we’ve been unable to gain much headway north of 106.95.
So, while weekly price suggests sellers govern action, daily price indicates buyers are still unlikely to give up without a fight. It might also be worth pointing out the 105.98 6th May low underlined on the weekly timeframe forms the low to the aforementioned daily Quasimodo support.
Areas of consideration:
Going into Wednesday, another retest at 107/107.12 may be in the offing.
Bearish scenarios, however, thanks to weekly price displaying room to explore lower ground, may also be seen between 108/107.73 on the H4 in the event we reach that high (also highlights an ideal take-profit target for longs off 107/107.12).
Failing that, a H4 close below 107 may encourage selling.
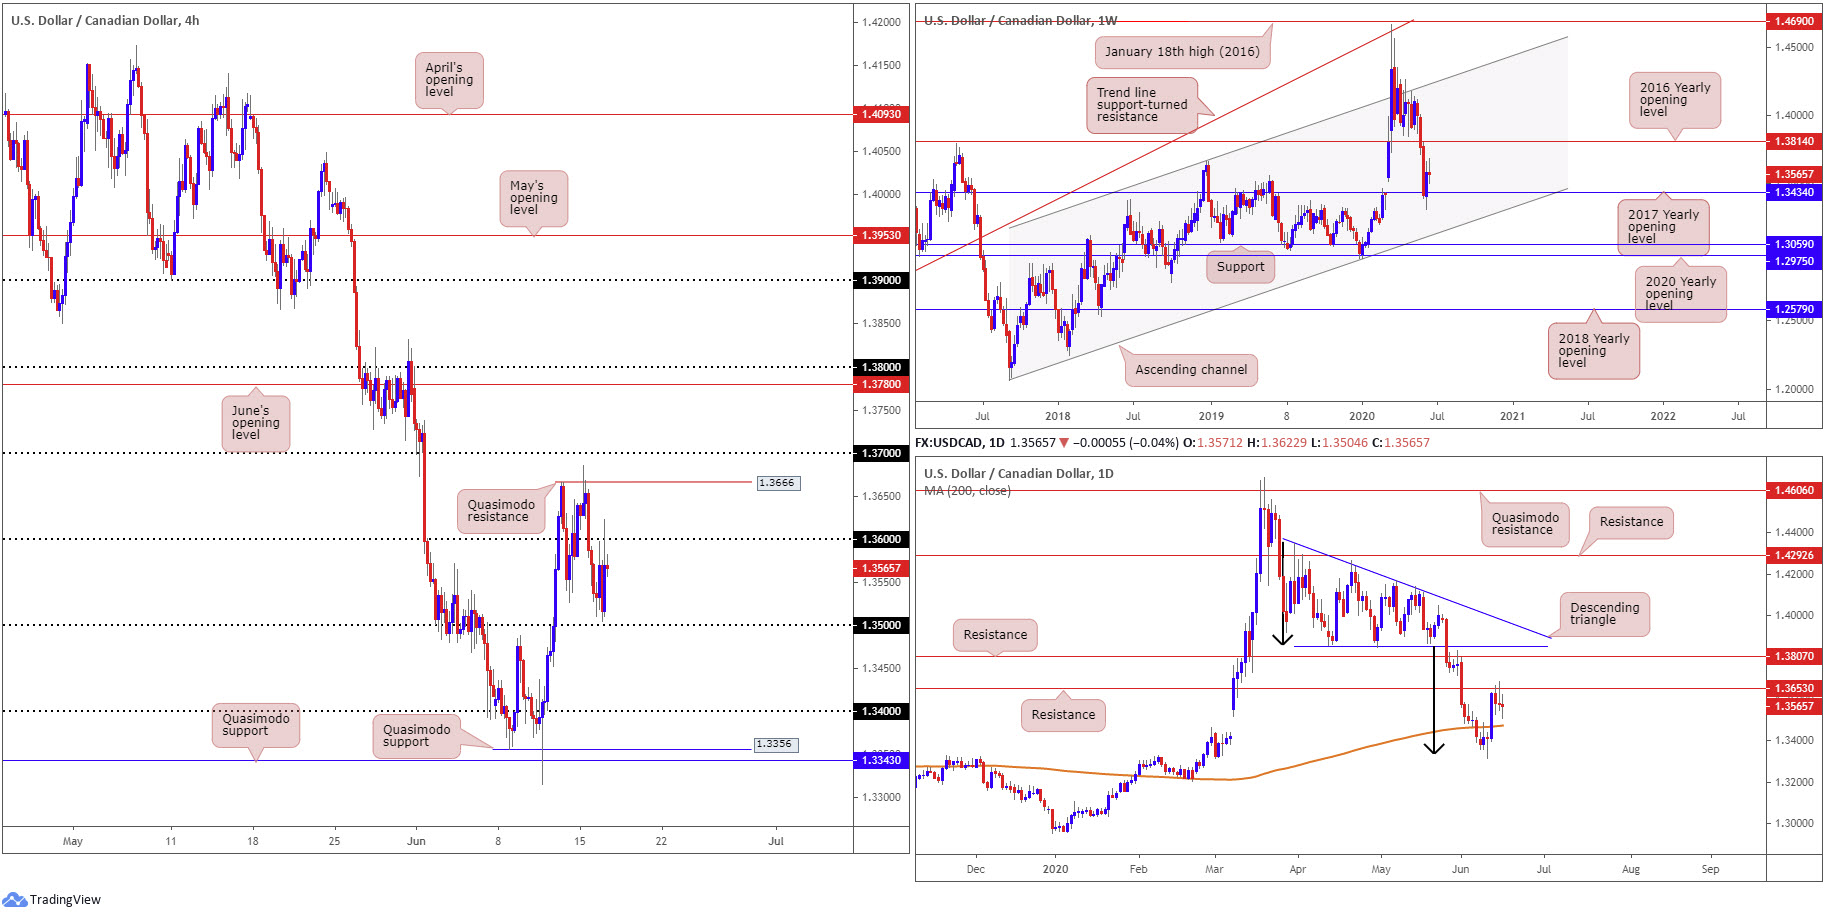
USD/CAD:
The 1.36 handle elbowed its way into the spotlight on Tuesday and stood firm as resistance. 1.35 also came within a few pips of entering the fold.
WTI prices modestly rallied as did the DXY, crossing 97.00. This likely fuelled the indecisive close as WTI rallying promotes a CAD bid and USD offer, while the DXY rallying lifts the USD.
H4 shows Quasimodo resistance could make an appearance at 1.3666 should 1.36 relinquish control. South of 1.35, on the other hand, 1.34 calls for attention, closely followed by Quasimodo support at 1.3356.
Given weekly price trades unchanged on the week so far, Monday’s technical briefing remains valid (italics):
USD/CAD bulls, following three consecutive weeks of losses, went on the offensive last week, drawing impetus from the 2017 yearly opening level at 1.3434.
Theoretically, this promotes the possibility of additional bullish sentiment, targeting resistance by way of the 2016 yearly opening level at 1.3814. Clearing 1.3434, on the other hand, places channel support, taken from the low 1.2061, into the limelight.
From the daily timeframe, which wrapped up Tuesday in the shape of an indecision candle, price continues to mingle around the underside of resistance at 1.3653. Evident from the chart, sellers are making their presence known here, though whether it is enough to hold the base is difficult to judge given the weekly timeframe suggesting higher moves. Above current resistance, another layer of resistance at 1.3807 is seen.
Areas of consideration:
Higher-timeframe buyers are unlikely to commit to the weekly timeframe’s push off support at 1.3434 until we crack daily resistance from 1.3653.
Having noted weekly price threatening a move higher, a potential scenario may come about on the H4 timeframe involving a fakeout through 1.35 into the 200-day SMA (1.3472). A H4 close back above 1.35 from the SMA will likely be a welcomed sight for buyers.
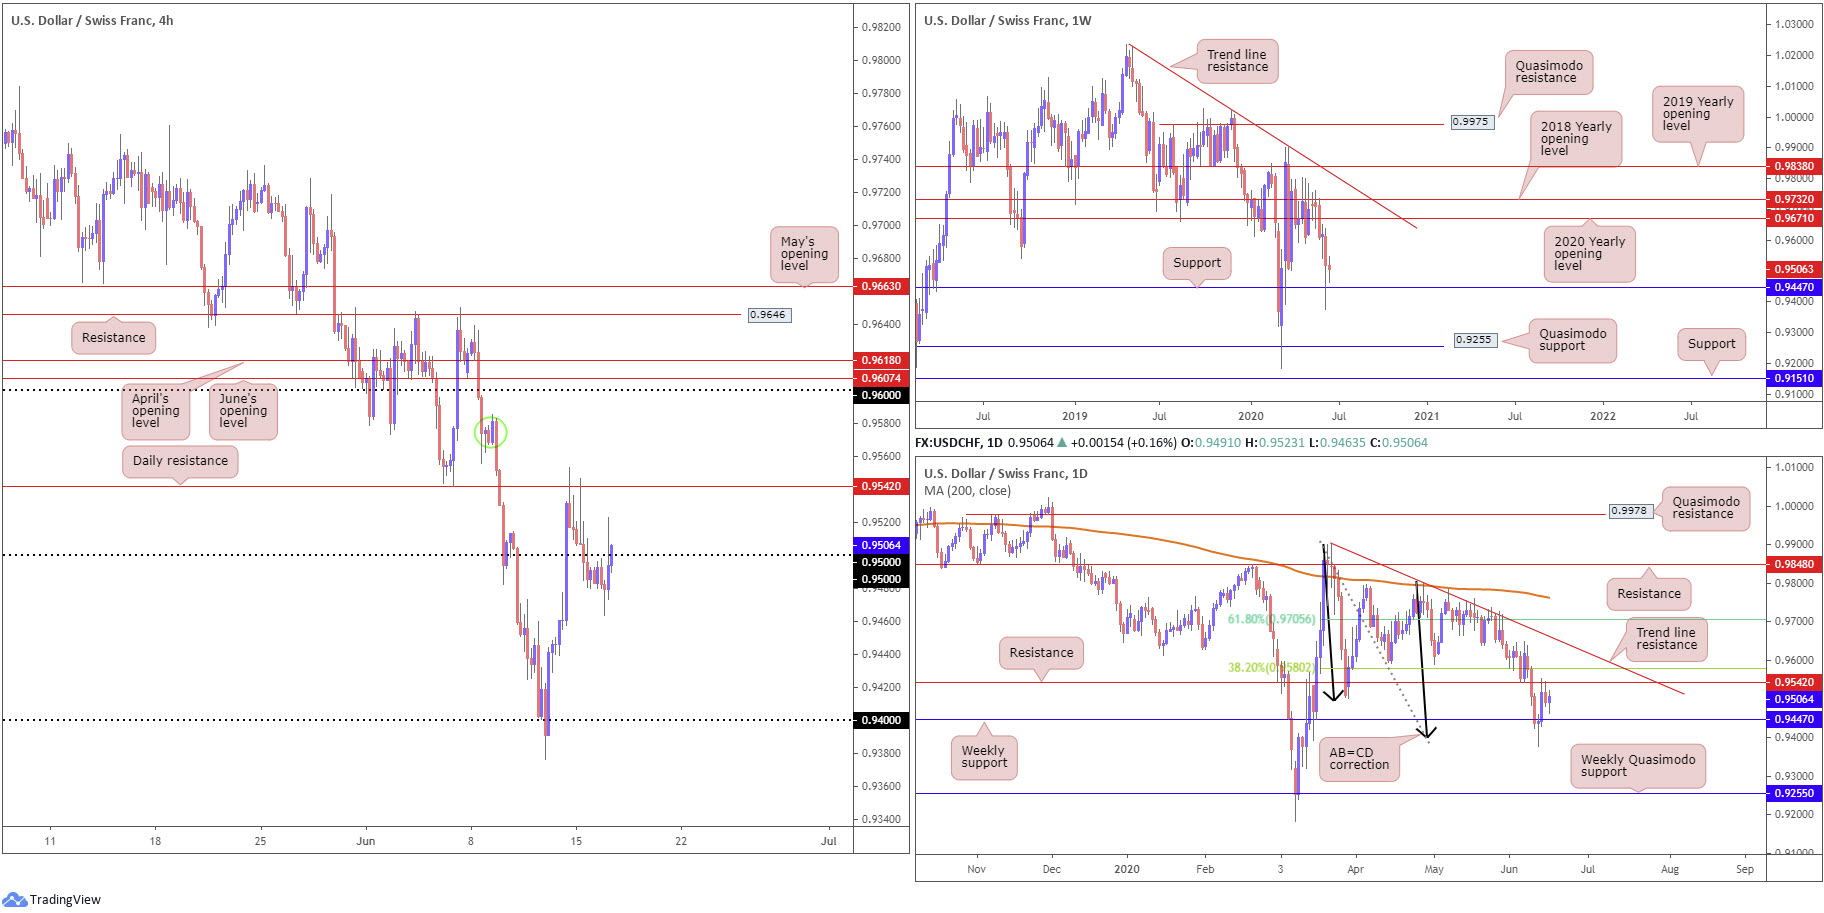
USD/CHF:
In recent hours, H4 price retested the underside of 0.95, vigorously driving to highs at 0.9522. As of current price buyers appear to be attempting to take hold of 0.95, with the possibility the recent move through the round number cleared orders for a run to daily resistance at 0.9542. Above the said daily base, supply exists around 0.9580 (green circle), with a break pointing to 0.96, as well as June and April’s opening levels at 0.9607 and 0.9618, respectively.
It is also worth reminding ourselves of the daily timeframe’s overall picture, suggesting a possible move above daily resistance (italics):
The break of weekly support at 0.9447 threw breakout sellers into a bear trap as daily buyers vigorously defended AB=CD structure (black arrows) at 0.9395. The initial upside target out of the daily AB=CD pattern, traditionally speaking, can be found at the 38.2% Fibonacci retracement ratio at 0.9580 (derived from legs A-D), positioned above resistance plotted at 0.9542 which hit Friday. It is possible, according to traditional measures, the final AB=CD target might also be met at 0.9705, the 61.8% Fibonacci retracement ratio from legs A-D. This implies a push above trend line resistance, taken from the high 0.9901.
Areas of consideration:
H4 breakout sellers beneath 0.95 had at least 30 pips to play with before price turned higher yesterday. Recent analysis, however, projected breakout selling would at least reach weekly support at 0.9447.
Bullish themes above 0.95 could be an option today, targeting daily resistance at 0.9542, with a break possibly reaching as far north as 0.96.
According to the AB-CD daily take-profit projections we may eventually head above the noted daily resistance (0.9542) for 0.9580ish, perhaps enough to draw in sellers off 0.9618/0.96 (April and June’s opening levels and the round number 0.96) on the H4. Therefore, 0.9618/0.96 is a base to watch as a potential reversal area.
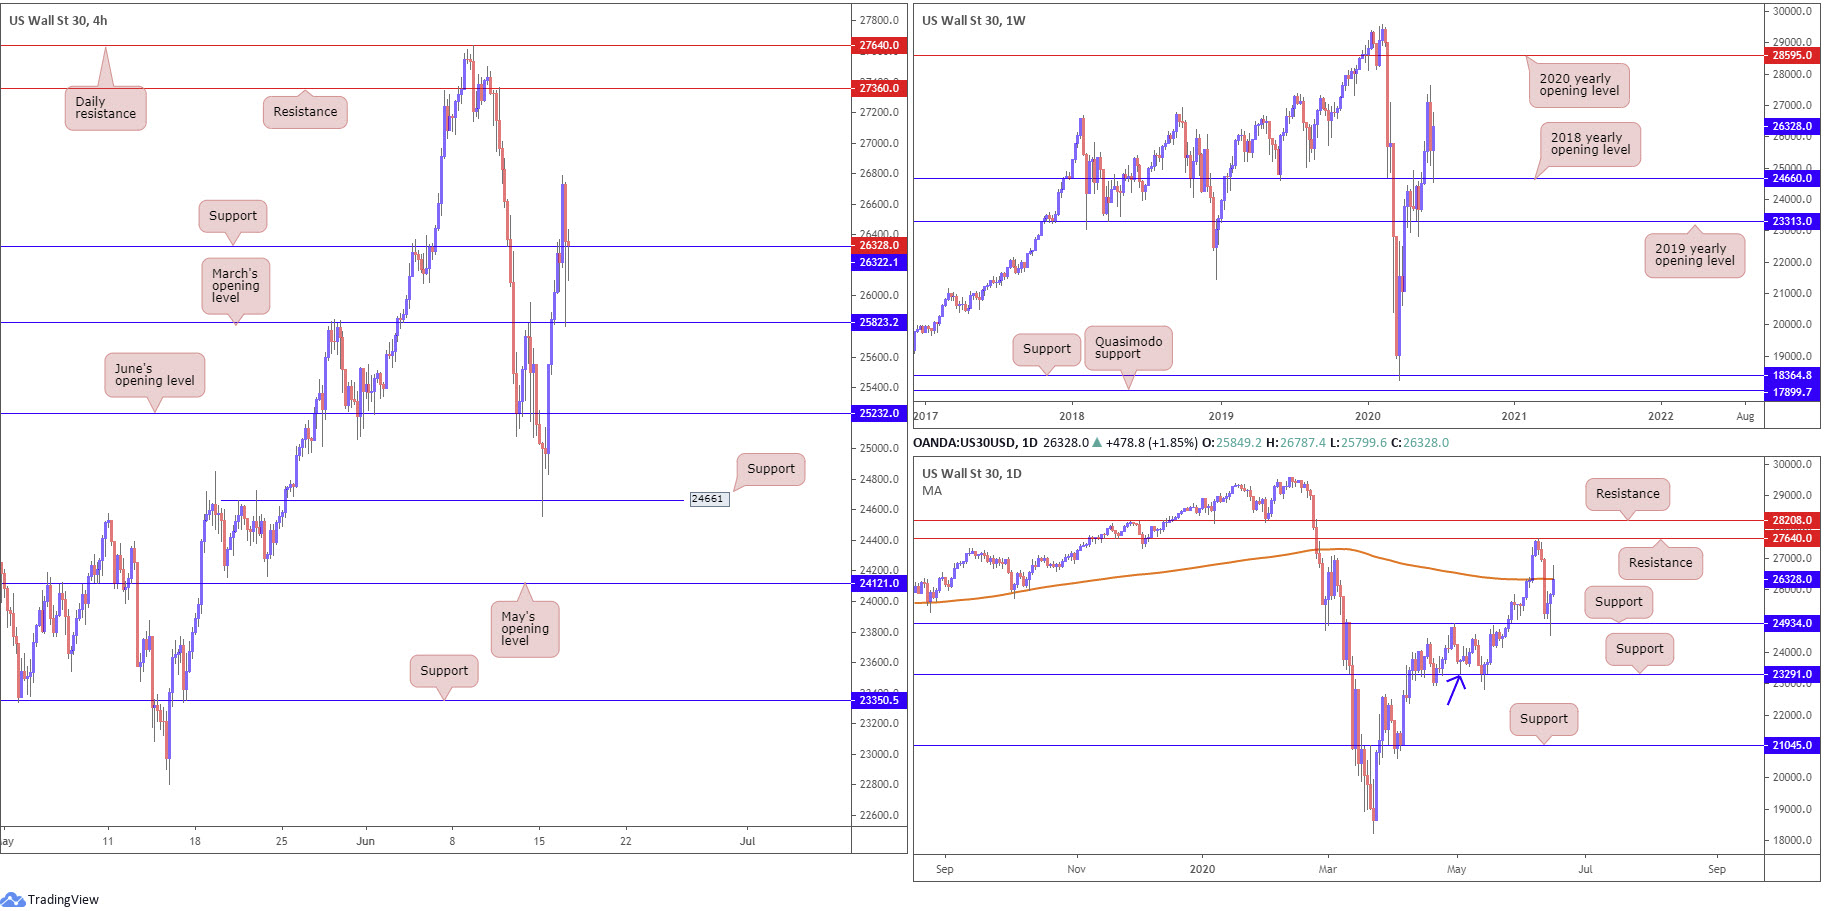
Dow Jones Industrial Average:
Major US benchmarks rallied across the board Tuesday amid a rebound in retail sales, injecting an optimistic vibe. The Dow Jones Industrial Average climbed 526.82 points, or 2.04%; the S&P 500 rose 58.15 points, or 1.90%, and the tech-heavy Nasdaq 100 concluded higher by 172.47 points, or 1.76%.
From the weekly timeframe, as highlighted in Tuesday’s technical briefing, the 2018 yearly opening level at 24660 was recently revisited as support and held ground. Further extension lands longer-term flow at the 27638 high, followed by room to bring in the 2020 yearly opening level at 28595. Moves lower, on the other hand, has the 2019 yearly opening level at 23313 in sight.
Support at 24934 remains a dominant fixture on the daily timeframe, pushing through moves to the 200-day SMA (orange – 26342) yesterday. Above here, resistance resides reasonably close by at 27640.
Stronger-than-expected US retail sales bolstered intraday flow Tuesday, eventually seeking highs at 26787, before whipsawing through support at 26322 and challenging March’s opening level at 25823. Continued upside could eventually propel the unit towards resistance at 27360.
Areas of consideration:
Holding off H4 support at 26322 signals we may be headed above the 200-day SMA on the daily timeframe. This may be enough to draw in buyers here; some, however, might wait for a H4 close above yesterday’s high at 26787 before pulling the trigger.
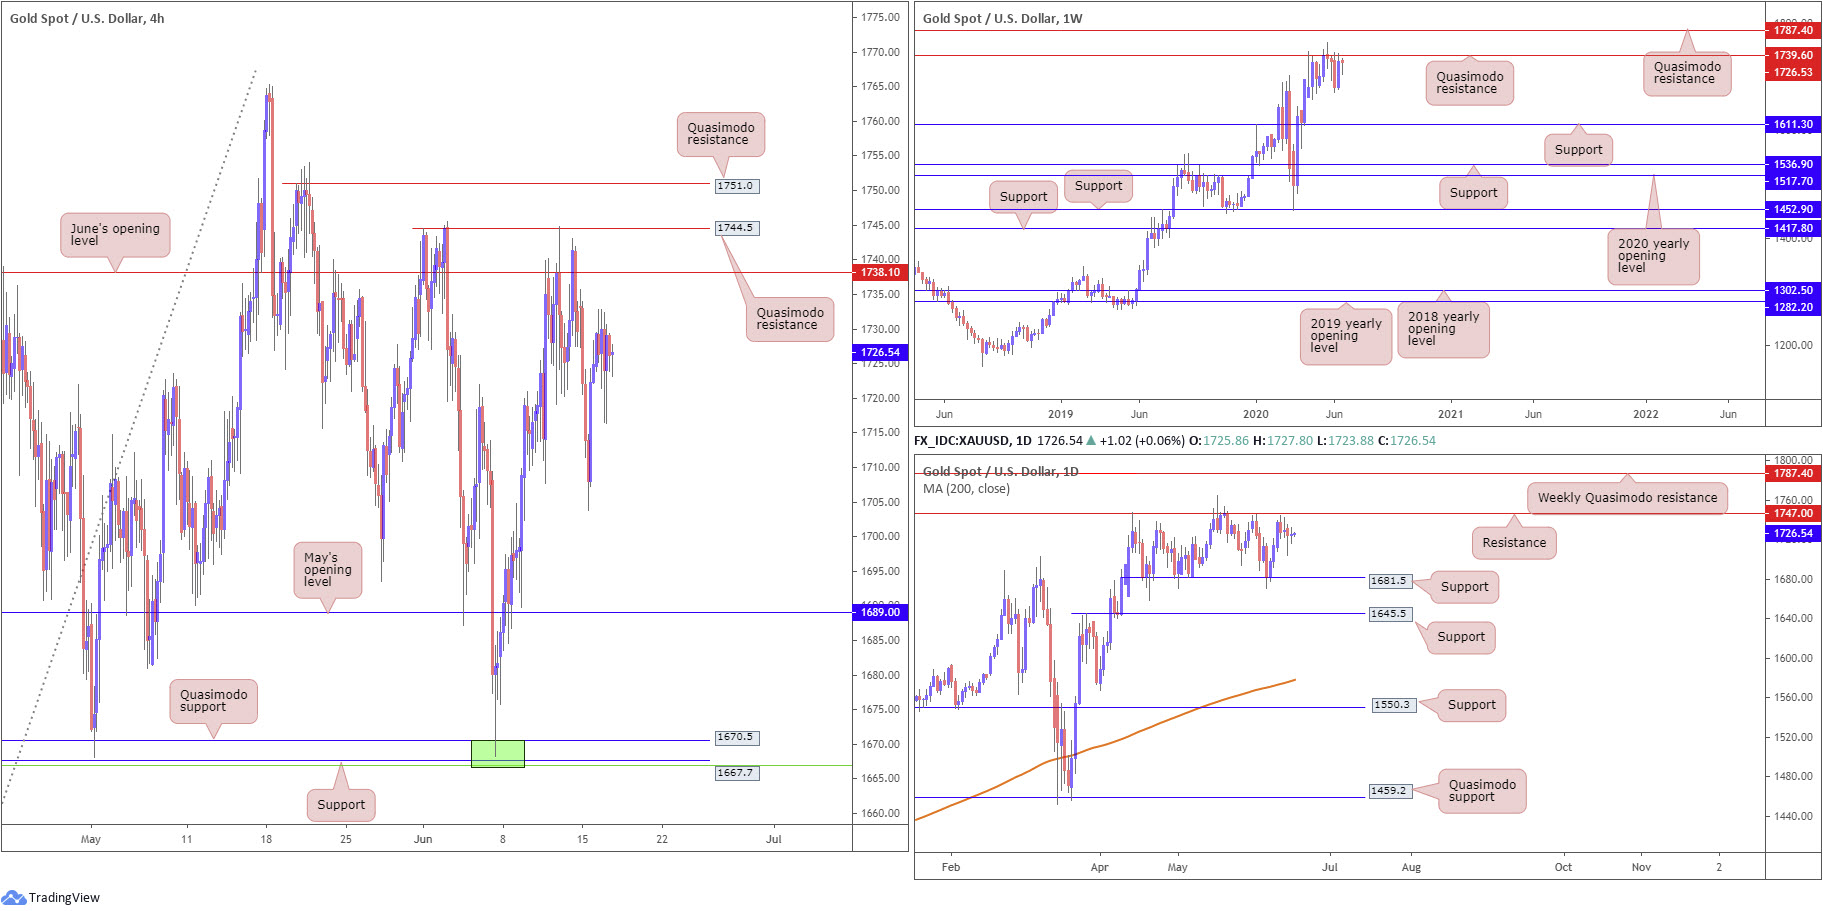
XAU/USD (GOLD):
From the weekly timeframe, as highlighted in Monday’s technical briefing, buyers and sellers have been battling for position below Quasimodo resistance at 1739.6 since mid-April, sited under another layer of Quasimodo resistance at 1787.4. A decisive turn lower from current price moves support at 1611.3 into view.
A closer reading of price action on the daily timeframe reveals candles remain entrenched within a range between resistance at 1747.0 and support pencilled in at 1681.5. A breakout to the downside shines the spotlight on support at 1645.5; turning higher, however, highlights the weekly Quasimodo resistance at 1787.4.
Across the page on the H4 timeframe, Quasimodo resistance at 1744.5, along with June’s opening level at 1738.1, currently contains upside. May’s opening level at 1689.0, assuming we pass 1703.8 (Monday’s low), offers feasible support. Elbowing through current resistance, nonetheless, will likely throw Quasimodo resistance into the pot at 1751.0.
Areas of consideration:
Although the trend has faced north since 2016, all the while weekly Quasimodo resistance remains intact this will likely deter prospective buyers.
A possible setup for sellers on the H4 timeframe is a pop above current Quasimodo resistance at 1744.5 to Quasimodo resistance at 1751.0, consequently tripping stops and drawing in daily resistance at 1747.0. Monday’s low at 1703.8 represents an initial target, with a break likely clearing the river to 1689.0.
The accuracy, completeness and timeliness of the information contained on this site cannot be guaranteed. IC Markets does not warranty, guarantee or make any representations, or assume any liability regarding financial results based on the use of the information in the site.
News, views, opinions, recommendations and other information obtained from sources outside of www.icmarkets.com.au, used in this site are believed to be reliable, but we cannot guarantee their accuracy or completeness. All such information is subject to change at any time without notice. IC Markets assumes no responsibility for the content of any linked site.
The fact that such links may exist does not indicate approval or endorsement of any material contained on any linked site. IC Markets is not liable for any harm caused by the transmission, through accessing the services or information on this site, of a computer virus, or other computer code or programming device that might be used to access, delete, damage, disable, disrupt or otherwise impede in any manner, the operation of the site or of any user’s software, hardware, data or property.


