
Key risk events today:
UK CPI y/y; UK PPI Input m/m; Canadian CPI m/m, Common CPI y/y, Manufacturing Sales m/m, Median CPI y/y and Trimmed CPI y/y; US Building Permits.
EUR/USD:
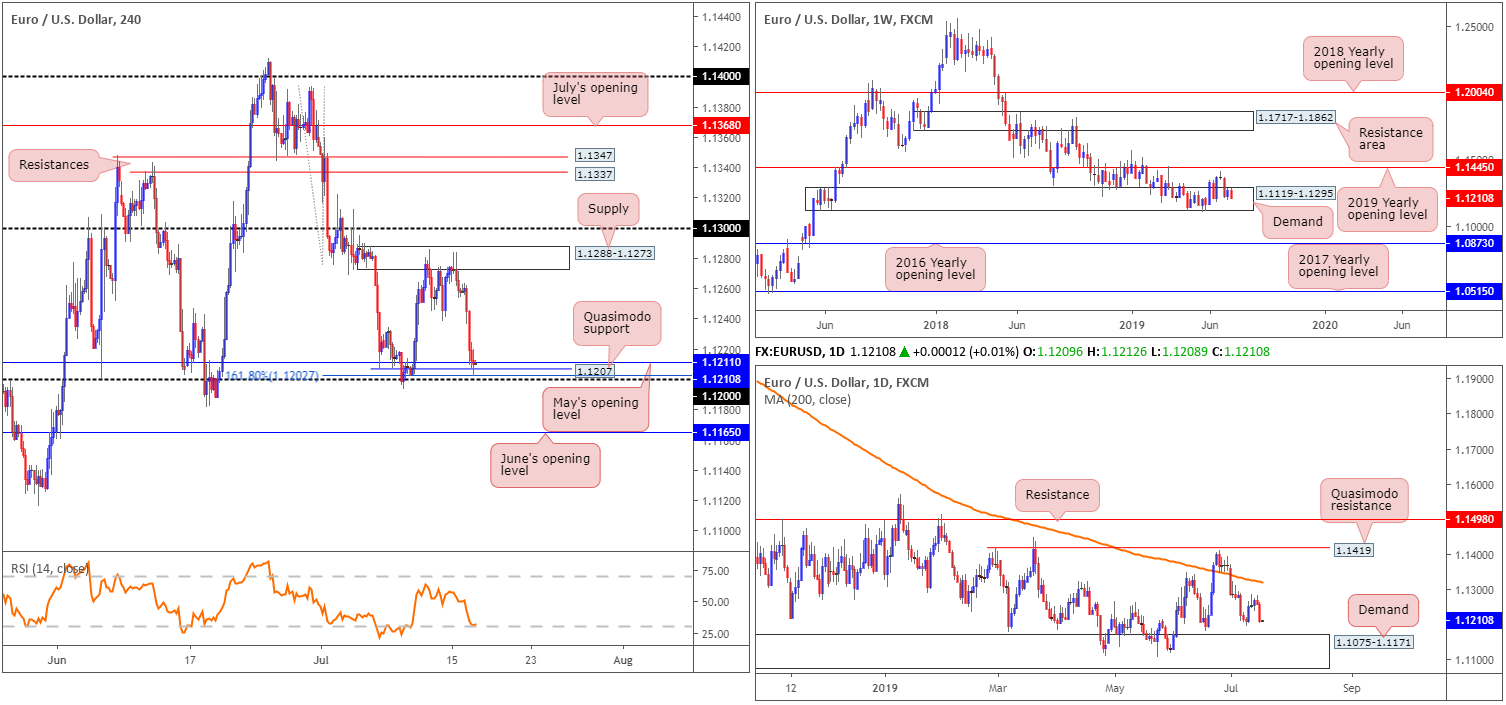
A weaker-than-expected German ZEW survey coupled with upbeat US retail sales kept the euro on the losing side of the table vs. the dollar Tuesday, down 0.43%.
Despite several attempts to overthrow H4 supply at 1.1288-1.1273, the area remained defensive, leading to a run towards an interesting area of H4 support between 1.12/1.1211 (comprised of the 1.12 handle, the 161.8% Fibonacci ext. point at 1.1202, a Quasimodo support at 1.1207 and May’s opening level at 1.1211). What’s also notable here is the RSI indicator is seen nearing oversold territory.
Higher-timeframe analysis has seen weekly price trade within the walls of a long-standing demand area at 1.1119-1.1295 since November 2018. Upside momentum remains fragile, with the unit unable to dethrone resistance by way of the 2019 yearly opening level at 1.1445. A closer reading of daily action shows the unit poised to approach demand seen at 1.1075-1.1171 (glued to the lower edge of the current weekly demand). Interestingly, the top edge of the daily demand (1.1171) aligns with June’s opening level on the H4 timeframe at 1.1165 (the next downside target beyond the current H4 support area at 1.12/1.1211).
Areas of consideration:
The H4 support area in play at 1.12/1.1211 is likely of interest for some traders this morning for a bounce higher. As of yet, the research team notes limited evidence to suggest buyer intent. In fact, a H4 indecision candle recently printed. Therefore, patience is key here.
In the event the candles explore lower ground, June’s opening level at 1.1165 is the next area of interest for long opportunities. As highlighted above, the barrier merges with the top edge of daily demand at 1.1171. To be on the safe side, though, traders are urged to consider waiting for additional candlestick confirmation before pulling the trigger. This helps identify buyer intent and provides entry and risk levels to work with.
GBP/USD:
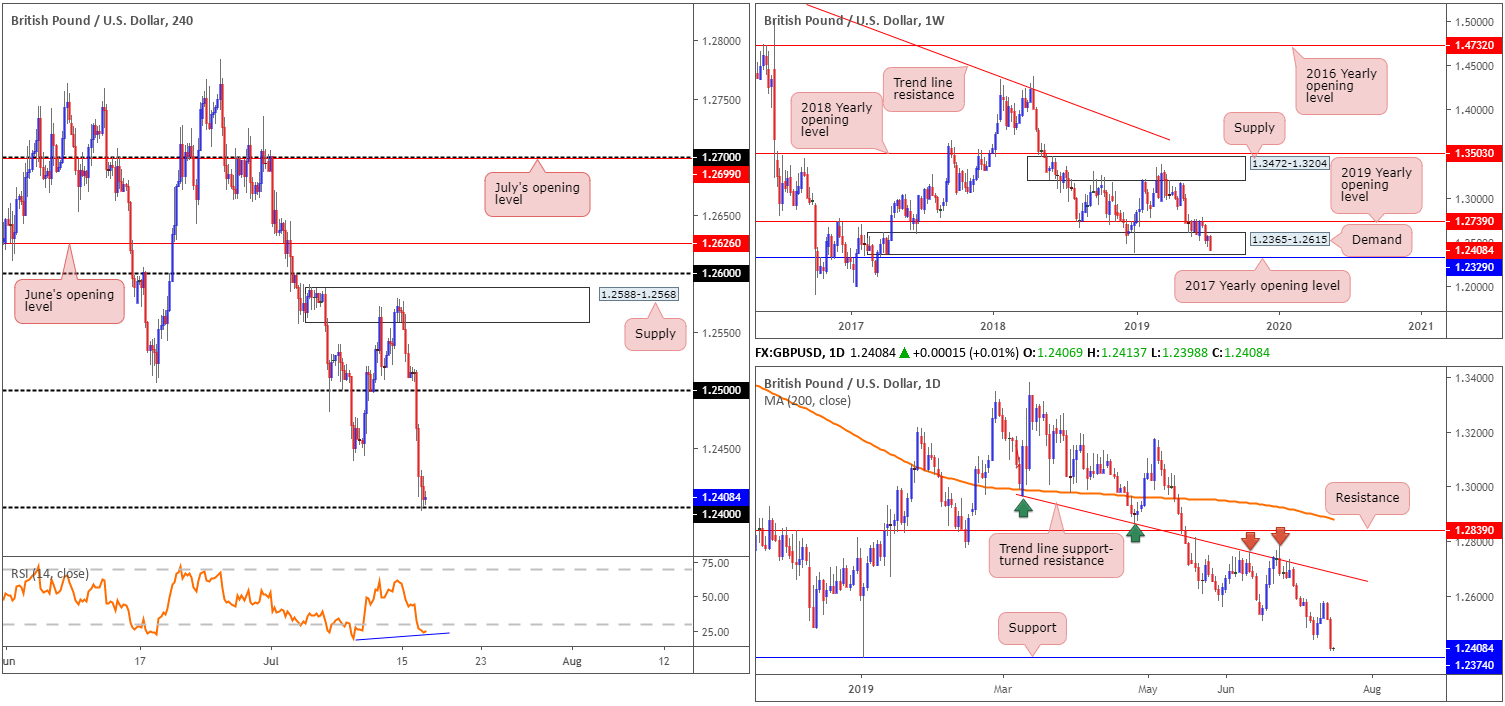
Sentiment surrounding the British pound underlined a fragile tone Tuesday, as no-deal Brexit fears resurfaced. Failing to gain any respite from upbeat UK wage growth data, the GBP/USD slipped 0.87% on the day, tumbling to lows not seen since the beginning of the year.
As we head into Asia Pac hours today, the unit is settling at the 1.24 handle on the H4 timeframe. As of current price, limited evidence is seen to suggest buyer intent, though we do have the RSI indicator offering positive divergence within oversold territory (blue line).
The story on the bigger picture positions the daily candles within striking distance of support at 1.2374. Note this level helped cap downside at the beginning of the year in the shape of a large hammer candlestick formation. With respect to weekly structure, price is treading water within the lower limits of demand at 1.2365-1.2615. A break of this area has almost immediate support placed at 1.2329: the 2017 yearly opening level.
Areas of consideration:
Seeing daily support at 1.2374 positioned within the lower boundary of weekly demand at 1.2365-1.2615, a bounce from the support is likely, despite recent selling. Traders attempting to fade 1.24, therefore, may witness a fakeout beneath the figure to said daily support, setting up a picture-perfect stop run.
On account of the above, a logical approach may be to wait for the fakeout beneath 1.24 to daily support to take shape, and then look for H4 price to CLOSE back above 1.24, confirming buyer intent. Entry on the close of the candle is valid, with a protective stop-loss order placed beneath its lower shadow.
AUD/USD:
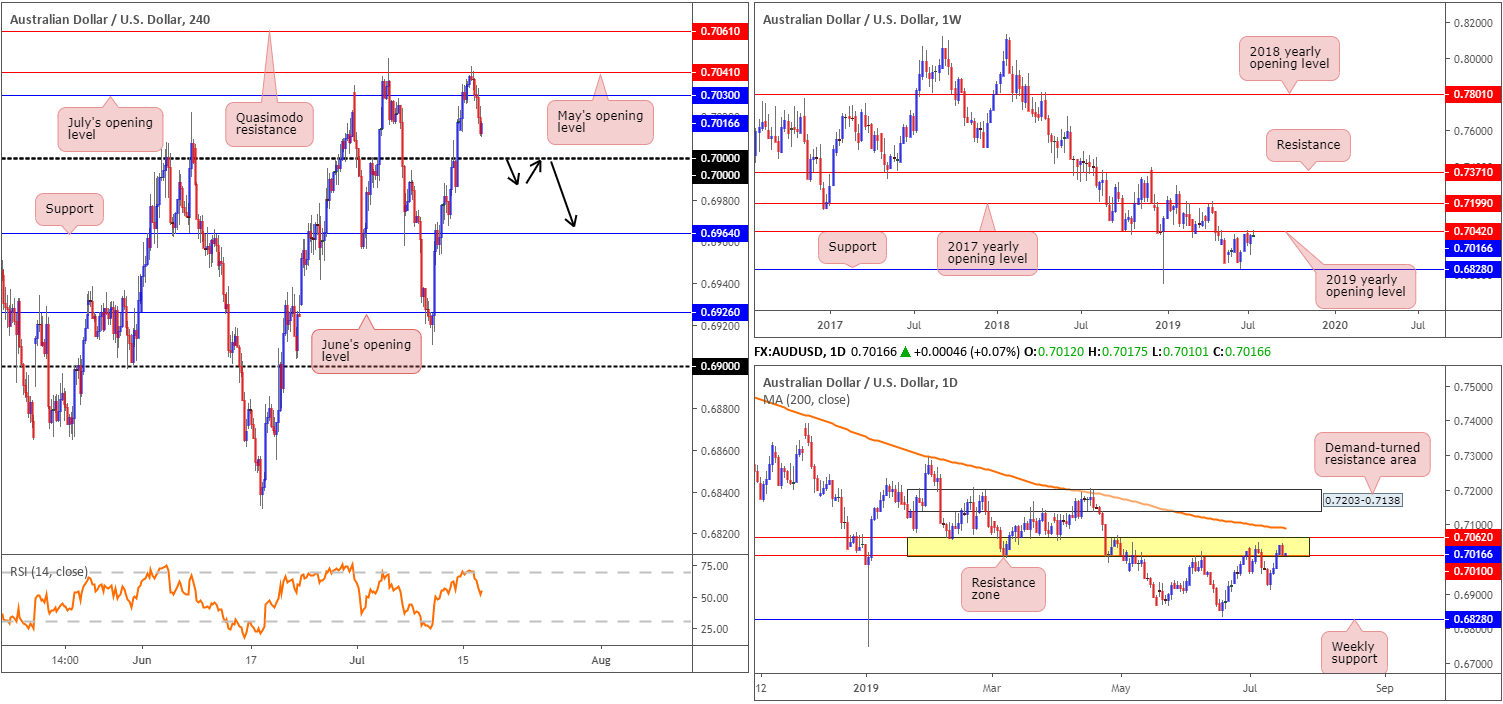
In recent sessions, traders observed the Reserve Bank of Australia (RBA) keep the door open to further rate cuts, consequently weighing on the Australian dollar in early trade Tuesday from May’s opening level on the H4 timeframe at 0.7041. Further downside came about on the back of stronger-than-expected US retail sales, hauling the H4 candles beneath July’s opening level at 0.7030 and exposing the key figure 0.70.
Against the backdrop of medium-term flows, higher-timeframe structure reveals weekly price shook hands with resistance at 0.7042: the 2019 yearly opening level and is holding ground. In conjunction with weekly movement, daily activity produced a bearish engulfing candlestick pattern yesterday within the confines of a resistance area at 0.7062/0.7010.
Areas of consideration:
Having noted weekly resistance at 0.7042 enter the fold and daily price engaging with a resistance area at 0.7062/0.7010, additional selling could be in store. The only downside to selling at current price is H4 action hovering just north of 0.70, a key support by and of itself. To help overcome this, traders may want to consider waiting and seeing if the unit engulfs 0.70 today, as this not only confirms seller intent on the higher timeframes it also likely clears the path south to at least H4 support at 0.6964.
An ideal scenario would be for H4 price to retest 0.70 as resistance following the break lower (entry and risk levels can be determined according to the rejection candlestick’s structure).
USD/JPY:
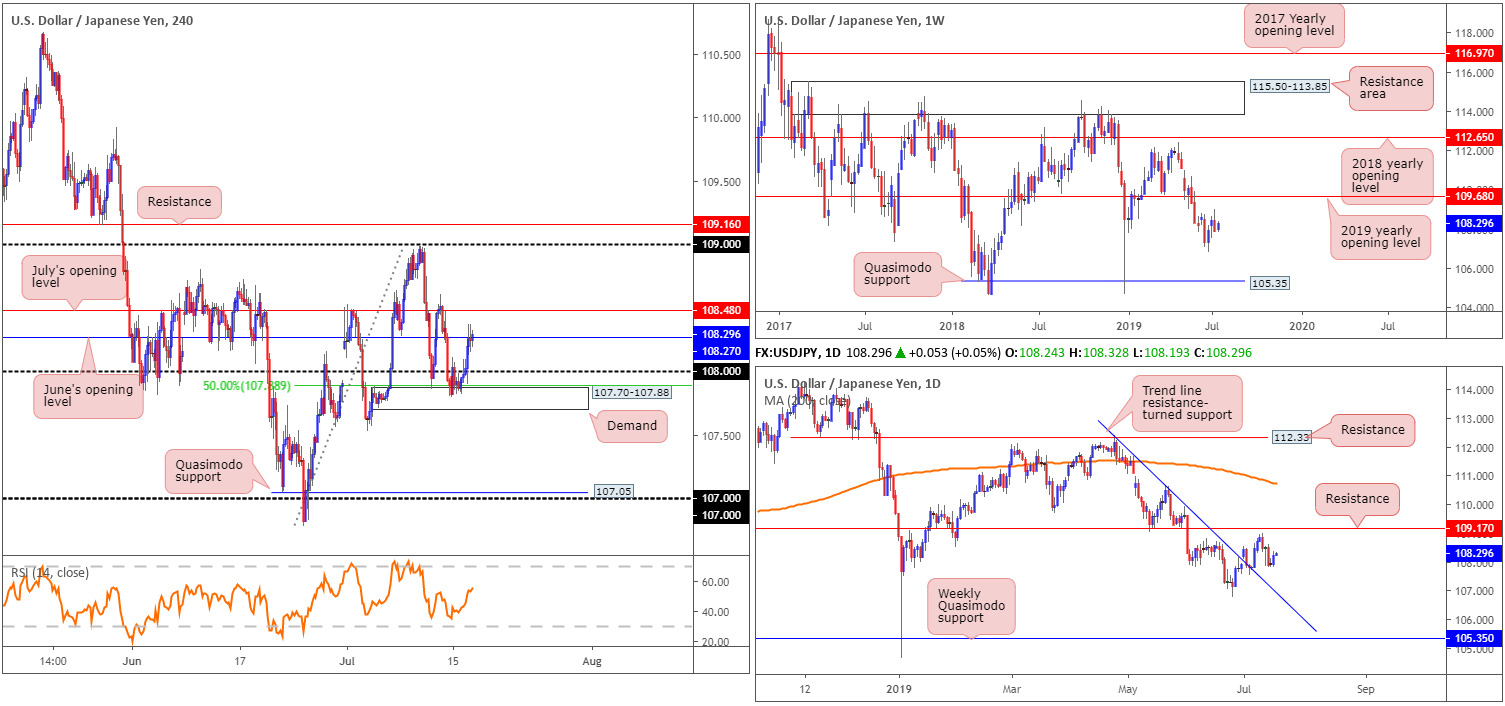
H4 demand at 107.70-107.88 held firm Tuesday, bolstered by a H4 50.0% retracement level at 107.88 and (at the time) the RSI chalking up mild positive divergence, as well as upbeat US retail sales figures. Swiftly engulfing the 108 handle to the upside and currently seen attempting to conquer June’s opening level at 108.27, July’s opening level at 108.48 is next in line as resistance, followed then by the 109 handle.
Despite recent buying, higher-timeframe structure remains unchanged, according to our weekly report published Monday:
From the weekly timeframe:
Breaking a two-week bullish phase, the US dollar rotated lower against the Japanese yen last week, engulfing the preceding candlestick’s body and erasing more than 55 points. According to technical structure on the weekly timeframe, resistance is set by way of the 2019 yearly opening level at 109.68 and support is not expected to emerge until reaching a Quasimodo formation at 105.35.
Daily timeframe:
Mid-week trading observed the USD/JPY decline in value, leaving resistance at 109.17 unchallenged. The next port of call, in terms of support, can be seen in the form of a trend line resistance-turned support (extended from the high 112.40). Beyond here, the 106.78 June 25 low is seen, followed then by the weekly Quasimodo support mentioned above 105.35.
Areas of consideration:
The only area of interest this morning is the clearing seen between July’s opening level at 108.48 and the 109 handle on the H4 timeframe. A decisive H4 push above 108.48 likely trips protective stop-loss orders above this barrier and last Thursday’s high 108.61, therefore opening up the possibility for longs towards 109, followed closely by H4 resistance at 109.16 and daily resistance at 109.17.
A retest of 108.48 following a break higher is ideal, consequently proving buyer intent and providing entry/risk levels to trade based on the rejecting candlestick’s structure.
USD/CAD:
Upbeat US retail sales figures, coupled with WTI prices slipping lower for a second consecutive day, the USD/CAD chalked up its second consecutive gain Tuesday, up 0.30%.
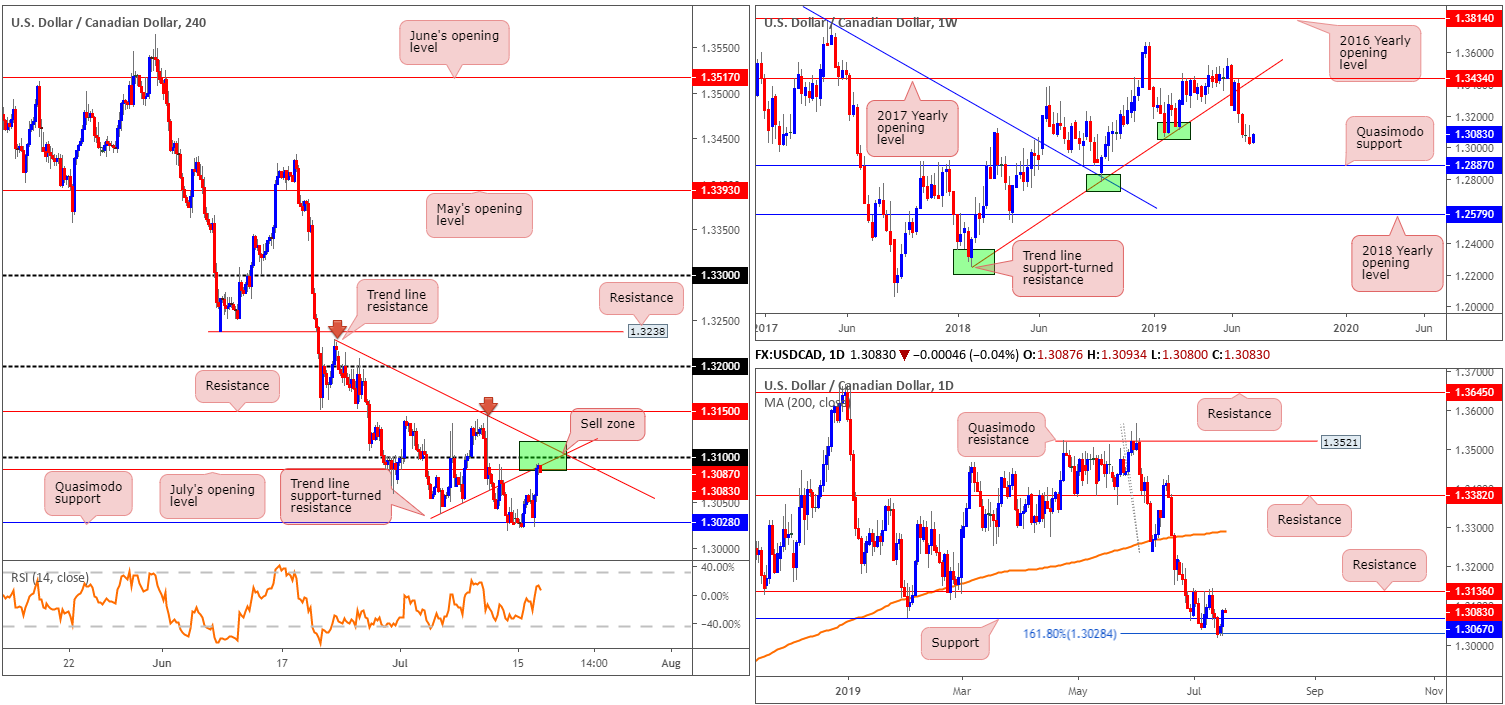
H4 Quasimodo support at 1.3028, as you can see, continued to cap downside yesterday and propelled price action beyond July’s opening level at 1.3087 to highs seen just south of 1.31. Note we also have a local trend line support-turned resistance (taken from the low 1.3037) in motion, too. Also of interest, beyond 1.31 trend line resistance is in view, extended from the high 1.3229.
While plenty of resistance is in motion on the H4 timeframe, higher-timeframe flow reveals daily price crossed above resistance at 1.3067 yesterday (now acting support) and perhaps unbolted upside towards resistance at 1.3136. The weekly chart, on the other hand, suggests we may eventually be in for further downside given limited support is visible until connecting with Quasimodo support at 1.2887.
Areas of consideration:
Between the trend line resistance (1.3229) and July’s opening level at 1.3087 on the H4 timeframe (green), the research team notes this as a possible sell zone this morning, targeting H4 Quasimodo support at 1.3028. Although this plays against daily price recently breaking resistance, a sell from here is in line with the predominant trend and also in line with weekly structure. Entry at current price, therefore, is an option, with a protective stop-loss order logged around 1.3120.
USD/CHF:
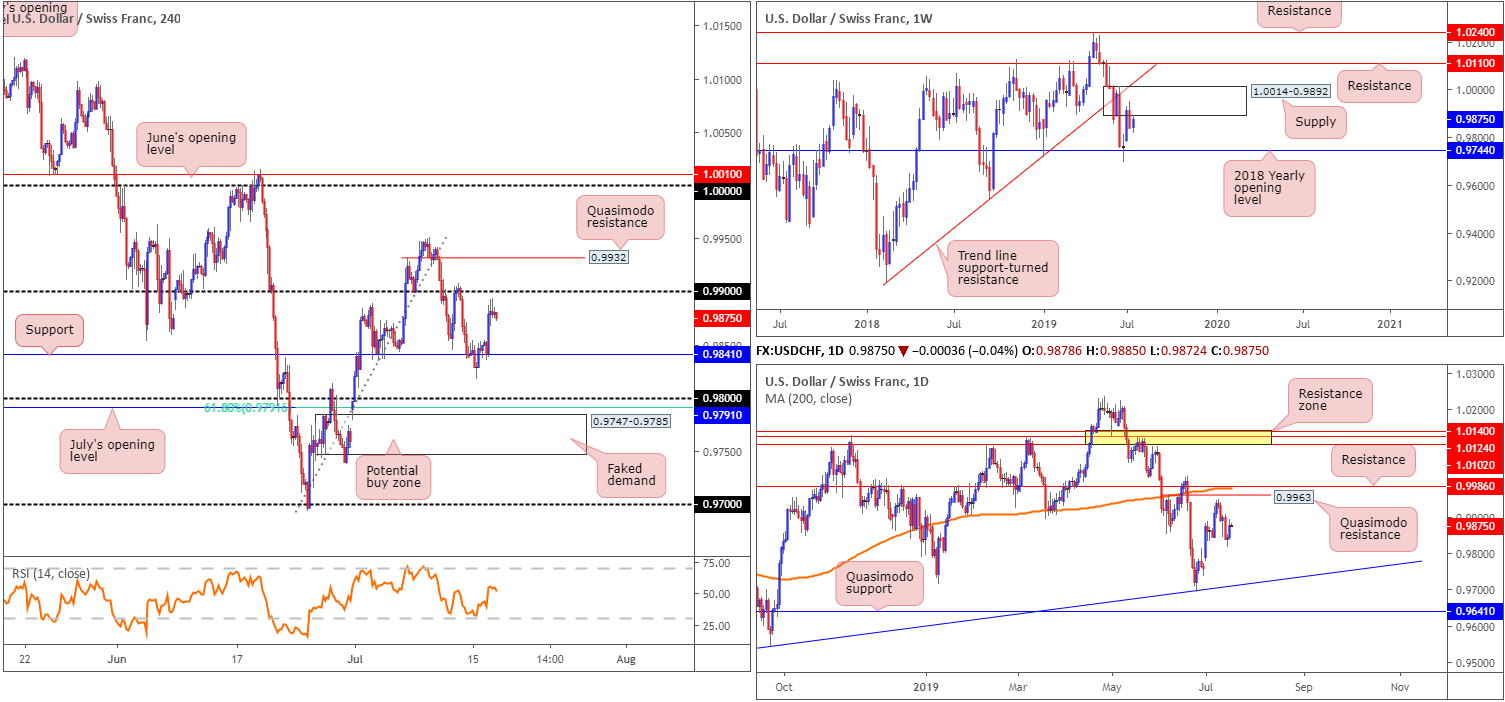
Kicking things off from the top this morning, weekly price remains south of supply at 1.0014-0.9892 after shaking hands with the base two weeks ago. While this could lead to a revisit of 0.9744: the next downside target, traders may also find use in noting the trend line support-turned resistance (extended from the low 0.9187), closely followed by resistance at 1.0110, should we turn higher. Closer examination of price action on the daily timeframe shows the unit poised to potentially approach Quasimodo resistance at 0.9963, followed closely by resistance at 0.9986 and the 200-day SMA (orange).
Tuesday witnessed the H4 candles rally off support at 0.9841, largely on the back of hotter-than-expected US retail sales data, and come within touching distance of testing 0.99. As of current price, confluence is limited. Beyond 0.99 we have Quasimodo resistance at 0.9932, which could hold price lower, though is likely to be under pressure from daily price wanting to test the Quasimodo resistance at 0.9963. Beneath 0.9841, however, the 0.98 handle is next in the firing range as potential support, closely trailed by July’s opening level at 0.9791 and a 61.8% Fibonacci retracement value as well as a ‘faked’ demand zone at 0.9747-0.9785.
Areas of consideration:
Longer-term flow suggests selling could be in store from weekly supply at 1.0014-0.9892.
Medium-term flow, on the other hand, may witness a bounce higher from the 0.98 region (given its surrounding confluence highlighted above) should we reach this far south. However, traders interested in buying 0.98 are also urged to take into account we could witness a fakeout into 0.9747-0.9785 before rotating higher. Stop-loss placement, therefore, is best positioned beneath this zone at 0.9747.
Dow Jones Industrial Average:
US stocks remained in a stale state Tuesday after President Donald Trump cast doubt on the trade progress between China and the US. Considering the lacklustre performance, much of the following report will air similar vibes brought from previous analysis.
Tuesday saw the Dow Jones Industrial average erase 0.09%; the S&P 500 lose 0.34% and the tech-heavy Nasdaq 100 decline 0.50%.
From the weekly timeframe, Monday’s report had the following to say:
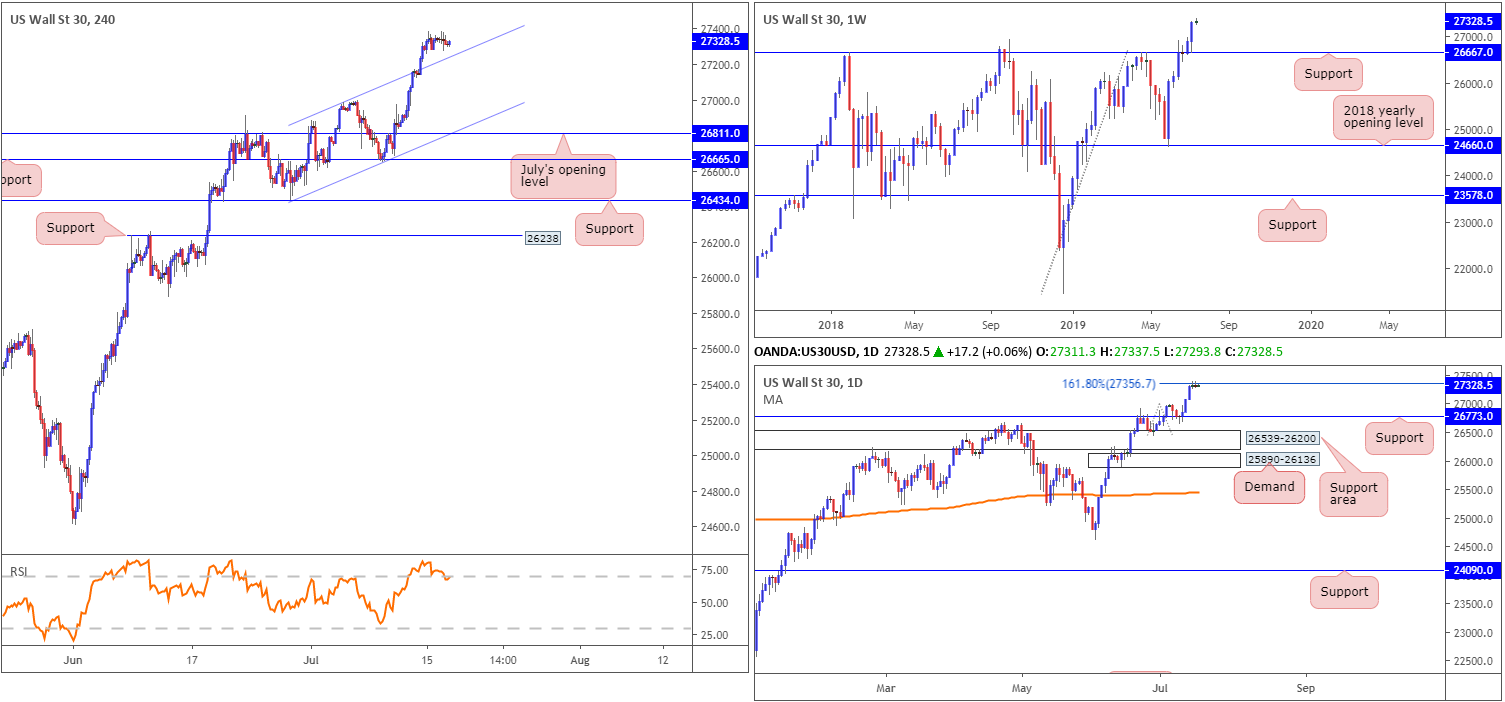
Aside from a brief spell of indecision three weeks back, the Dow Jones Industrial Average has emphasised a strong bullish tone since shaking hands with the 2018 yearly opening level at 24660 in early June. Taking out resistance at 26667 and shortly after retesting it as support propelled the index to fresh record highs of 27321 last week. With limited resistance in sight until connecting with 28070 (not visible on the screen), a 127.2% Fibonacci ext. point taken from the low 21425, additional buying could be seen over the coming weeks.
Daily perspective:
In similar fashion to weekly structure, price action retested support at 26773 in the shape of a hammer formation and advanced to fresh record highs last week. Resistance on this timeframe, however, is in play at 27356: the 161.8% Fibonacci ext. point.
H4 perspective:
Technically, we broke above the ascending channel’s upper limit (extended from the high 26972) Friday and consolidated on Monday and Tuesday. With the 161.8% Fibonacci ext. point at 27356 marked as resistance on the daily timeframe, the unit may pullback and retest the recently broken channel resistance-turned support for a move higher today.
Areas of consideration:
With the index strongly entrenched within an uptrend at present, entering short from 27356 is chancy on the daily timeframe. Instead, as briefly highlighted above, focus has shifted to a potential retest of the H4 channel resistance-turned support. To be on the safe side, traders are encouraged to wait for a H4 bullish candlestick formation to develop before entering long (entry and risk levels can be determined according to the candle’s structure). This is simply due to the possibility of aggressive selling entering the market off 27356.
XAU/USD (GOLD):
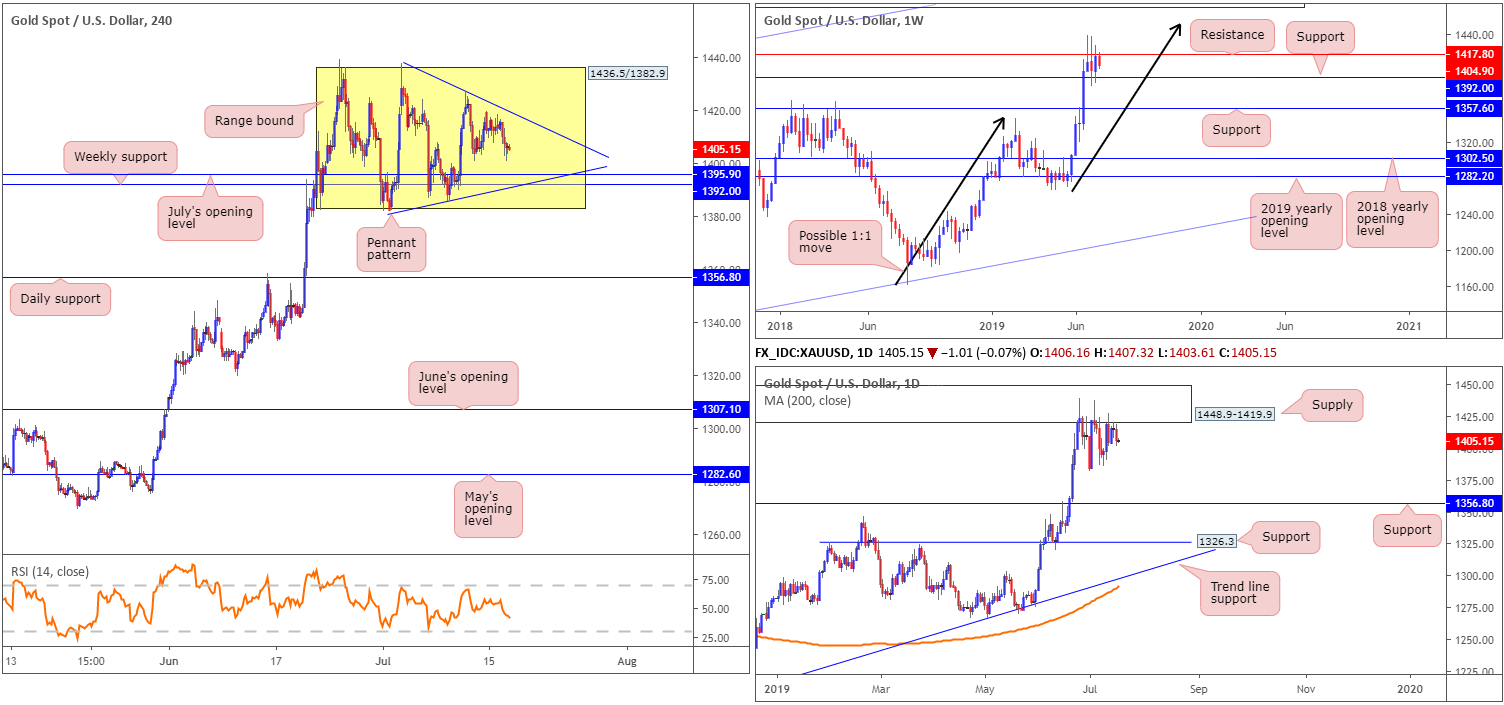
Although down 0.69% on the week, bullion remains confined between 1436.5/1382.9 on the H4 timeframe, with the lower limit bolstered by weekly support at 1392.0 and July’s opening level on the H4 timeframe at 1395.9. Another development to potentially consider on the H4 timeframe is the pennant pattern (blue levels – 1437.7/1381.9). This is generally considered a continuation pattern, and therefore may eventually pressure the unit to the upside. This formation is also evident on the daily timeframe, too.
As highlighted in previous reports, we can see the unit kissing the underside of weekly resistance at 1417.8, which has capped upside for three weeks. Further upside from current price could eventually cross paths with a 1:1 correction (black arrows) around 1453.2 shaped from the 1160.3 August 13 low, whereas a move sub 1392.0 (nearby weekly support) has another layer of weekly support in view at 1357.6.
The story on the daily timeframe has the candles testing the lower edge of a supply zone at 1448.9-1419.9. Note the weekly resistance level at 1417.8 resides just beneath the said supply zone. The next downside target on the daily scale falls in around at 1356.8.
Areas of consideration:
With limited movement seen, the outlook here remains unchanged.
As of current market structure on the H4, daily and weekly timeframes, the research team notes limited opportunity to trade at present. Aside from the daily timeframe suggesting a move lower from supply at 1448.9-1419.9, both the H4 and weekly timeframes are in a range and in need of a breakout.
With that being said, traders may wish to attempt to trade between the H4 range limits, either the rectangle formation between 1436.5/1382.9 or the current H4 pennant pattern. Either way, it is wise to ensure you have reasonable risk/reward in place before pulling the trigger, and preferably confirmed by bullish/bearish candlestick structure (entry and risk levels can then be determined according to its extremes).
The accuracy, completeness and timeliness of the information contained on this site cannot be guaranteed. IC Markets does not warranty, guarantee or make any representations, or assume any liability with regard to financial results based on the use of the information in the site.
News, views, opinions, recommendations and other information obtained from sources outside of www.icmarkets.com.au, used in this site are believed to be reliable, but we cannot guarantee their accuracy or completeness. All such information is subject to change at any time without notice. IC Markets assumes no responsibility for the content of any linked site.
The fact that such links may exist does not indicate approval or endorsement of any material contained on any linked site. IC Markets is not liable for any harm caused by the transmission, through accessing the services or information on this site, of a computer virus, or other computer code or programming device that might be used to access, delete, damage, disable, disrupt or otherwise impede in any manner, the operation of the site or of any user’s software, hardware, data or property.


