
A note on lower timeframe confirming price action…
Waiting for lower timeframe confirmation is our main tool to confirm strength within higher timeframe zones, and has really been the key to our trading success. It takes a little time to understand the subtle nuances, however, as each trade is never the same, but once you master the rhythm so to speak, you will be saved from countless unnecessary losing trades. The following is a list of what we look for:
- A break/retest of supply or demand dependent on which way you’re trading.
- A trendline break/retest. Buying/selling tails – essentially we look for a cluster of very obvious spikes off of lower timeframe support and resistance levels within the higher timeframe zone.
- Candlestick patterns. We tend to only stick with pin bars and engulfing bars as these have proven to be the most effective.
For us, lower timeframe confirmation starts on the M15 and finishes up on the H1, since most of our higher timeframe areas begin with the H4. Stops usually placed 5-10 pips beyond your confirming structures.
EUR/USD:
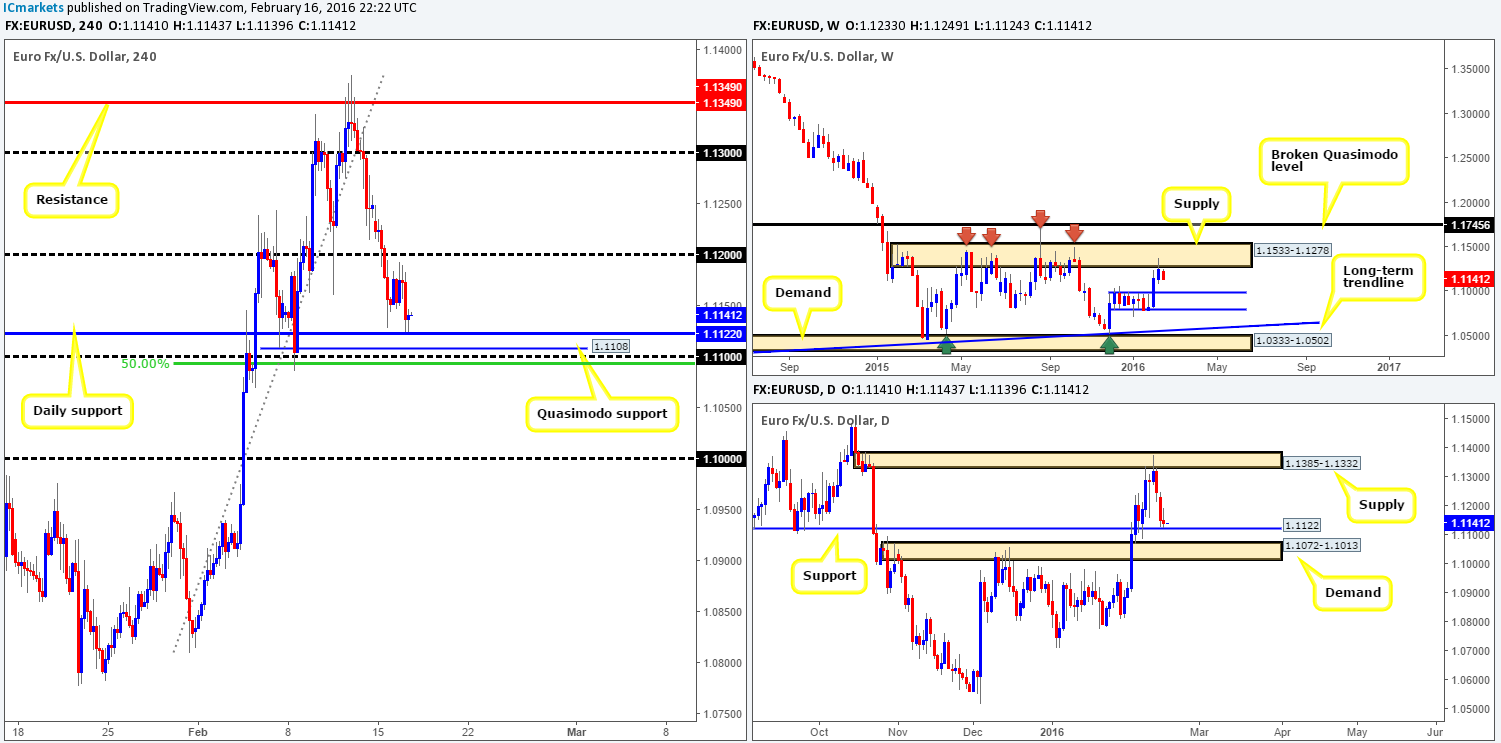
Throughout yesterday’s Asia and the London morning session the single currency saw rather subdued price action, confining itself to a small range fixed between 1.1152/1.1175. Once the U.S. session opened its doors for business, however, the market dived to lows of 1.1124 – two pips shy of daily support penciled in at 1.1122.
In our previous report (http://www.icmarkets.com/blog/tuesday-16th-february-daily-technical-outlook-and-review/), we spoke about entering long from the above said daily support since it converges nicely with the following structures: a H4 Quasimodo support at 1.1108, a psychological support at 1.1100 and a 50.0% Fibonacci support level at 1.1093. We also mentioned that no more than a bounce is expected from this region, and that no position would be opened without seeing some sort of lower timeframe buying signal beforehand. As of yet, there has been little telling us to buy from here.
The reason for only expecting a bounce lies within the weekly chart. Supply at 1.1533-1.1278, as you can see, is clearly in play right now and has the potential (room to move lower) to drag this pair down to at least support drawn from 1.0983. Therefore, one can assume that should price engulf 1.1100 today, the path south would, as far as we see, be clear down to the large psychological support 1.1000 (fuses with the top-side of daily demand at 1.1013). A confirmed retest at the underside of 1.1100 is very attractive due to the fact that weekly flow would be on our side at this point!
Levels to watch/live orders:
- Buys: 1.1122/1.1093 [Tentative – confirmation required] (Stop loss: dependent on where one confirms this area).
- Sells: Watch for bids to be consumed around 1.1100 and look to trade any retest from this area thereafter (lower timeframe confirmation required).
GBP/USD:
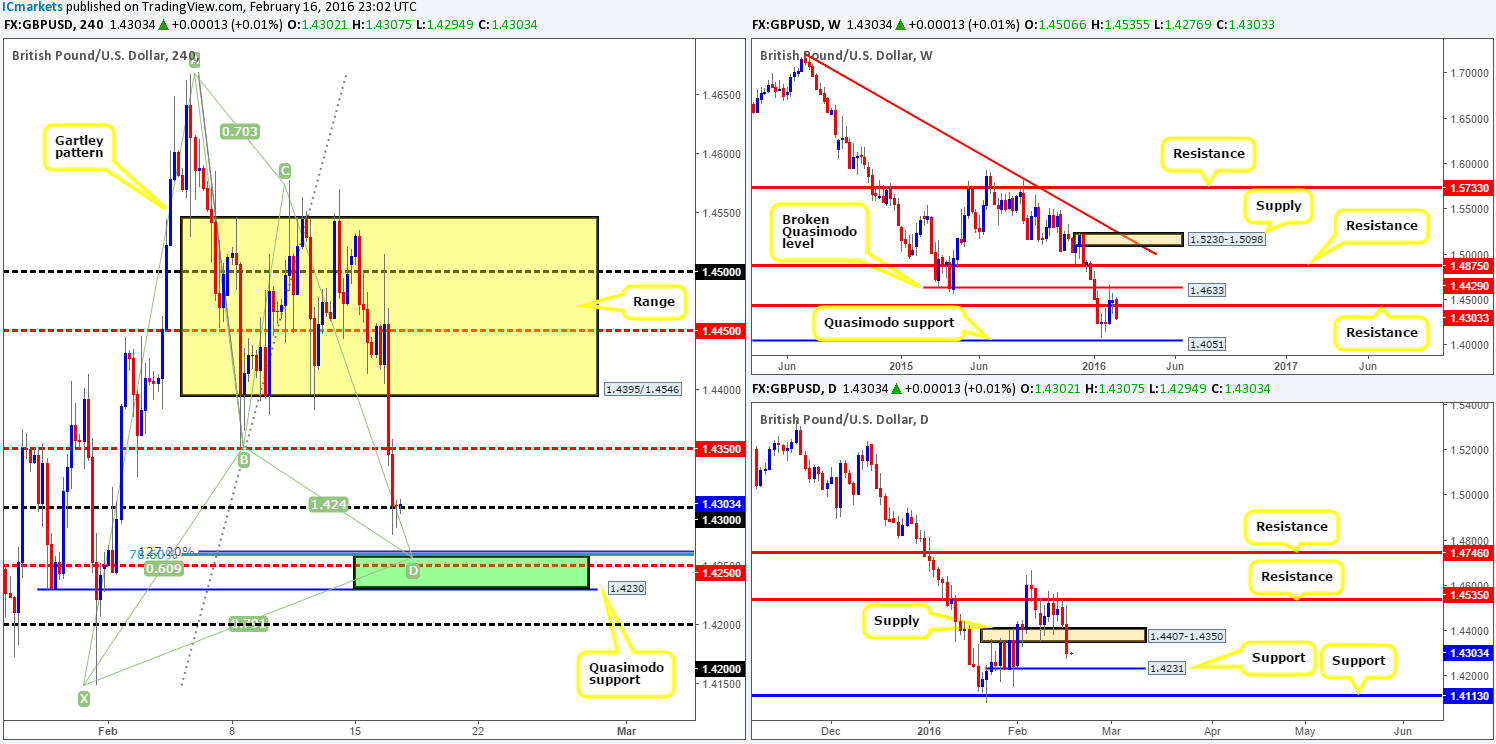
Going into yesterday’s London session, Cable was aggressively offered following a string of disappointing U.K. data which saw the pair tumble over 200 pips in one sitting! Following this lemming-like stampede, prices began to stabilize as U.S. traders entered the market around the 1.4300 handle.
Consequent to this recent sell-off, the GBP is very close to completing a beautiful-looking H4 Harmonic Gartley pattern around the 1.4258 mark. Not only is this pattern extremely symmetrical, it is also supported by a mid-level number at 1.4250 and a H4 Quasimodo support at 1.4230 which blends nicely with daily support drawn from 1.4231.
Ultimately, our buy zone for this pair can be seen between 1.4230 and 1.4260 (green zone). However, pulling the trigger here without any supporting lower timeframe price action is not something we’d be comfortable with. Reason being is the market could very easily dive below our buy zone and strike 1.4200, which, as most already know, would not invalidate the Harmonic pattern, thus the pair could still be bought from here (we do not want to see a break beyond the X point at 1.4149). In regards to take-profit targets, this will be dependent on where we enter as H4 supplies could form on approach.
Levels to watch/live orders:
- Buys: Ideally looking for a confirmed entry between 1.4230/1.4260.
- Sells: Flat (Stop loss: N/A).
AUD/USD:
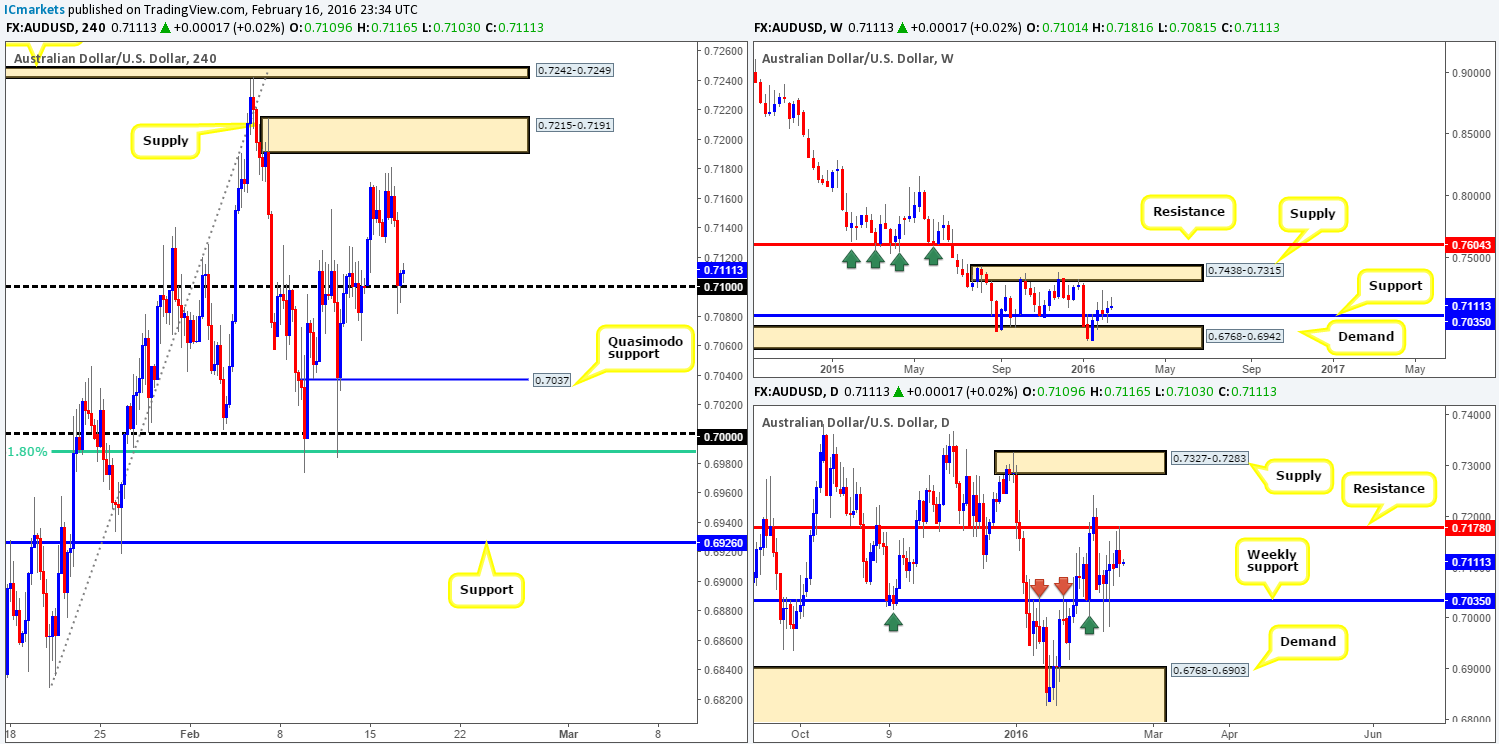
Early on in yesterday’s American session the commodity currency took a turn for the worst, falling sharply down to psychological support 0.7100, which remains bid for the time being. The catalyst for this sell-off, at least technically anyway, likely stems from price crossing swords with daily resistance at 0.7178. Providing that the bears remain dominant in this market, we could see prices retest weekly support chalked up at 0.7035 sometime soon.
Given this, buying from the 0.7100 handle is not really something we’d be comfortable with as this could simply be traders covering their shorts. What would be interesting, however, is a close below 0.7100. This would, as far as we can see, open up the pathway down to an almost hidden H4 Quasimodo support level at 0.7037 (converges with the aforementioned weekly support). For us to be permitted to trade this intraday move, price would need to retest the underside of 0.7100 followed by a lower timeframe sell setup – a break of demand, a break of a trendline support or even a collection of selling wicks around a lower timeframe resistance… Personally, we’d not be expecting price to dive much lower than the 0.7035 mark so full profits would be taken here.
Levels to watch/live orders:
- Buys: Flat (Stop loss: N/A).
- Sells: Watch for bids to be consumed around 0.7100 and look to trade any retest seen thereafter (lower timeframe confirmation required).
USD/JPY:
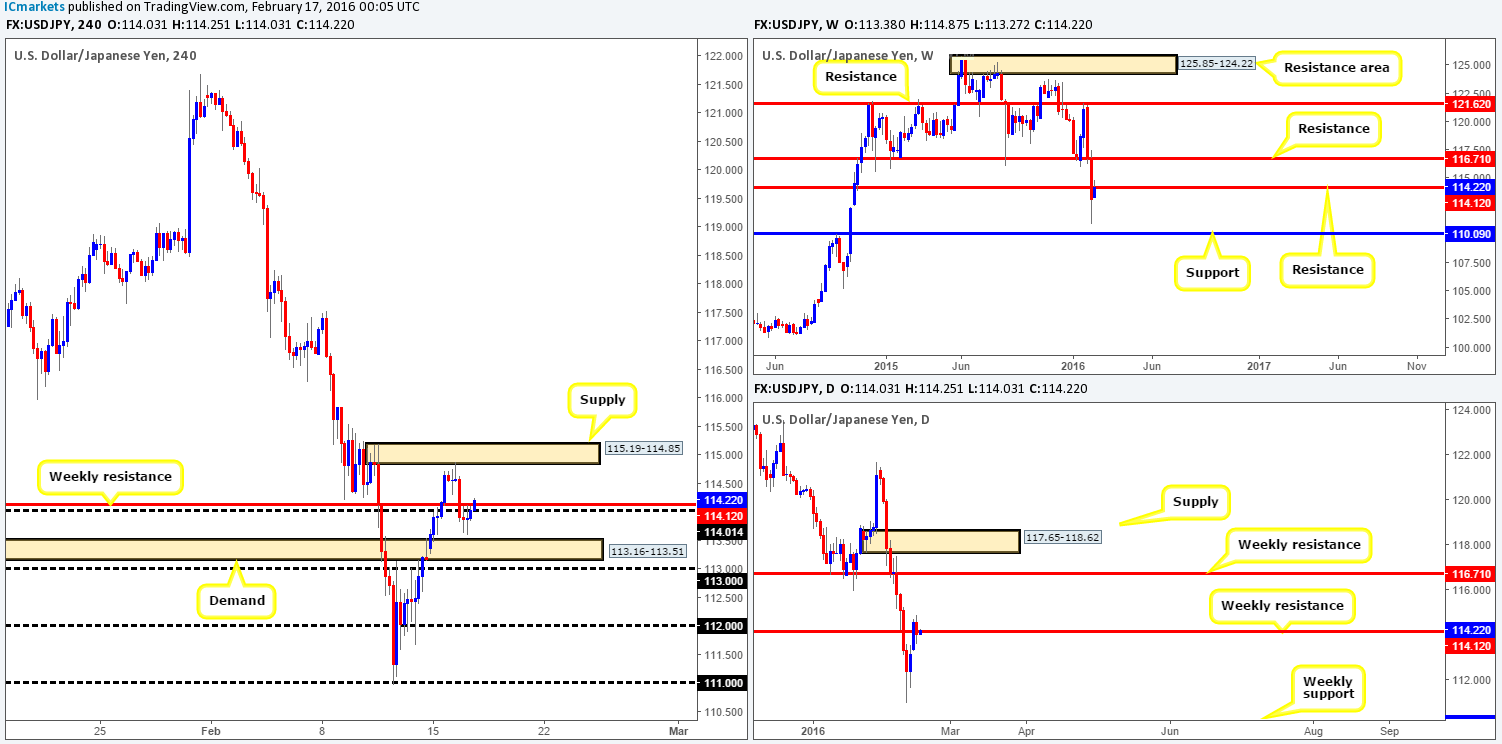
For those who read our previous report on the USD/JPY (http://www.icmarkets.com/blog/tuesday-16th-february-daily-technical-outlook-and-review/) you may recall that we spoke about entering short from the H4 supply zone seen at 115.19-114.85. Unfortunately, we were unable to pin down a lower timeframe setup from here, well done to any of our readers who managed to pocket some green pips from this move.
At the time of writing, price is seen trading back below weekly resistance at 114.12 which could encourage sellers into this market today. Despite this, shorting right now is considered a risky trade in our book due to H4 demand lurking just below at 113.16-113.51. A more conservative approach might be to wait for the 113.00 number to be engulfed since beyond this level, there’s little support seen until the112.00 handle. In addition to this, should price strike the H4 supply area mentioned above at 115.19-114.85 once again today, shorts could be possible alongside lower timeframe confirmation. In the event that the supply area fails to hold, however, then this could be an early signal that the 114.12 weekly level is not likely going to hold.
Levels to watch/live orders:
- Buys: Flat (Stop loss: N/A).
- Sells: 115.19-114.85 [Tentative – confirmation required] (Stop loss: dependent on where one confirms this area). Watch for bids to be consumed around 113.00 and look to trade any retest seen thereafter (lower timeframe confirmation required).
USD/CAD:
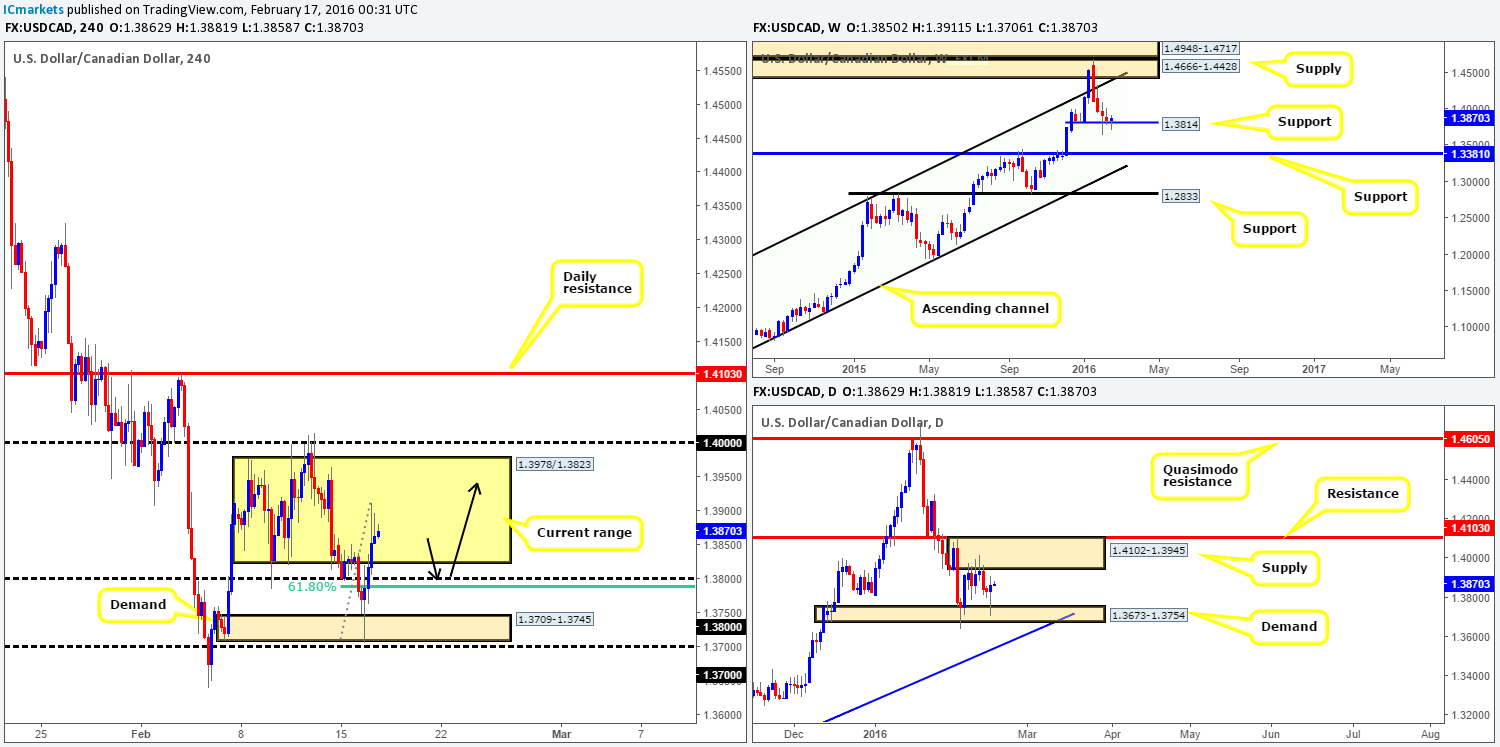
Beginning from the weekly timeframe this morning, support at 1.3814 remains intact despite the recent attempts seen to push lower. Meanwhile, down on the daily timeframe price tested demand at 1.3673-1.3754 during yesterday’s session, consequently placing the Loonie mid-range between this demand and the supply area above it at 1.4102-1.3945.
Steeping down to the H4 timeframe, we can see that demand at 1.3709-1.3745 was slightly breached yesterday before price darted north, breaking above psychological resistance 1.3800 and back into the range fixed between 1.3978/1.3823.
In light of the points made above, a trade from the 1.3800 handle looks like a reasonable possibility today as it ties in nicely with the 61.8% Fibonacci level at 1.3789 (as per the black arrows). We would highly recommend waiting for the lower timeframes to confirm this barrier though, as psychological levels such as these tend to be faked before a reaction is seen.
Levels to watch/live orders:
- Buys: 1.3800 [Tentative – confirmation required] (Stop loss: dependent on where one confirms this level).
- Sells: Flat (Stop loss: N/A).
USD/CHF:
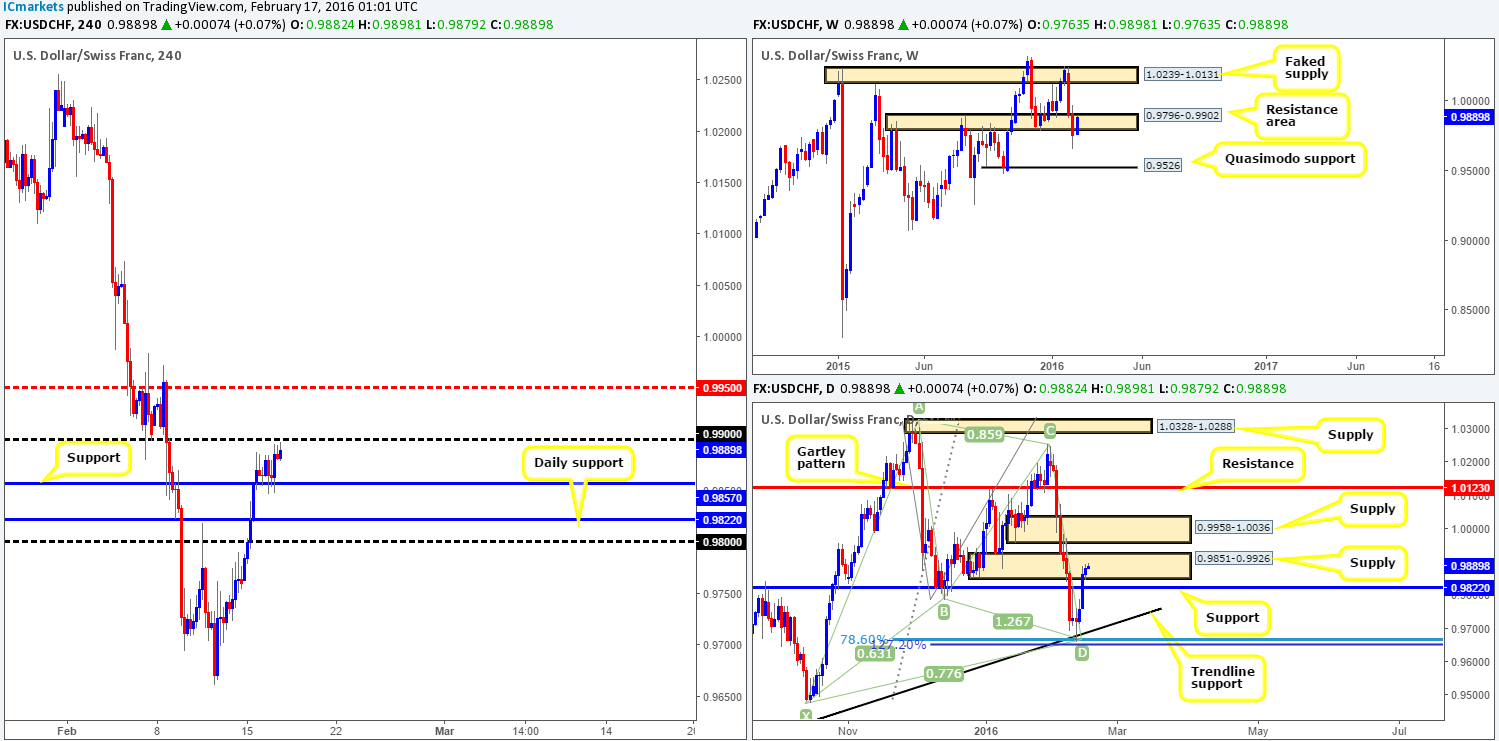
Coming at you directly from the weekly timeframe this morning, the buyers and sellers are seen battling for position within the extremes of a resistance area drawn from 0.9796-0.9902. On the assumption that this zone is consumed this week, all eyes will be on the faked supply drawn above at 1.0239-1.0131. Winding down a level, however, we can see that daily action is trading amid supply coming in at 0.9851-0.9926. As of yet, little to no selling interest has been seen here.
We are still kicking ourselves that we missed the long trade from the base of the Harmonic Gartley pattern last week, what a beautiful setup this was!
Moving down one more level to the H4 timeframe, support at 0.9857 continues to hold firm despite both the weekly and daily charts trading within supplies at the moment (see above). For all that though, there is a small collection of selling wicks currently printing beneath psychological resistance 0.9900. This, at least for us, will be a key level to watch going forward. A sustained move above could suggest that the weekly resistance area at 0.9796-0.9902 is weakening and higher prices could be on the cards. If on the other hand 0.9900 manages to suppress bids here, this has the potential to push prices back down to H4 support at 0.9857, followed closely by daily support at 0.9822. Should we manage to pin down a lower timeframe sell setup around 0.9900 today, we would take the trade, and target the above said supports. Other than this though, we’d rather remain on the sidelines until further development is seen.
Levels to watch/live orders:
- Buys: Flat (Stop loss: N/A).
- Sells: 0.9900 [Tentative – confirmation required] (Stop loss: dependent on where one confirms this level).
DOW 30:
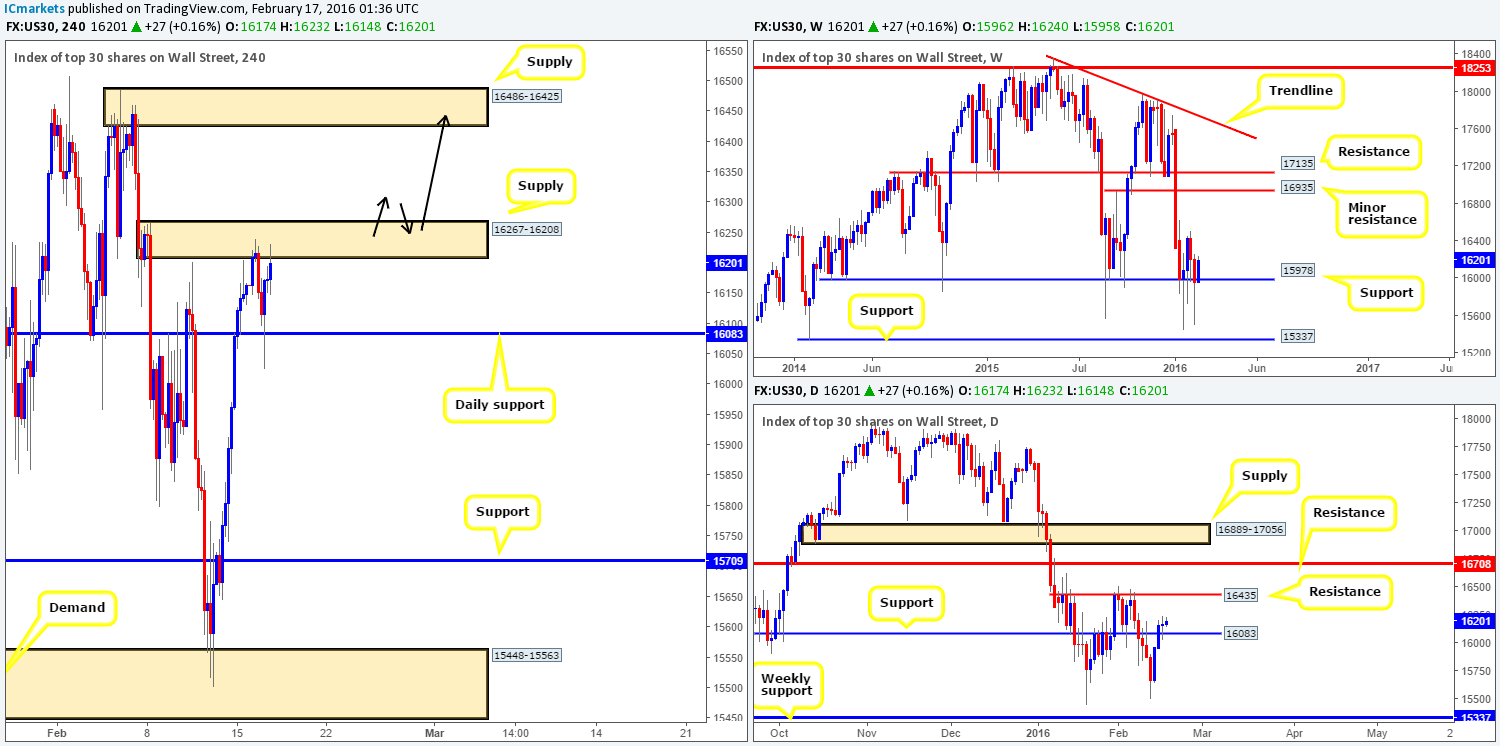
In our previous report on the DOW (http://www.icmarkets.com/blog/tuesday-16th-february-daily-technical-outlook-and-review/) we mentioned to keep an eye on the daily support level at 16083 for confirmed longs. As you can see, this hurdle did manage to hold prices higher, unfortunately though, we did not manage to locate an acceptable lower timeframe setup here – well done to any of our readers who did though!
The current H4 supply at 16267-16208, in our estimation, appears weak now which is good news for anyone who is long from 16083! Why weak when it held price lower? Well, firstly, offers around this zone have likely been weakened from yesterday’s sell-off. Secondly, check out how price has now tagged in daily buyers from the 16083 region along with weekly action trading from support at 15978.
Providing that our analysis is correct, a close above the H4 supply should take place during today’s sessions. For us to be given the green light to enter long, nonetheless, we’d need to see price retest the broken area as demand together with a lower timeframe buy signal (see black arrows). In the event that this trade comes to fruition, there’s only one take-profit target in mind for this setup – the H4 supply area penciled in at 16486-16425, which encapsulates a daily resistance level at 16435.
Levels to watch/live orders:
- Buys: Watch for offers to be consumed around 16267-16208 and look to trade any retest seen thereafter (lower timeframe confirmation required).
- Sells: Flat (Stop loss: N/A).


