
Key risk events today:
UK CPI y/y; UK PPI Input m/m; Canada CPI m/m, Common CPI y/y, Median CPI y/y and Trimmed CPI y/y; US Core Retail Sales m/m; US Retail Sales m/m; BoE Gov Carney Speaks; FOMC Members Evans and Brainard Speak; German Buba President Weidmann Speaks.
EUR/USD:
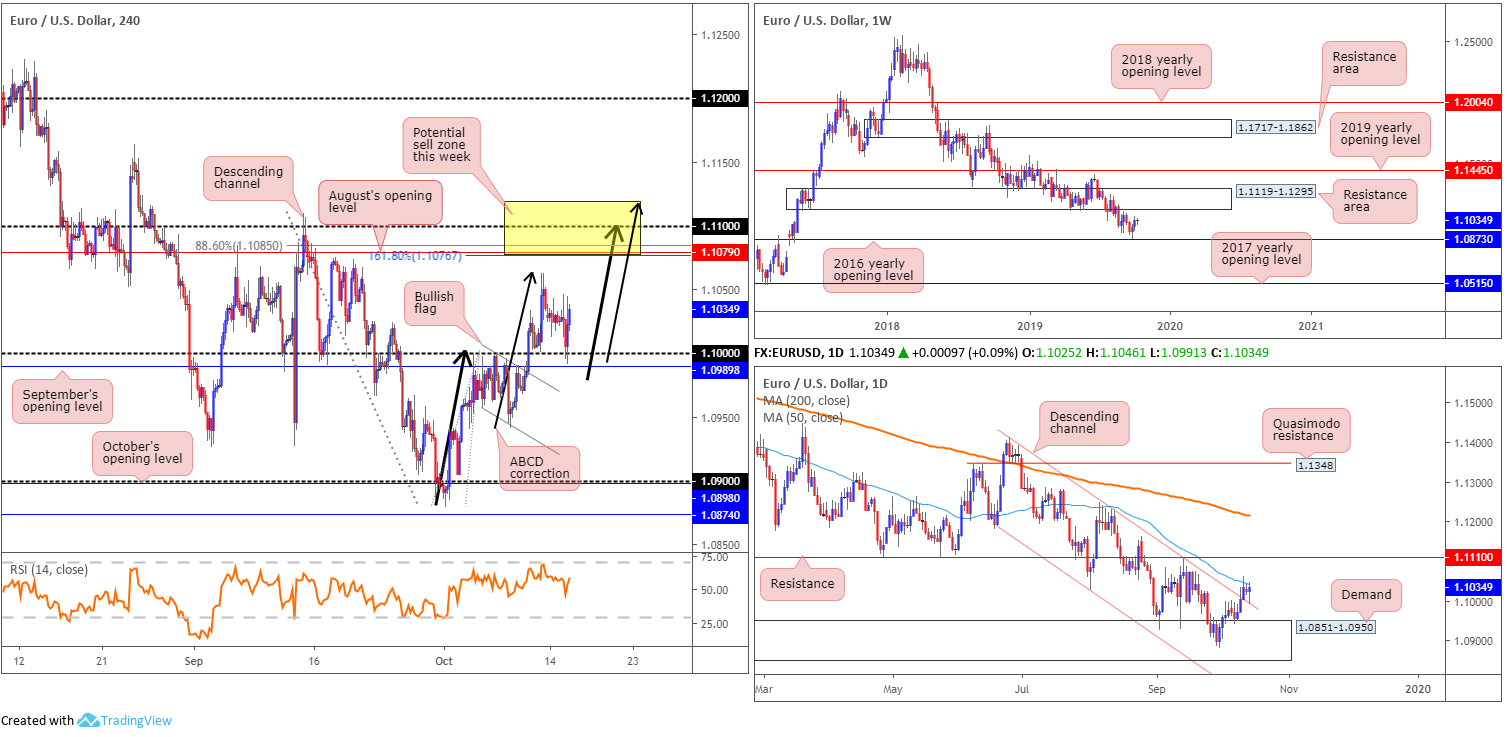
The euro settled a shade higher versus the US dollar Tuesday, following a near-to-the-point retest at the key figure 1.10. On another day of Brexit headlines, comprising largely of positive vibes, this had a weighty knock-on effect and widespread impact on risk sentiment.
EUR/USD bulls remain on solid footing north of 1.10 this morning, with the possibility of Friday’s high at 1.1062 entering the fold, followed by a particularly interesting area of resistance (yellow) between 1.1119/1.1076. August’s opening level at 1.1079, which aligns with a 161.8% Fibonacci extension at 1.1076, a 88.6% Fibonacci retracement ratio at 1.1085 – derived by taking The Golden Ratio, 0.618, square rooting it and square rooting it again to get 0.886, the 1.11 handle, daily resistance at 1.1110 and the underside of a weekly resistance area at 1.1119-1.1295. In addition to this, the yellow zone contains a H4 ABCD correction point (light black arrows) which terminates at the top edge of the zone. Similarly, H4 price broke recently broke out north from its bullish flag pattern (1.0957/1.1000), which has a measured take-profit target set at 1.11: based on the bullish flag’s preceding move added to the breakout point (heavier black arrows).
Aside from the possibility of last Friday’s high providing resistance, the 50-day SMA (blue – 1.1041) is currently in motion on the daily timeframe. Yesterday’s retest off the daily channel resistance-turned support (extended from the high 1.1412), however, may help lift prices higher.
Areas of consideration:
The H4 resistance area made up between 1.1119/1.1076 brings together several resistance points, and therefore is central to today’s outlook. A H4 bearish candlestick rotation formed within the confines of the said resistance zone will likely be considered a strong sell signal by most technicians. Entry can be found at the close of the bearish formation, though the logical position for protective stop-loss orders falls in above 1.1119.
GBP/USD:
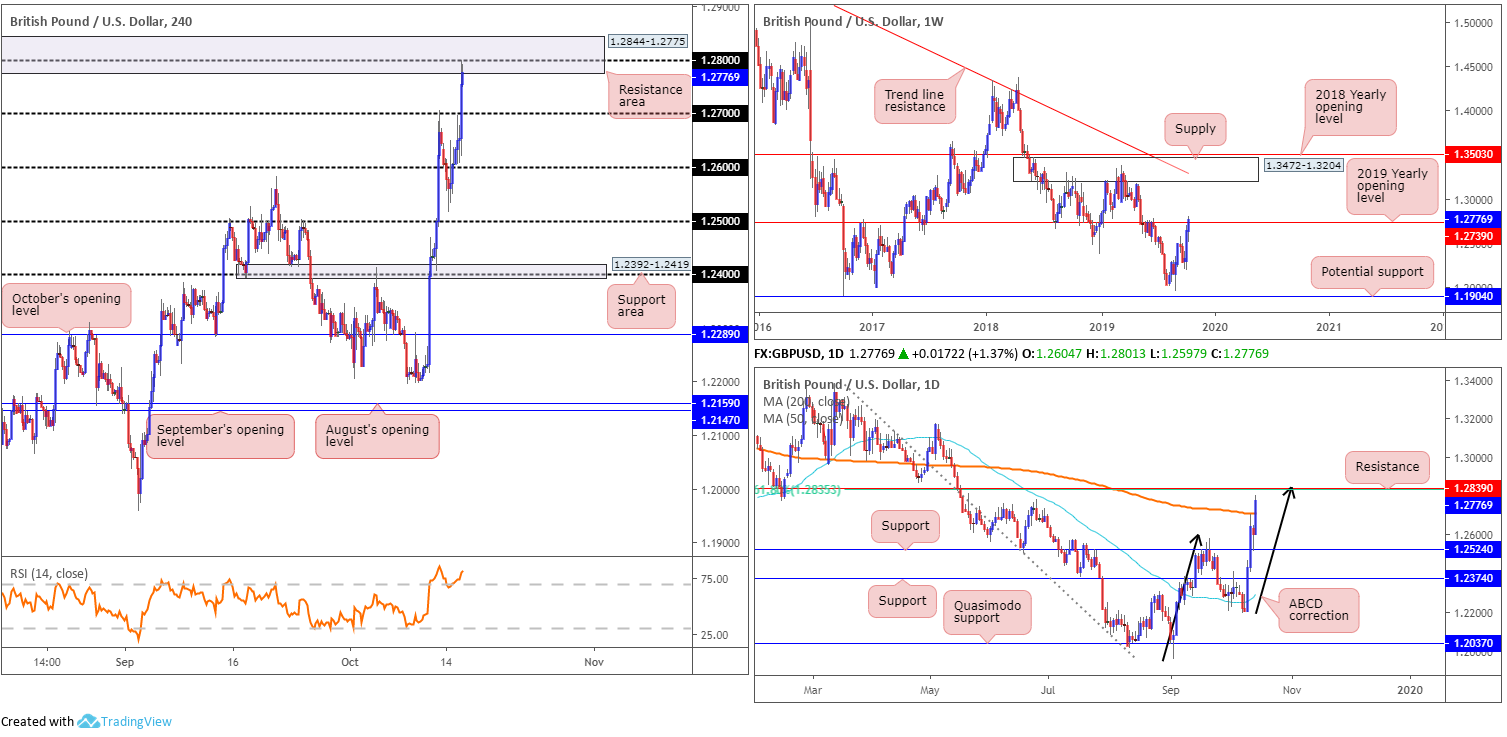
On another day of Brexit headlines, comprising largely of positive vibes, the British pound advanced across the board Tuesday.
Kicking things off from the top this morning, we can see weekly price attempting to dethrone the 2019 yearly opening level at 1.2739. If successful, this could set the long-term stage for a push to supply at 1.3472-1.3204.
Daily flow, driven by recent bidding, overthrew the 200-day SMA (orange – 1.2710) and exposed neighbouring resistance at 1.2839. Note this level also brings with it an AB=CD correction point (black arrows) at 1.2850 and a 61.8% Fibonacci retracement ratio at 1.2835.
A closer reading of price action on the H4 timeframe has the candles shaking hands with a notable resistance area coming in at 1.2844-1.2775, following a sharp break of 1.27. Within the said zone, the 1.28 handle is seen, as well as the daily resistance level highlighted above at 1.2839.
Areas of consideration:
In light of recent movement, selling at 1.2844-1.2775 without additional confirmation is a chancy move. Despite this, the noted H4 resistance area is likely of interest to many traders this morning.
In the event we whipsaw through 1.28 and test daily resistance at 1.2839, and then follow up with a close back beneath 1.28 on a H4 closing basis, this would likely be sufficient evidence to suggest sellers are involved. Entry and risk can then be measured based on the breakout candle’s structure, targeting 1.27 or the 200-day SMA as the initial take-profit target, whichever strikes first.
Alternatively, a decisive push through 1.28 may be on the cards, though until we clear daily resistance at 1.2839, longs would be considered a risky move.
AUD/USD:
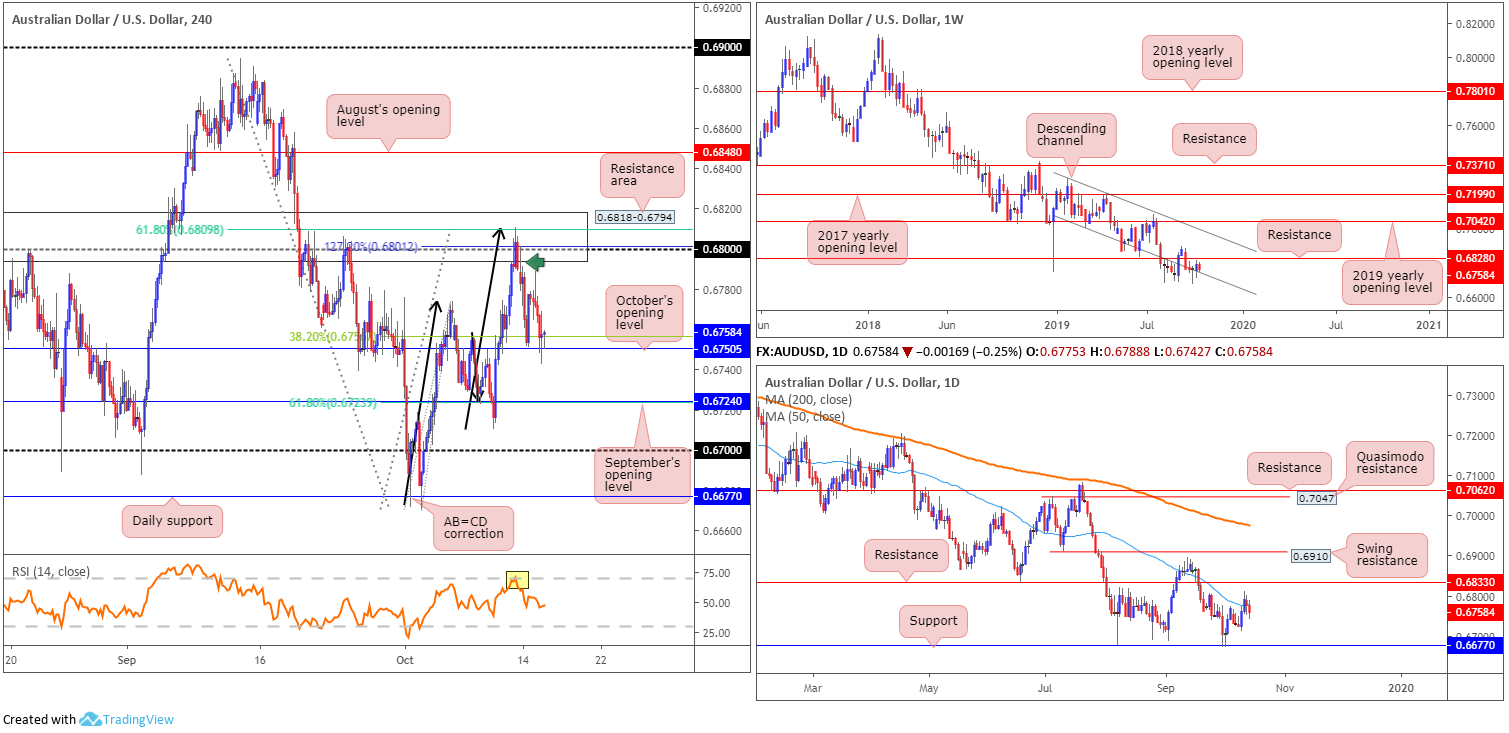
Driven on the back of waning optimism concerning US/China’s phase one deal, following reports China wants tariffs removed before committing to additional agricultural purchases, the AUD/USD probed lower for a second consecutive session Tuesday. This comes despite risk assets rallying amid speculation the EU and the UK are close to sealing a Brexit deal.
For traders who read Tuesday’s report you may recall the piece highlighted the following:
As evident from the H4 timeframe this morning, traders who sold the H4 bearish rotation candle (green arrow) out of the H4 resistance area at 0.6818-0.6794 had price strike the initial take-profit target at 0.6754 yesterday. This was a solid cue to think about reducing some of the risk and maybe banking a portion of the position. In the event we continue to explore lower ground and dethrone 0.6754/October’s opening level at 0.6750, the second take-profit target resides at September’s opening level at 0.6724/61.8% Fibonacci ratio.
As can be seen from the H4 chart this morning, the candles are challenging October’s opening level at 0.6750. This level appears somewhat fragile in view of daily price recently engulfing the 50-day SMA (blue – 0.6777). What seems to be supporting the market at the moment is the weekly channel support taken from the low 0.7003, but by and of itself, this descending line has had a spotty history given the overall primary trend remains facing a southerly bearing.
Areas of consideration:
Traders who remain short from 0.6818-0.6794 are likely watching for a break of 0.6750 today in order to reach 0.6724. Aside from this, there is not much else to hang one’s hat on in terms of high-probability trading opportunities.
USD/JPY:
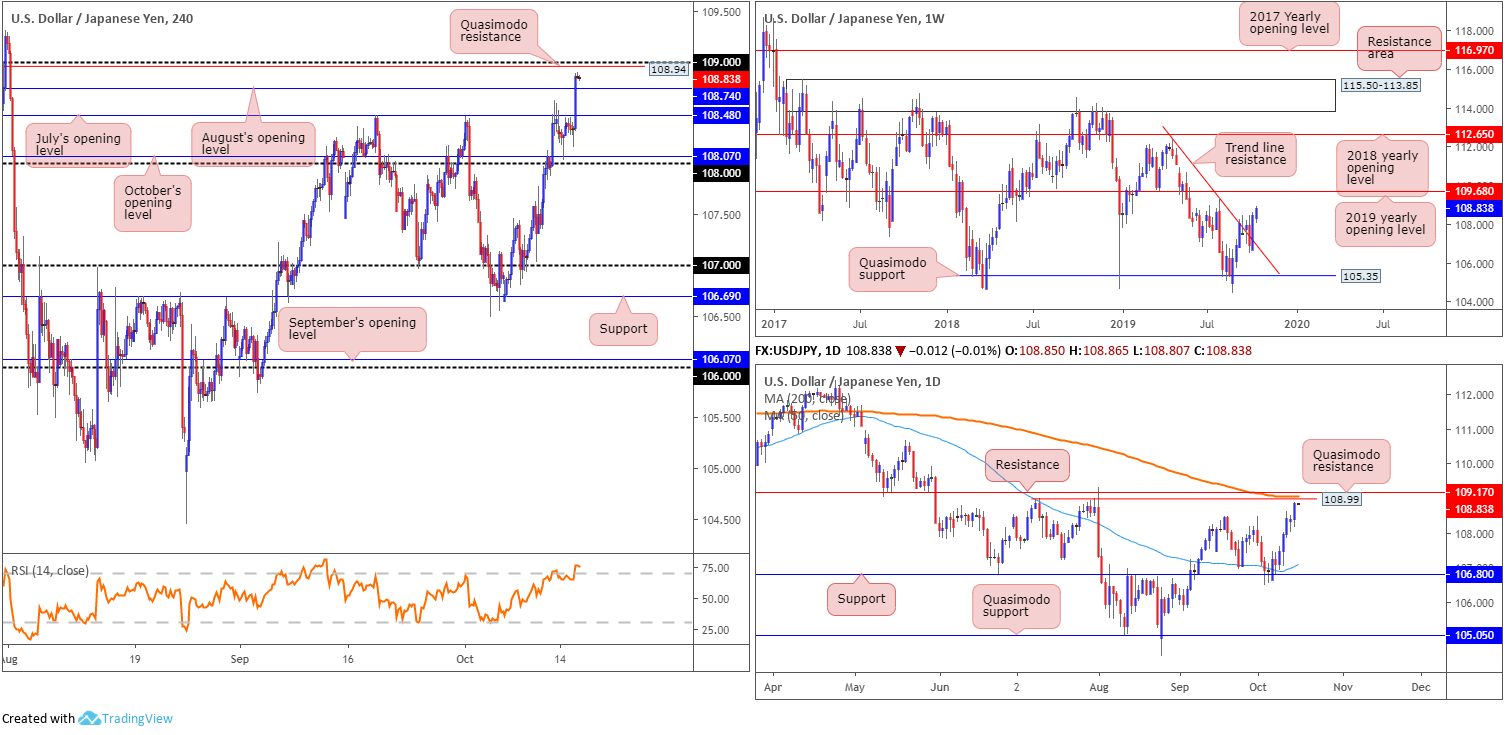
The safe-haven Japanese yen ‘hit the ropes’ Tuesday amid renewed hopes the UK and the EU may clinch a Brexit deal. Boosted by upbeat market sentiment, the USD/JPY toppled both July’s opening level at 108.48 and August’s opening level at 108.74. As you can see, this has positioned the H4 candles within touching distance of 109, which happens to align with Quasimodo resistance at 108.94.
Latest from the weekly timeframe has the current candle extending gains following the break of trend line resistance (etched from the high 112.40) last week. The next upside target from this point is seen at the 2019 yearly opening level drawn from 109.68. Although weekly price appears to be gearing up for additional upside, daily price is closing in on Quasimodo resistance at 108.99, the 200-day SMA (orange – 109.06) and resistance coming in at 109.17.
Areas of consideration:
The 109 handle, given it holds notable confluence from the H4 and daily timeframes, is likely a barrier worthy of interest this morning. The only grumble, of course, is the fact weekly price demonstrates scope to run beyond 109 to 109.68. To help overcome this, interested sellers from 109 are urged to consider waiting for additional H4 candlestick confirmation to form before pulling the trigger – think bearish engulfing or shooting star patterns, or even a solid full-bodied bearish candle. By doing so, not only does this identify seller intent, it also provides entry and risk levels to work with.
USD/CAD:
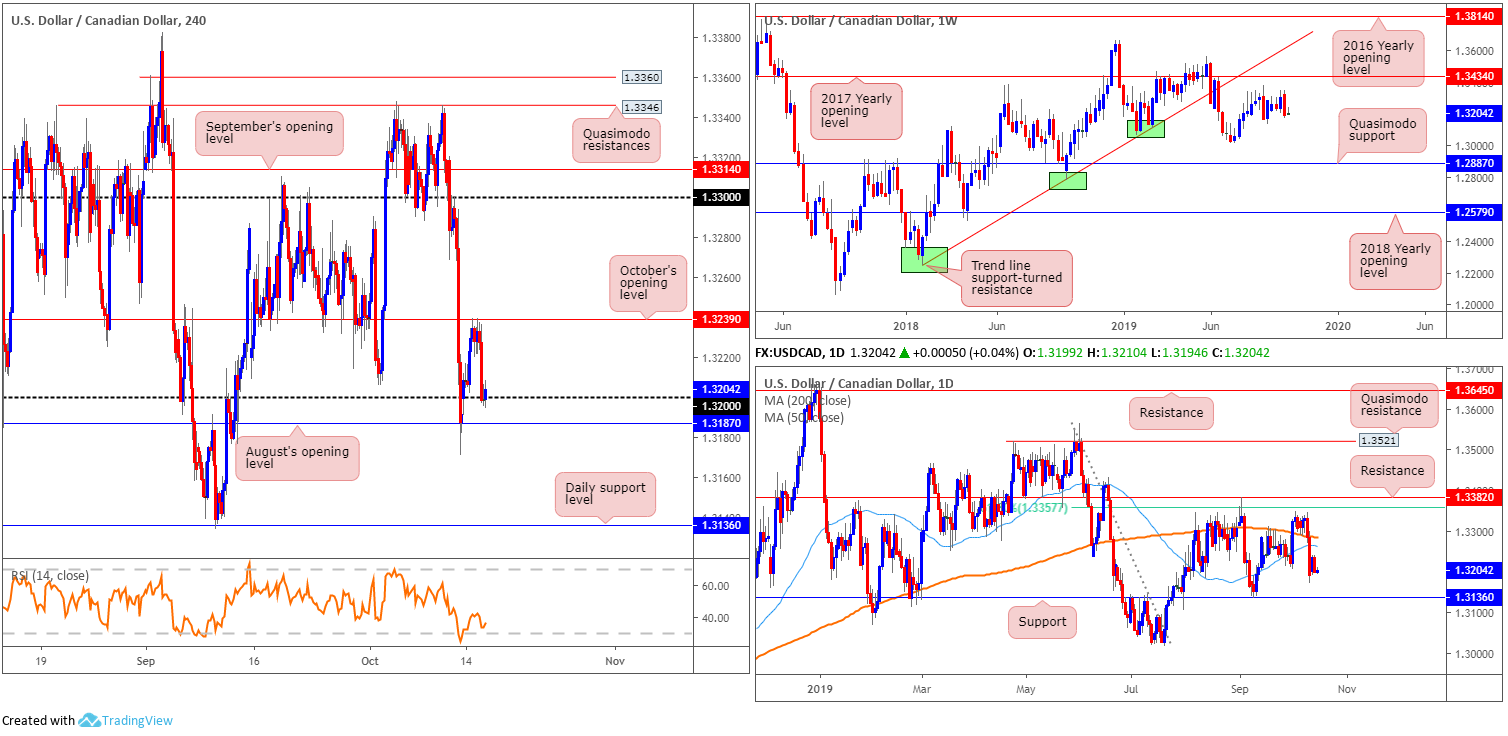
Kicking things off from the top this morning, traders likely note limited movement on the weekly timeframe so far this week. This follows last week’s somewhat imposing bearish engulfing candle. Support can be seen in the form of the 1.3015 July 15 low, followed by Quasimodo support stationed at 1.2887. The primary trend in this market has remained north since bottoming in September 2017. Currently, though, we appear to be in a secondary downtrend, with the peak set at 1.3661.
Daily flow, on the other hand, remains languishing south of the 200-day SMA (orange – 1.3286) and the 50-day SMA (blue – 1.3264). Note these lines are seen closing in on each other (converging) for a possible crossover scenario (also known as the Golden Cross). Outside of these lines, support on the daily timeframe can be seen at 1.3136 – holding reasonably significant history – as well as resistance drawn from 1.3382, sited just north of a 61.8% Fibonacci ratio at 1.3357.
October’s opening level at 1.3239 remained defensive Tuesday, containing several upside attempts. Tuesday settled at 1.32 and is seen holding as we head into Asia Pac hours. Directly beneath 1.32, August’s opening level at 1.3187 is visible, while above 1.3239, we could witness a run towards the 1.33 handle.
Areas of consideration:
With 1.32 in motion, a break of this barrier, along with August’s opening level at 1.3187, unlocks the door to a possible move towards daily support mentioned above at 1.3136. This offers sufficient room to secure reasonable risk/reward. For conservative traders, waiting for a retest of 1.32/1.3187 to form before committing funds might be an idea. This may even allow for a better entry (entry and risk can be calculated base on the rejecting candlestick’s open and high price).
As underlined in Tuesday’s report, the space visible north of October’s opening level at 1.3239 is likely enticing for longs, in the event we push higher, targeting 1.33. A break above 1.3239, followed up with a retest, therefore, might be of interest to some traders (entry and stops can be positioned according to the rejection candle’s framework). The downside to this move, however, are that the two simple moving averages plotted on the daily timeframe which enter the fold before H4 action reaches 1.33.
USD/CHF:
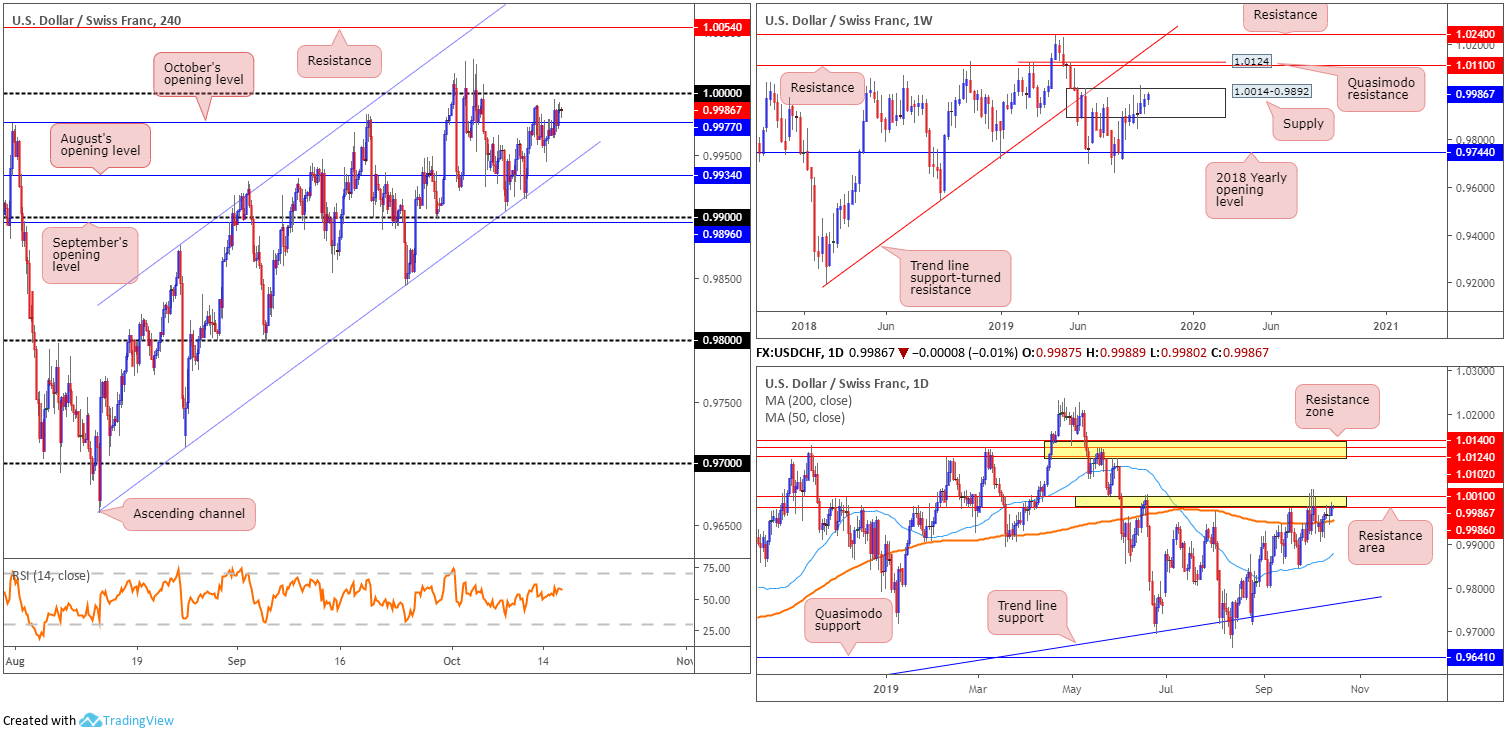
USD/CHF movement traded mostly subdued Tuesday, despite diminishing safe-haven demand on renewed prospects of a Brexit deal. Latest on the H4 timeframe reveals October’s opening level at 0.9977 gave way, with buyers and sellers likely looking to square off at 1.0000 (parity) sometime today. Above 1.0000, resistance falls in at 1.0054. In addition to this, since mid-August, the pair has been compressing within an ascending channel formation (0.9659/0.9877).
Meanwhile, weekly price remains confined within the walls of supply priced in at 1.0014-0.9892, with sellers struggling to harvest anything meaningful to the downside. Recent moves struck multi-month peaks at 1.0027, possibly tripping some buy stops and weakening sellers. Consequently, resistance coming in at 1.0110, which happens to merge closely with Quasimodo resistance at 1.0124, may enter the mix over the coming weeks. According to the primary trend, price reflects a somewhat bullish tone. However, do remain aware we have been rangebound since the later part of 2015 (0.9444/1.0240).
The resistance area (yellow) stationed on the daily timeframe at 1.0010/0.9986 is a prominent structure. Recent buying brought the unit back into contact with the said zone, with the 200-day SMA (orange – 0.9955) lurking just beneath it.
Areas of consideration:
Considering recent movement, 1.0000 shifts into focus this morning. A break of this psychological boundary may witness a rally towards H4 resistance at 1.0054. Traders could find entry on the breakout candle or on the back of a retest forming.
A decisive H4 close above 1.0000 is not only considered a bullish indicator on the H4 scale, it is likely to be viewed as a sign of strength on the higher timeframes, underlining both the daily resistance area at 1.0010-0.9986 and the weekly supply at 1.0014-0.9892 may eventually give way.
Dow Jones Industrial Average:
Major US equity benchmarks advanced across the board Tuesday as markets cheered the possibility of a Brexit deal, while considering the implications of a partial US/China trade deal announced last Friday. The Dow Jones Industrial Average added 237.44 points, or 0.11%; the S&P 500 also added 29.53 points, or 1.00%, and the tech-heavy Nasdaq 100 advanced 100.52 points, or 1.28%.
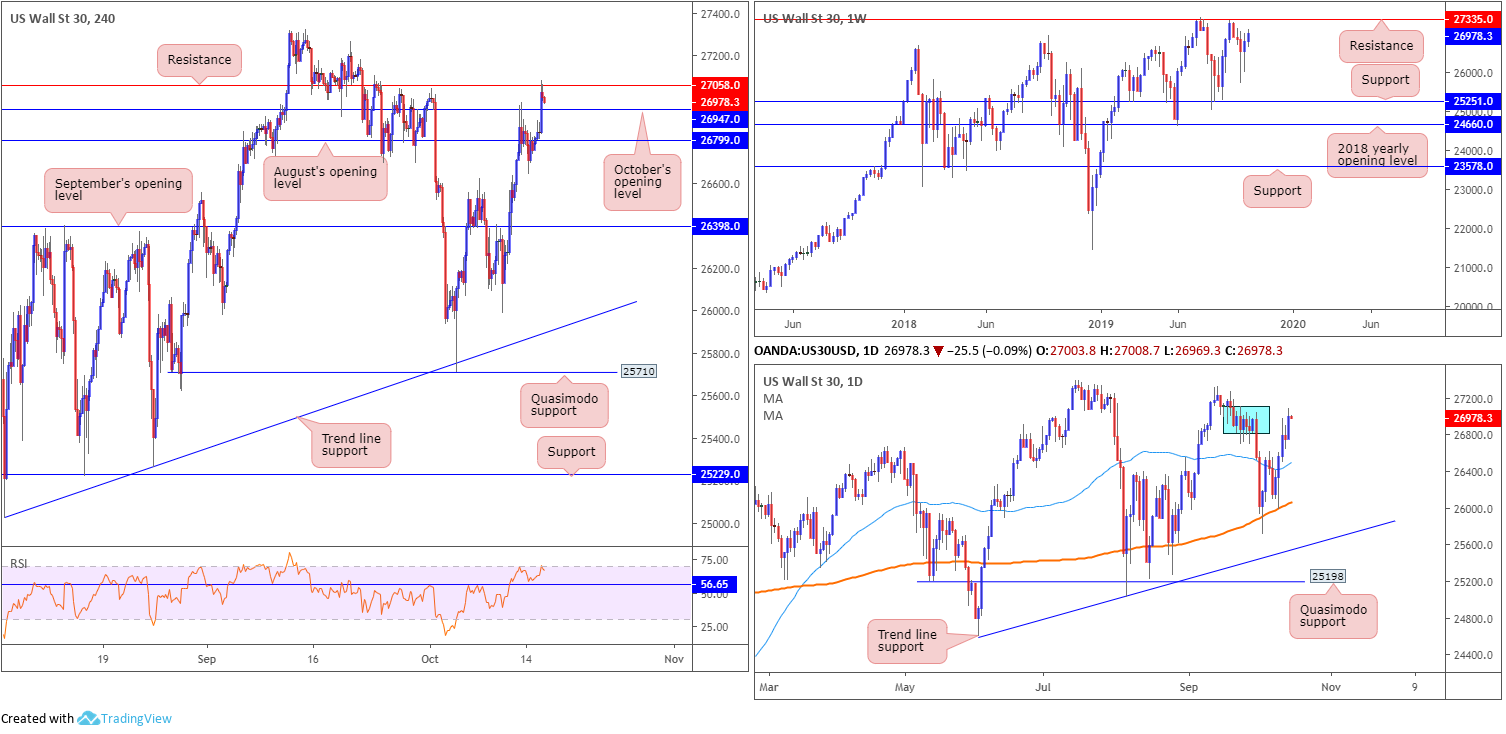
Technically, the ducks are being lined up for a possible approach towards weekly resistance at 27335, sited only a few points south of the all-time high 27388. Despite a minor setback to 21452, the primary trend in this market remains facing northbound.
Research on the daily timeframe places a bold question mark on supply between 27110-26813 (blue – positioned just south of weekly resistance at 27335), having noted limited downside attempts since the unit tested the area. It may also interest some traders to note the 200/50-day SMAs both face north.
Across the page on the H4 timeframe, resistance at 27058 entered the mix as we headed into the close, after engulfing August and October’s opening levels at 26799 and 26947, respectively. Above 27058, limited supply is evident; therefore, a break of 27058 could signify a violation of daily supply at 27110-26813 may be on the cards along with a run towards weekly resistance at 27335.
Areas of consideration:
A H4 close above 27058 will highlight potential bullish scenarios to weekly resistance at 27335. Conservative traders will likely require at least a retest of 27058 to play out before pulling the trigger (entry and risk can then be measured off the rejection candle’s structure).
XAU/USD (GOLD):
Upbeat risk sentiment, largely surfacing on the back of Brexit optimism, weighed on the yellow metal Tuesday, down 0.84% vs. the buck.
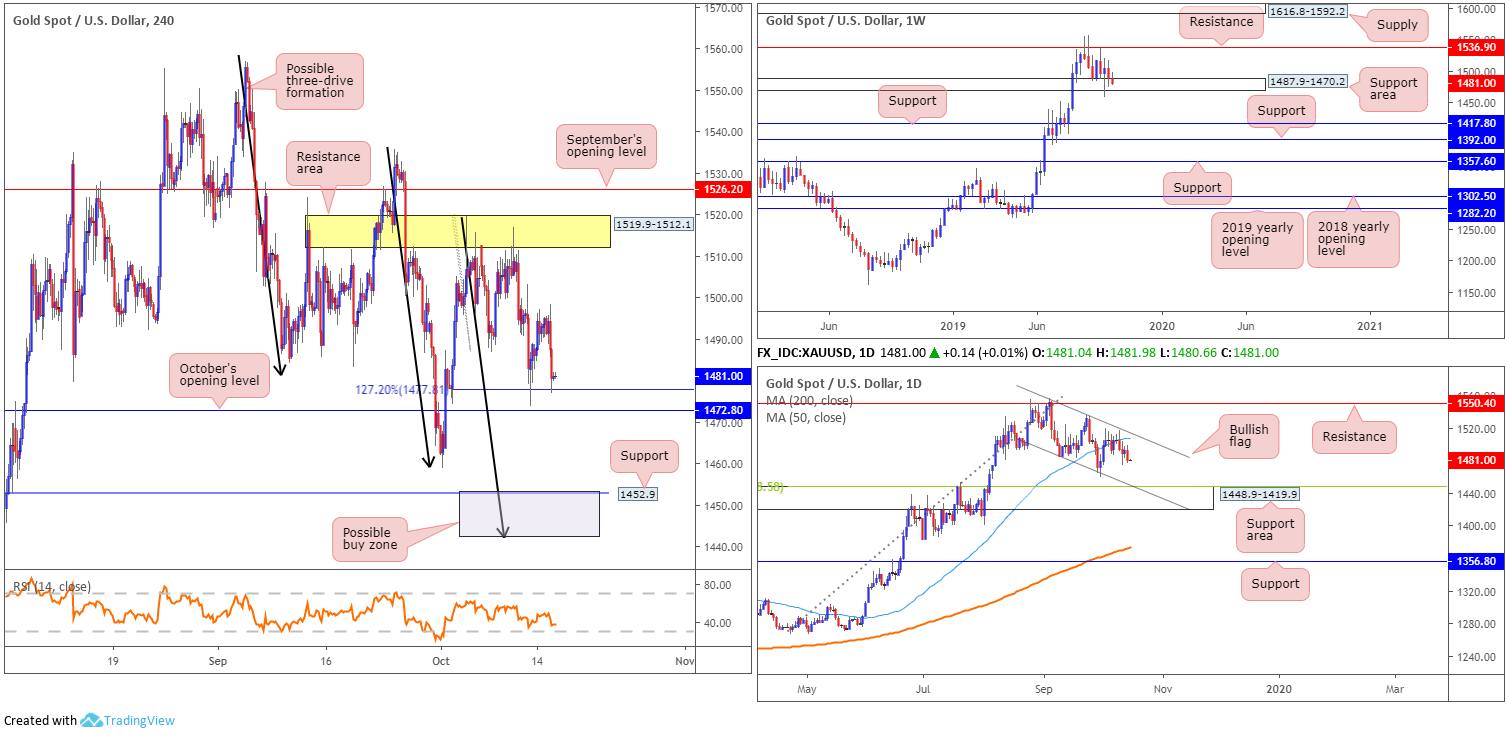
In terms of the overall technical picture, weekly price continues to engage with a support area at 1487.9-1470.2, though after having its lower edge breached two weeks ago, buyers appear lacking. To the upside, nonetheless, resistance is seen at 1536.9, whereas two layers of support are visible at 1392.0 and 1417.8 in the event we push for lower ground. In terms of the longer-term primary trend, gold has been trading northbound since the later part of 2015.
Daily flow shows a bullish flag has been in motion since early September (1557.1/1485.3). Last week saw the unit cross beneath its 50-day SMA (blue – 1506.7), consequently opening downside to a possible test of a support area coming in at 1448.9-1419.9 (which happens to have its upper edge bolstered by a 38.2% Fibonacci ratio 1448.5 and a channel support [taken from the low 1485.3]).
Lower on the curve, we have H4 price testing a 127.2% Fibonacci extension point at 1477.8, closely shadowed by October’s opening level at 1472.8. Beyond here, the October 1st low 1458.9 is in sight, followed by support coming in at 1452.9.
Areas of consideration:
In essence, the unit remains entrenched within a long-term uptrend, though shows signs of weakness at the current weekly support area. Daily price demonstrates the market has room to press lower until reaching a support area at 1448.9-1419.9. H4 price is testing Fibonacci support at 1477.8, with October’s opening level at 1472.8 sited as the next point of interest. The grey zone between 1442.1/1452.9 is considered a potential buy zone, given it is formed by reasonable H4 support and a possible three-drive formation (black arrows), as well as being located within the said daily support area.
The accuracy, completeness and timeliness of the information contained on this site cannot be guaranteed. IC Markets does not warranty, guarantee or make any representations, or assume any liability regarding financial results based on the use of the information in the site.
News, views, opinions, recommendations and other information obtained from sources outside of www.icmarkets.com.au, used in this site are believed to be reliable, but we cannot guarantee their accuracy or completeness. All such information is subject to change at any time without notice. IC Markets assumes no responsibility for the content of any linked site.
The fact that such links may exist does not indicate approval or endorsement of any material contained on any linked site. IC Markets is not liable for any harm caused by the transmission, through accessing the services or information on this site, of a computer virus, or other computer code or programming device that might be used to access, delete, damage, disable, disrupt or otherwise impede in any manner, the operation of the site or of any user’s software, hardware, data or property.


