EUR/USD:
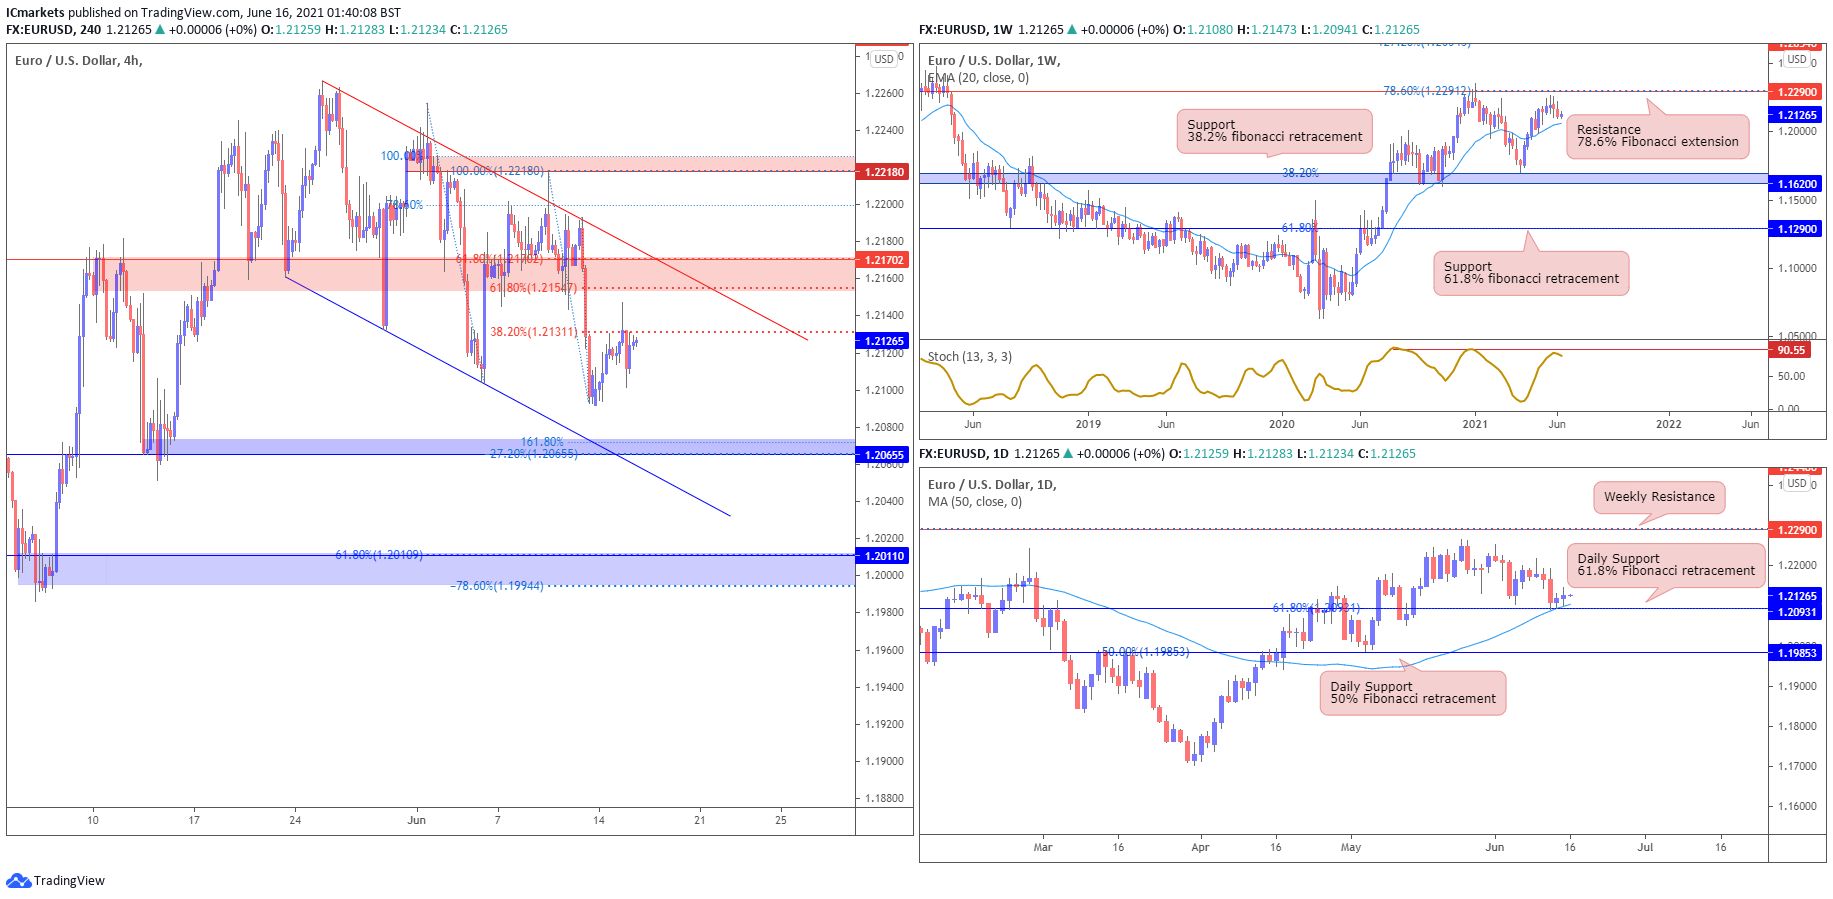
Looking at the weekly chart, we can see that prices have pulled back and there could potentially be further bearish pressure to our 20 EMA at 1.20600. On the daily chart price bounced off 1.20931, in line with 50 MA and 61.8% on Fibonacci retracement where there could potentially be a short-term bounce before facing further bearish pressure to retest 1.20600 at weekly 20 EMA.
On the H4 timeframe, prices are consolidating in the middle of the descending channel making lower highs and lower lows. Prices pulled back from 1.21311 resistance yesterday, which aligns with 38.2% Fibonacci retracement. There could potentially be further bearish pressure to test 1.20655, in-line with our 27.2% Fibonacci extension, descending trendline support and weekly 20 EMA. This would be the key support level to monitor for today. If price breaks the level there could be further bearish pressure to 1.20110, in-line with our -61.8% and -78.6% Fibonacci extension.
If price rebounce from here, it could face further bearish pressure at 1.21702, in-line with our 61.8% Fibonacci retracement and overlap support-turned-resistance. If the bounce continues, the next level of resistance will be at 1.22180, in-line with our 100%Fibonacci extension and swing high overlap resistance.
Areas of consideration:
- H4 time frame, support level at 1.20655
- H4 time frame, resistance level at 1.21702 and 1.22180
GBP/USD:
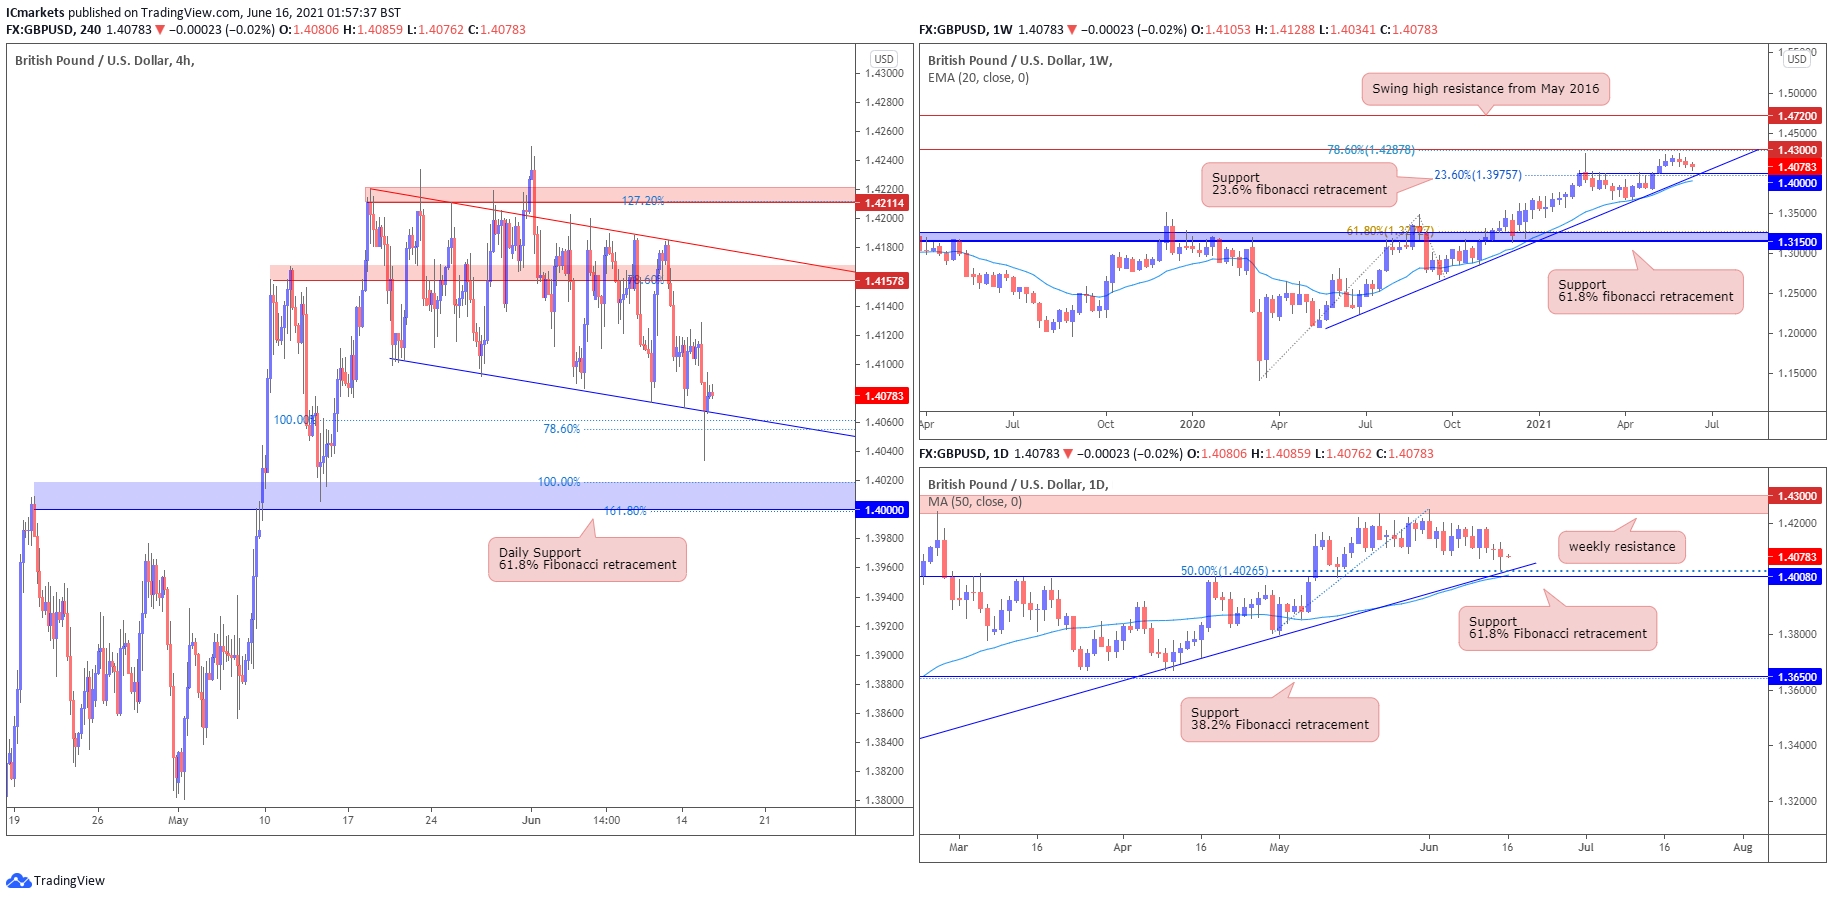
Looking at the weekly chart, we can see that prices have pulled back but still above our ascending trend line and support at 1.40000 where we could potentially have pull-back before further upside. On the daily time frame, price rebounded near 1.40265, in-line with Fibonacci retracement and ascending trendline support and 50MA.
On the H4 timeframe, prices are consolidating sideways in the lower end of the descending channel, where it rebounded from 1.40265 on Tuesday, in-line with Fibonacci retracement and ascending trendline support and 50MA. If price breaks this level, the next support will be at 1.40000, in line with 100%, 161.8% Fibonacci extension, 50MA and ascending trendline support from the daily.
If price rebound from here, there could potentially be bearish pressure at 1.41578, in line with 78.6% Fibonacci extension and descending trendline resistance. If the bounce continues, the next resistance level at 1.42114, in line with 127.2% Fibonacci extension and overlap swing high resistance.
Areas of consideration:
- H4 time frame, 40000 support level
- H4 time frame, 1.41578 and 1.42114 resistance level
AUD/USD:
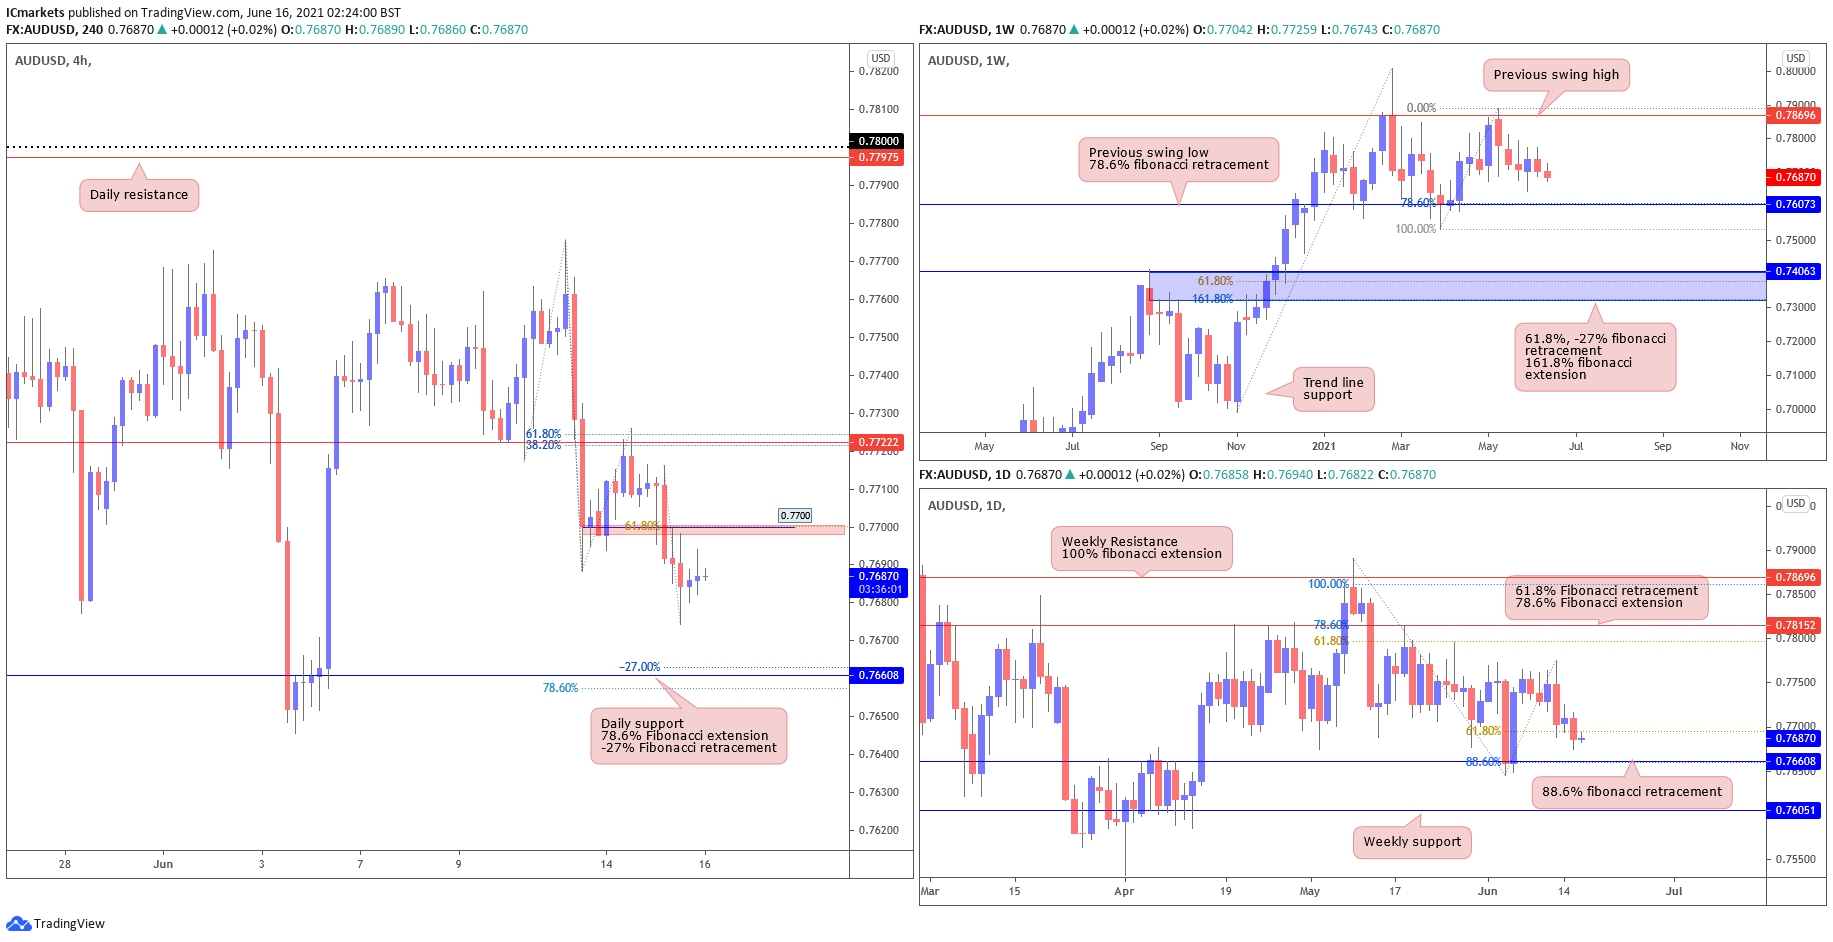
From the Weekly timeframe, we see price trending sideways where it may return down towards 0.76073, in line with previous swing low and 78.6% fibonacci retracement. From the daily timeframe, we see price breaking beneath the 61.8% fibonacci retracement at 0.76938, where we may see a push down further towards 0.76608, in line with 88.6% fibonacci retracement.
On the H4 timeframe, we see price reversed from 0.77222, in line with 61.8% fibonacci extension, 38.2% fibonacci retracement, and horizontal graphical overlap. From here, we are seeing price move down towards 0.76608 which is in line with 78.6% fibonacci extension, -27% fibonacci retracement, and daily support. Currently price is making a pullback towards the 0.77 major level, in line with 61.8% fibonacci retracement and horizontal graphical overlap. From here, we can consider taking the short in line with our bearish view.
Areas of consideration:
- H4 timeframe, price may reverse from 0.77 towards 0.76608
- Daily and weekly time frames showing slight bearish pressure.
USD/JPY
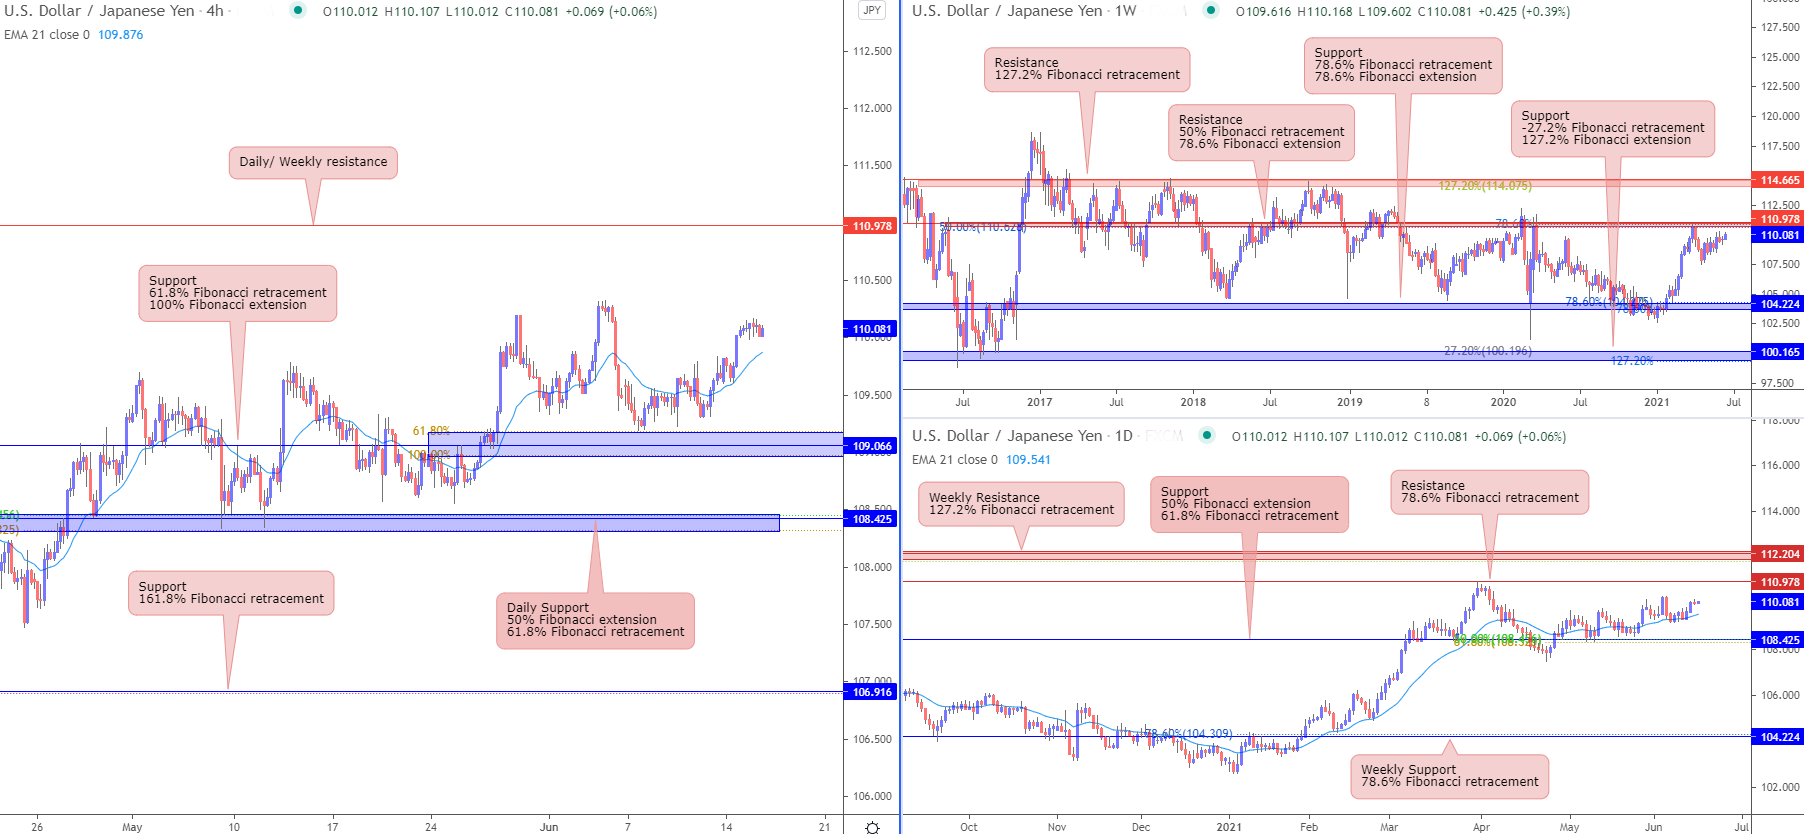
From the weekly timeframe, prices are facing resistance from horizontal swing high resistance which coincides with 50% Fibonacci retracement and 78.6% Fibonacci extension, taking support from 104.224 level which is in line with 78.6% Fibonacci retracement and 78.6% Fibonacci extension. On the daily time frame, prices are facing support from 108.425 level which coincides with 61.8% Fibonacci retracement and 50% Fibonacci extension. Prices might bounce towards daily resistance level 110.978 in line with 78.6% Fibonacci retracement. Daily EMA is also below prices, showing a bullish pressure for prices.
On the H4 timeframe, prices are bouncing from 109.066 level in line with 100% Fibonacci extension and 61.8% Fibonacci retracement towards daily resistance level 110.978. Otherwise, if prices did not push up further, prices could fall and take support on 108.425 level, in line with daily support level. Indicators on the daily timeframe suggest that the pullback is temporary and there is still a long term bullish pressure for prices. EMA is also below prices, showing a bullish pressure for prices.
Areas of consideration:
- On the H4, prices might push up towards 110.978 daily resistance level
- 066 support level on the H4 timeframe
- 425 support level on the daily timeframe
USD/CAD:
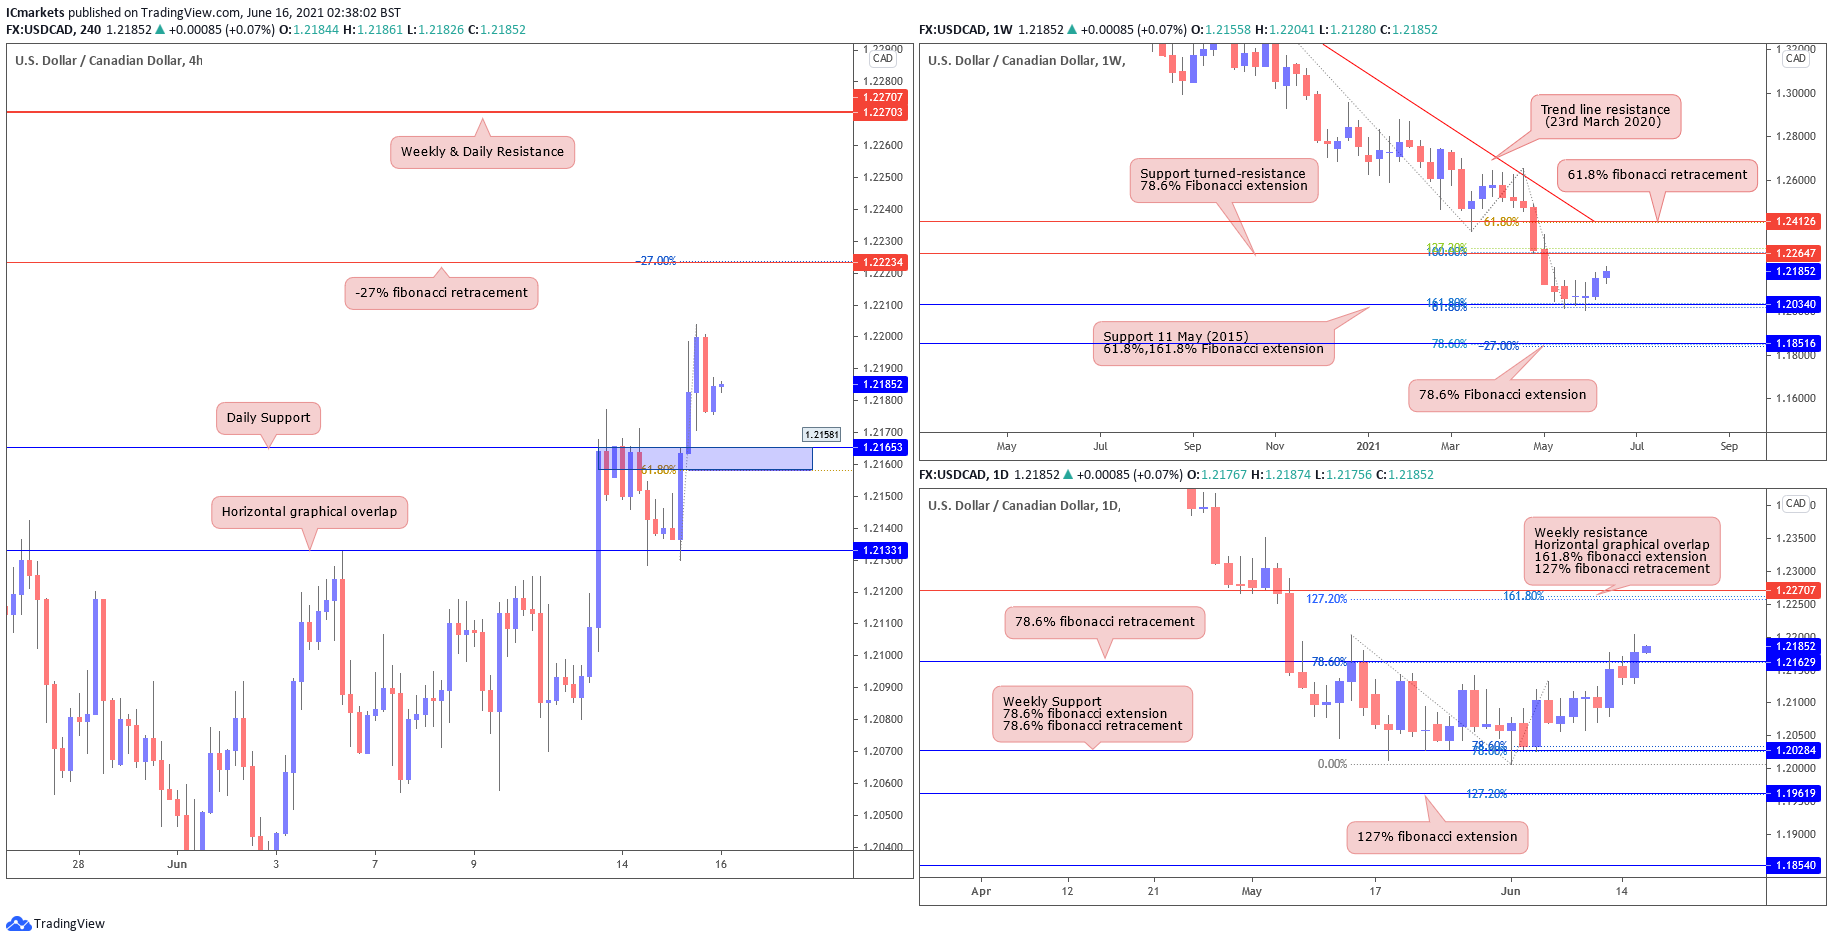
From the Weekly timeframe, we see price pushing higher away from the support level 1.20340, in line with support from 11 may (2015), 61.8% and 161.8% fibonacci extension level, where we may see a push towards the 1.22647 level. On the daily timeframe, we see price broken above the level of 1.21629, in line with 78.6% fibonacci retracement. We may see a push up towards 1.22707, in line with Weekly resistance, 161.8% fibonacci extension and horizontal graphical overlap.
The H4 timeframe shows price approaching the 1.21581 level, in line with 61.8% fibonacci retracement, Daily support and horizontal graphical overlap. From here, we may look for a long position towards 1.22234 level, in line with the -27% fibonacci retracement.
Areas of consideration:
- The weekly and daily time frame shows a weak bullish momentum.
- On H4, price may pull back and bounce from 1.22234 towards 1.21581.
USD/CHF:
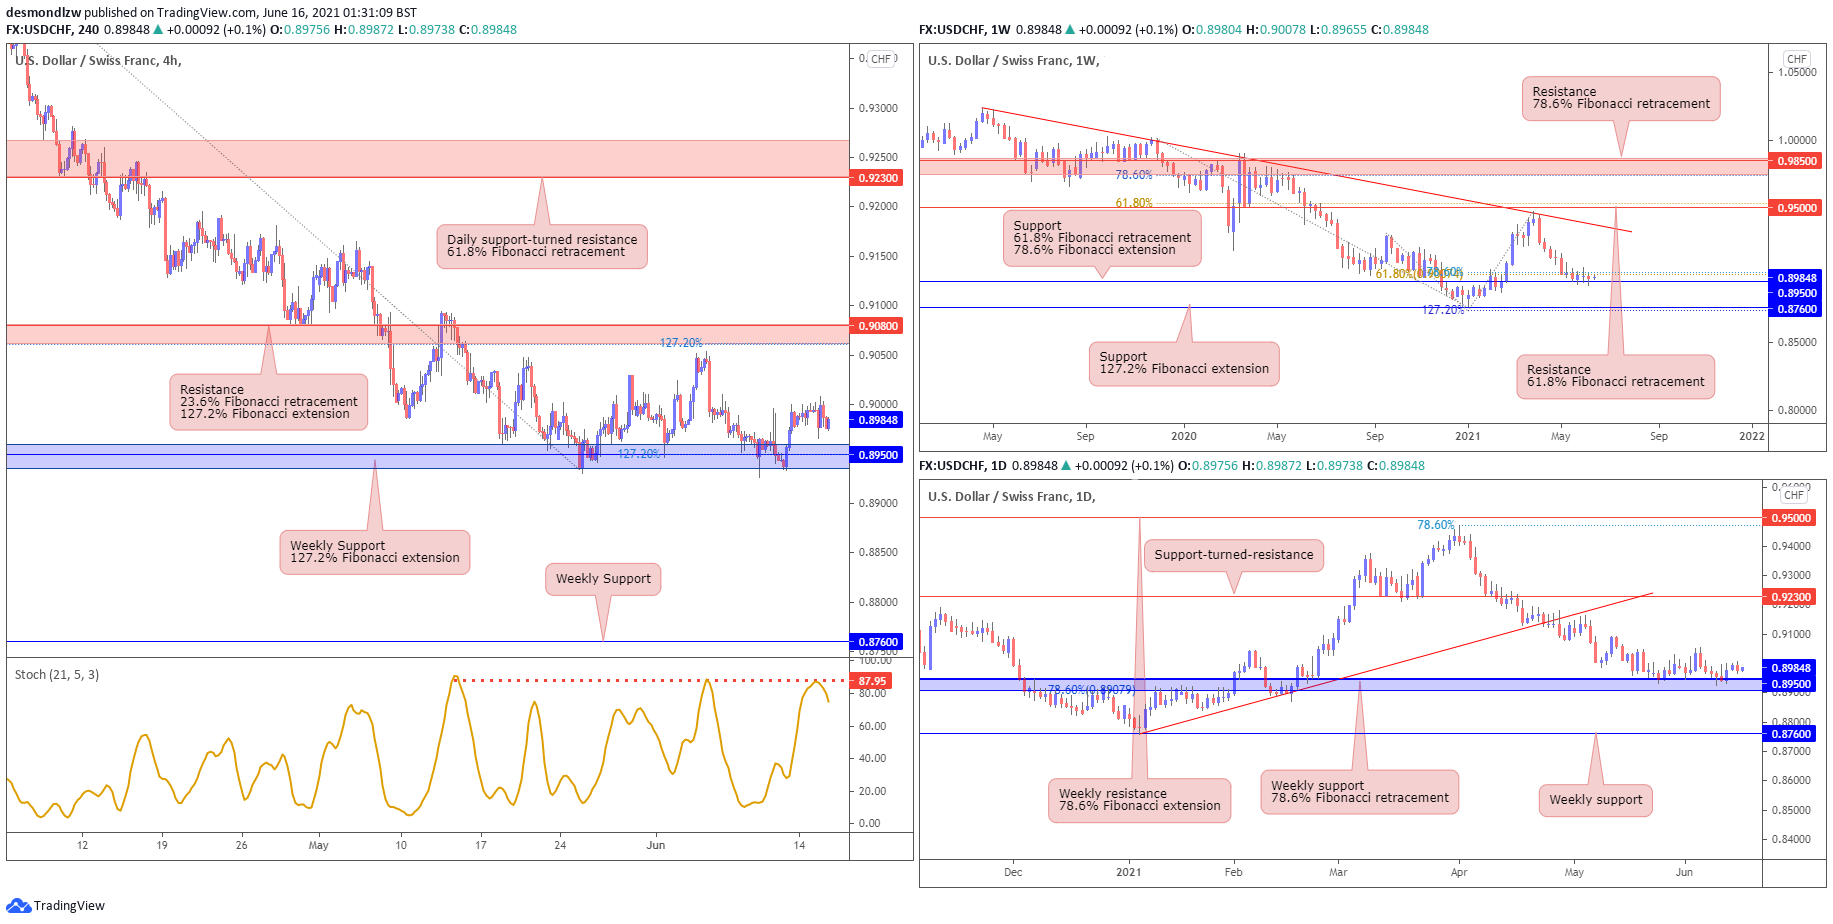
USD/CHF is now testing the weekly 0.89500 support, in line with 61.8% Fibonacci retracement and 78.6% Fibonacci extension. The daily chart shows that price is now holding below the key daily 0.92300 support-turned-resistance, and has also broken below the ascending trendline support-turned-resistance. The weekly 0.89500 support level is a key level to watch.
On the H4 chart, we can see that price has bounced from the key weekly 0.89500 support level, in line with 61.8% and 127.2% Fibonacci extension, and is re-approaching the 0.90800 resistance. We note that Stochastics has reversed from the upper resistance level, showing signs of possible bearish pressure. In this scenario, we could see price reverse below the 0.90800 resistance and drop further from there. A break and close below the key 0.89500 support would see price swing towards the next weekly support.
Areas of consideration:
- The 0.89500 weekly support is a key intraday level to watch.
- Stochastics is showing signs of possible bearish pressure as it has reversed from the upper resistance level.
Dow Jones Industrial Average:
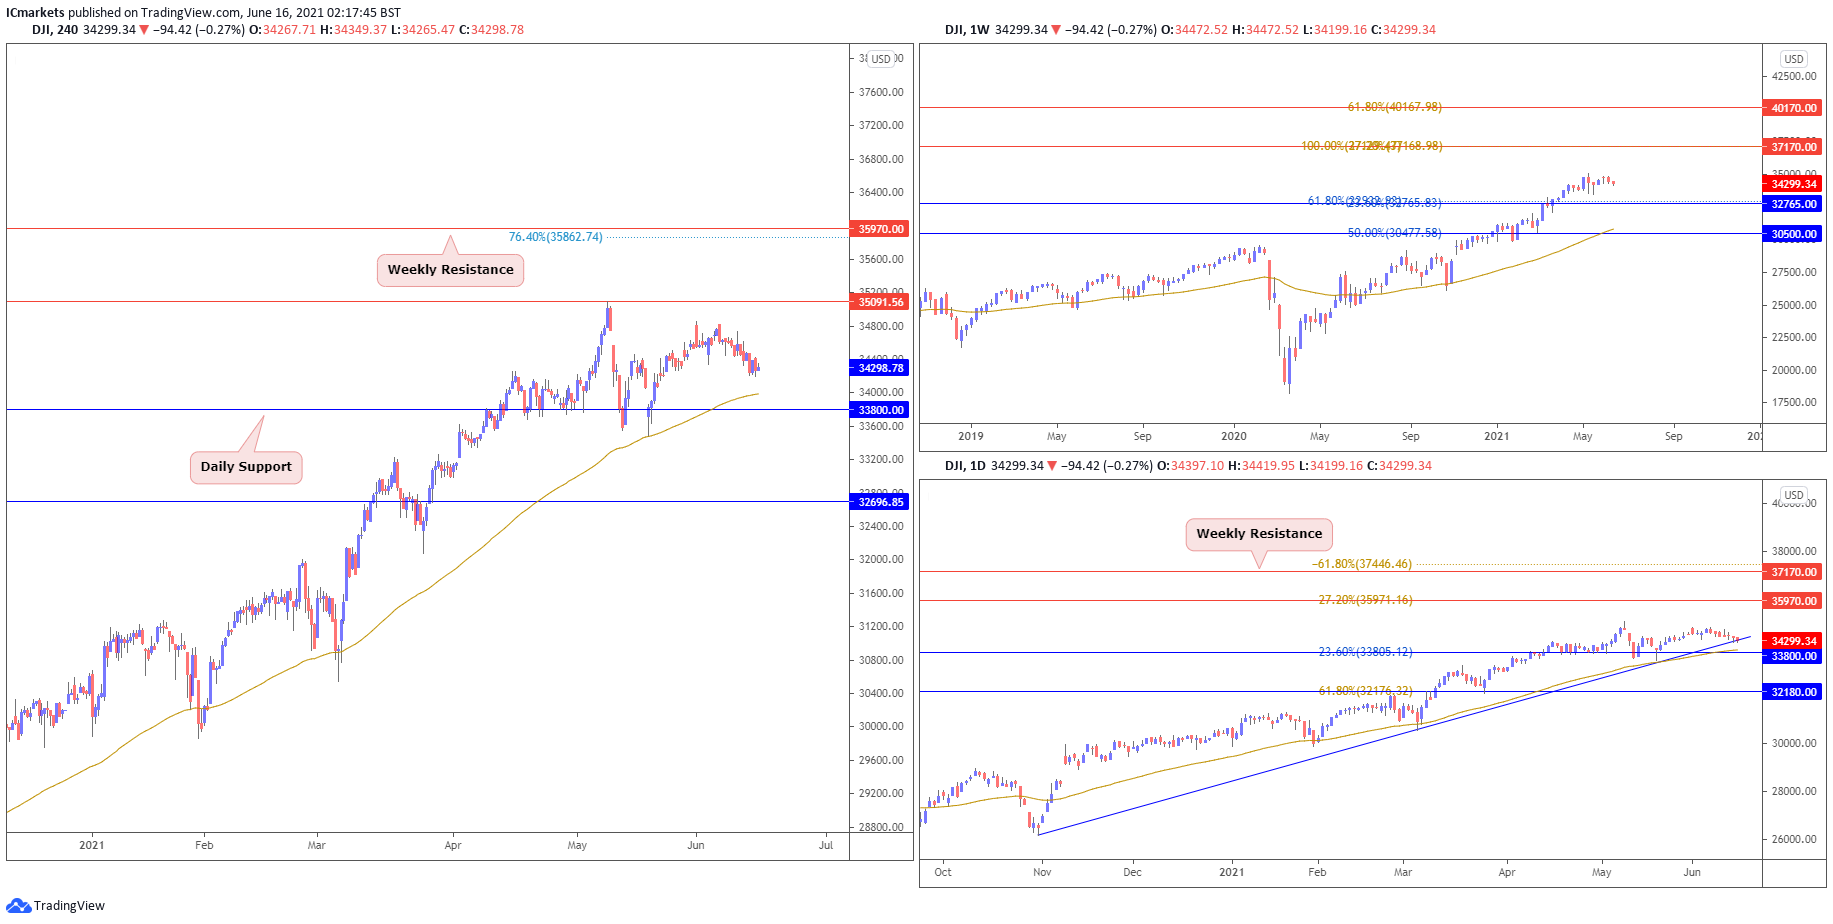
On the weekly chart, price is trading sideways. With price holding above the long term moving average, we can expect further bullish pressure above 32765 support. On the daily chart, price is still holding above the moving average and testing ascending trendline support. Buyers may look to add their longs to push price higher towards possible target at 35970 resistance.
On the H4, price drifted lower and is coming close to daily support at 33800. We could possibly see more buyers enter with their longs to play a revived bounce towards 35091 resistance. Otherwise, failure to hold above 33800 support will see price drop lower towards 32696 support next. Price is also holding above moving average
Areas of consideration:
- Watch support at 33800 on H4 closely
XAU/USD (GOLD):
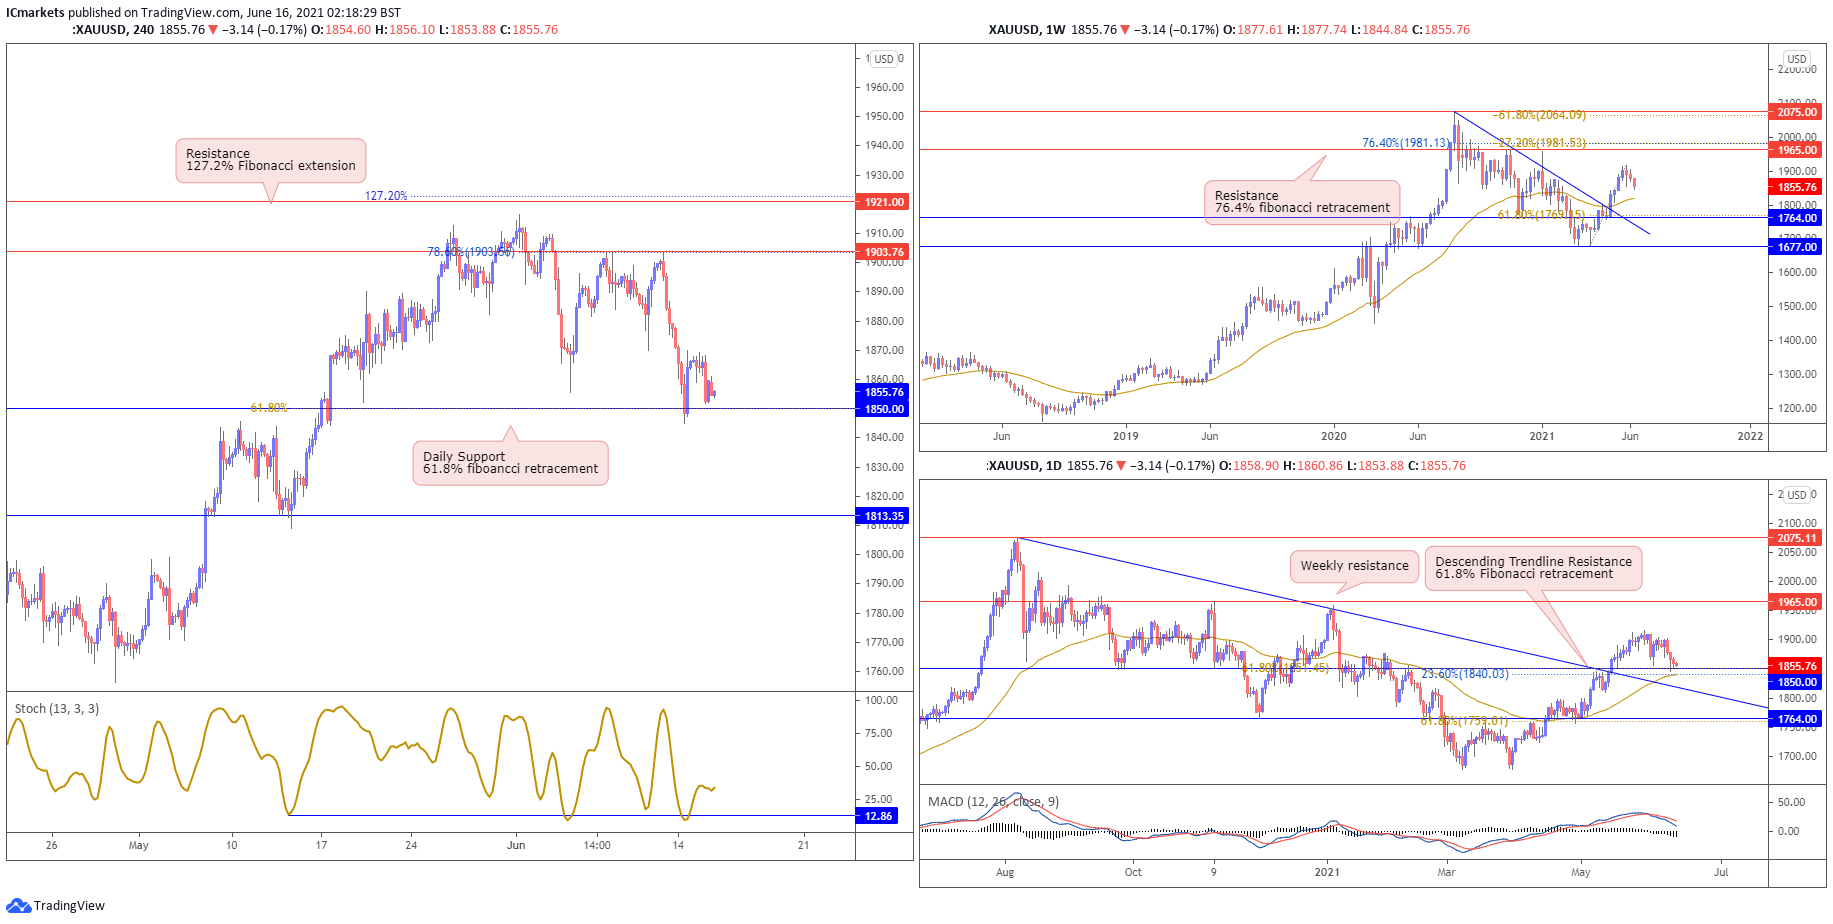
On the weekly timeframe, prices are facing bullish pressure and could still see further upside, with 1965 as the weekly resistance target. On the daily, price pulled back lower, and is testing 1850 support. With technical indicators showing room for further bullish momentum, we could see buyers looking to add to their longs above 1850 support and push price towards 1965 resistance.
On the H4, price dropped lower and is facing bullish pressure above 1850 intraday and daily support. With stochastics reacting above support where price bounced in the past as well, we see a medium probability bullish scenario where buyers may look to add to their longs with a possible upside target at 1903 resistance. Otherwise, failure to hold above 1850 support could see price drop lower towards 1813 daily support instead.
Areas of consideration:
- 1850 support to watch on H4 timeframe
The accuracy, completeness and timeliness of the information contained on this site cannot be guaranteed. IC Markets does not warranty, guarantee or make any representations, or assume any liability regarding financial results based on the use of the information in the site.
News, views, opinions, recommendations and other information obtained from sources outside of www.icmarkets.com.au, used in this site are believed to be reliable, but we cannot guarantee their accuracy or completeness. All such information is subject to change at any time without notice. IC Markets assumes no responsibility for the content of any linked site.
The fact that such links may exist does not indicate approval or endorsement of any material contained on any linked site. IC Markets is not liable for any harm caused by the transmission, through accessing the services or information on this site, of a computer virus, or other computer code or programming device that might be used to access, delete, damage, disable, disrupt or otherwise impede in any manner, the operation of the site or of any user’s software, hardware, data or property.


