
DXY:
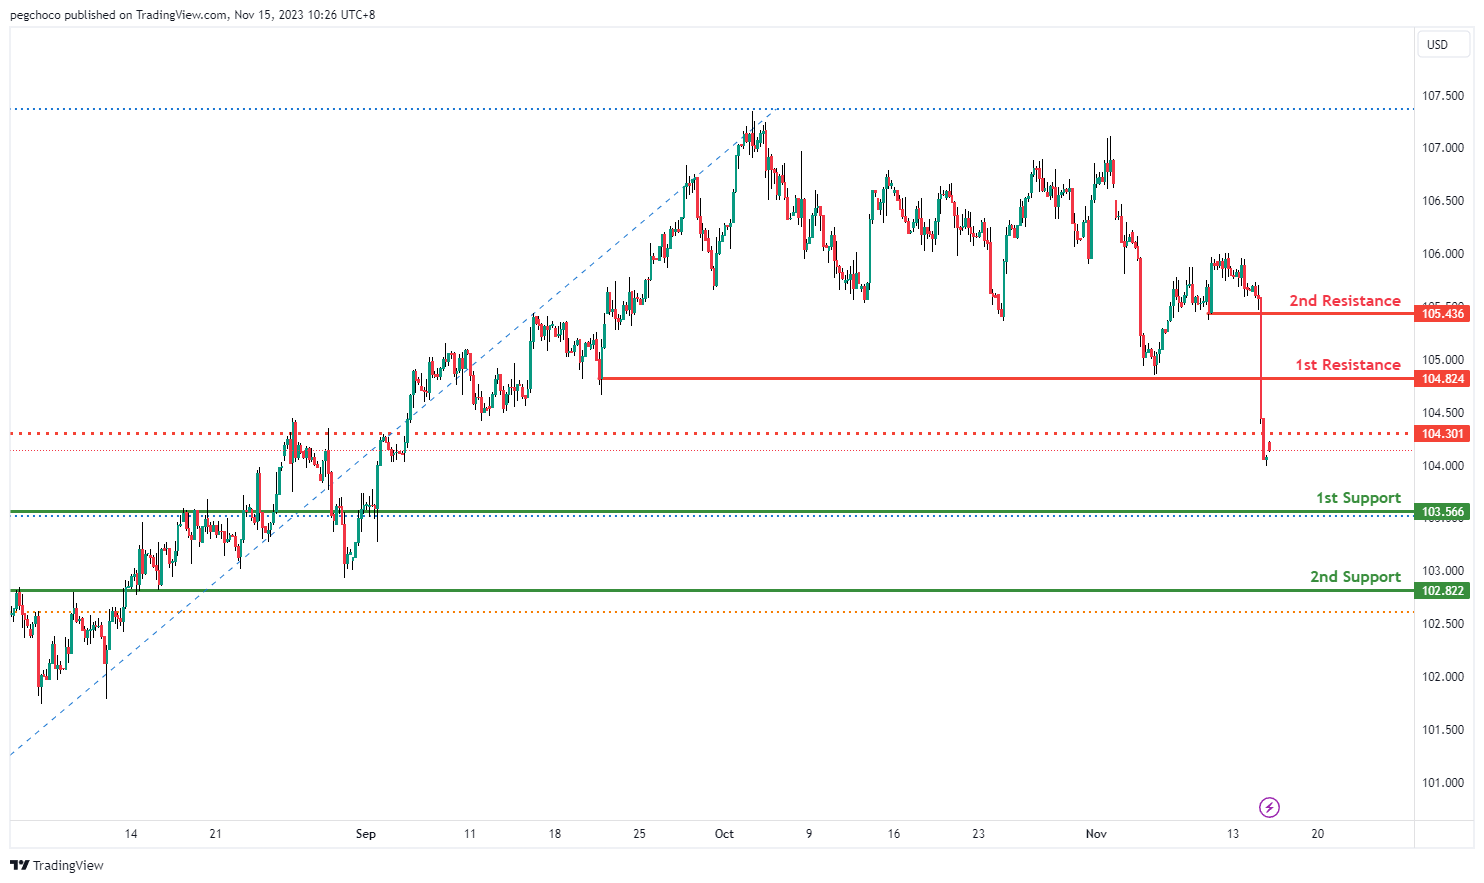
The current chart for DXY exhibits a bearish overall momentum, implying the likelihood of a bearish continuation, primarily targeting the 1st support level.
The 1st support level at 105.40 holds significance as it aligns with both an overlap support and the 50% Fibonacci Retracement level. This confluence indicates a substantial zone where we might witness a noteworthy influx of buyers or a pause in the prevailing bearish trend.
Supporting this, the 2nd support at 104.95 is identified as a multi-swing low support. This classification reinforces its credibility as a support level, signifying past instances where buying interest emerged, making it a key reference point.
On the flip side, we encounter the 1st resistance at 105.95, characterized as an overlap resistance and coinciding with the 50% Fibonacci Retracement level. This juncture suggests the potential for heightened selling interest, possibly serving as a hindrance to any substantial upward movement.
Additionally, the 2nd resistance at 106.46 is classified as a pullback resistance, signifying another noteworthy level where price action could encounter selling pressure as it continues its bearish momentum
EUR/USD:
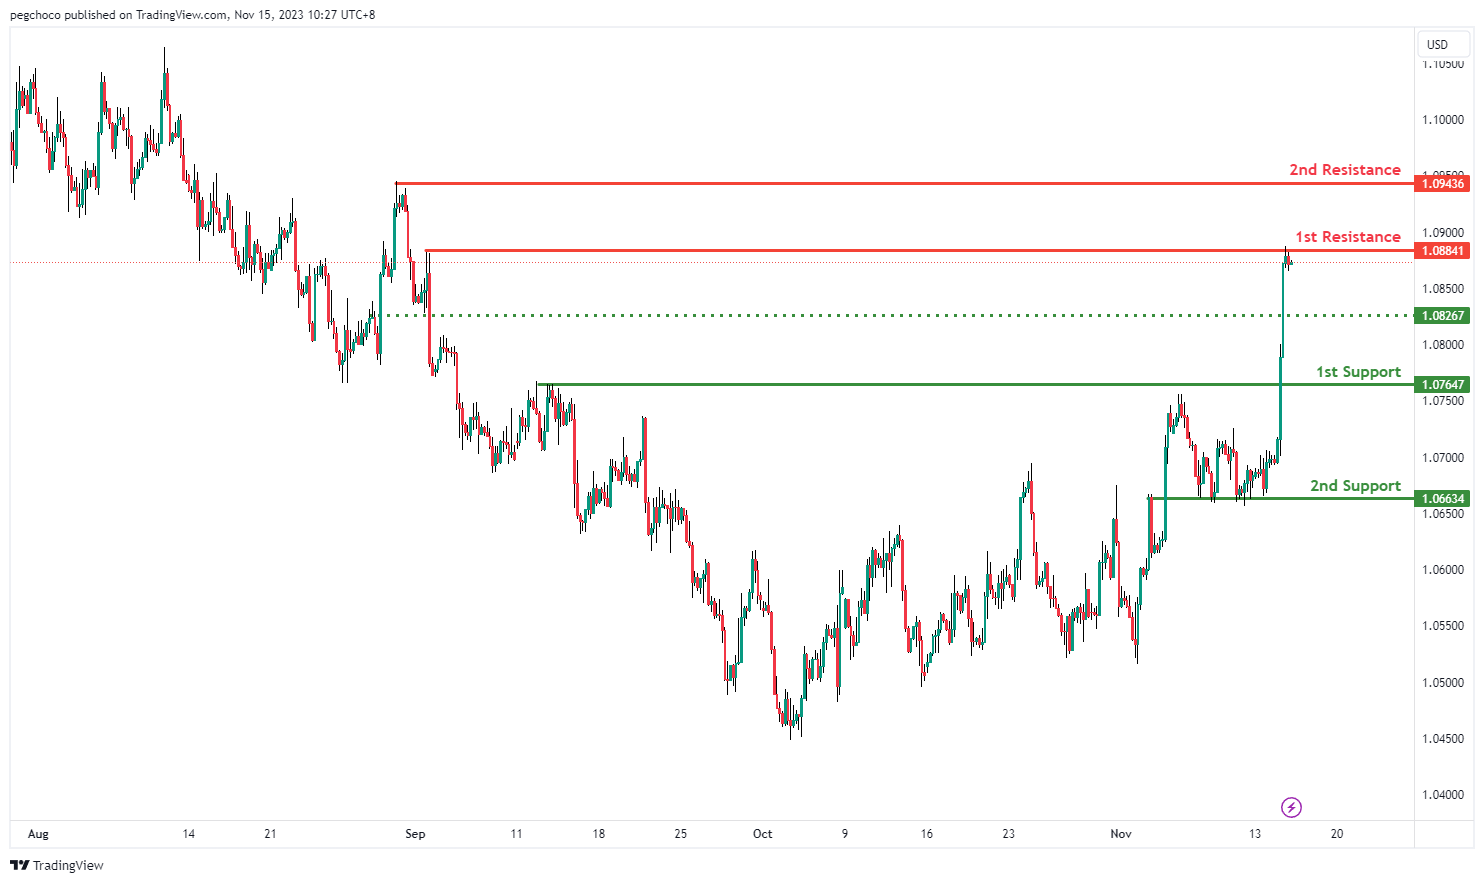
The EUR/USD chart currently exhibits a bullish overall momentum, but there is a short-term potential for a drop towards the 1st support level before a bounce that could lead to a rise towards the 1st resistance level.
The 1st support level at 1.0764 is considered a pullback support. This level is expected to provide a solid foundation for potential buyers, acting as a point of interest where the price may find support during any short-term decline.
Supporting this, the 2nd support at 1.0663 is identified as an overlap support. Overlap supports often carry significance as they indicate areas where price has previously found support, making them relevant levels to watch.
On the flip side, the 1st resistance at 1.0884 is characterized as a multi-swing high resistance. This level suggests a notable zone where selling interest may intensify, potentially serving as a barrier to further upward movement in the short term.
Additionally, the 2nd resistance at 1.0943 is categorized as a swing high resistance. This level adds another layer of resistance, indicating a point where the price could encounter increased selling pressure during its potential rise.
An intermediate support level at 1.0826 is also noted, serving as an additional pullback support. This level adds further reinforcement to the idea of a short-term drop followed by a potential bounce from the 1st support.
EUR/JPY:
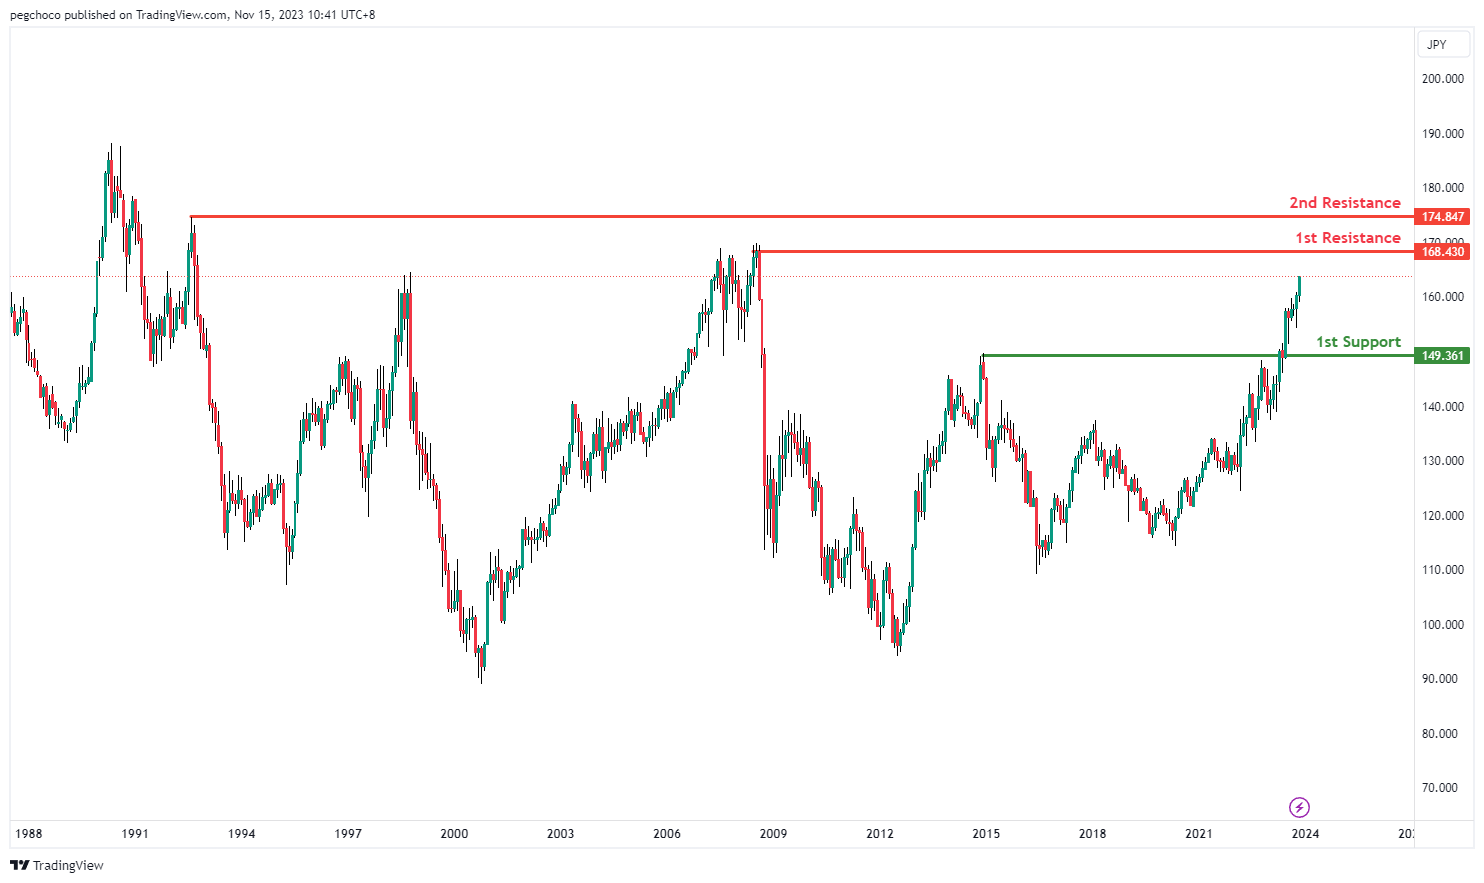
The EUR/JPY chart currently suggests a bullish momentum, suggesting a potential for price to make a bullish continuation towards the 1st resistance.
The 1st resistance level at 168.43 is identified as a swing-high resistance. Higher up, the 2nd resistance level at 174.85 is also noted as a swing-high resistance.
To the downside, the 1st support level at 149.36 is identified as a pullback support, potentially acting as a strong support area.
EUR/GBP:
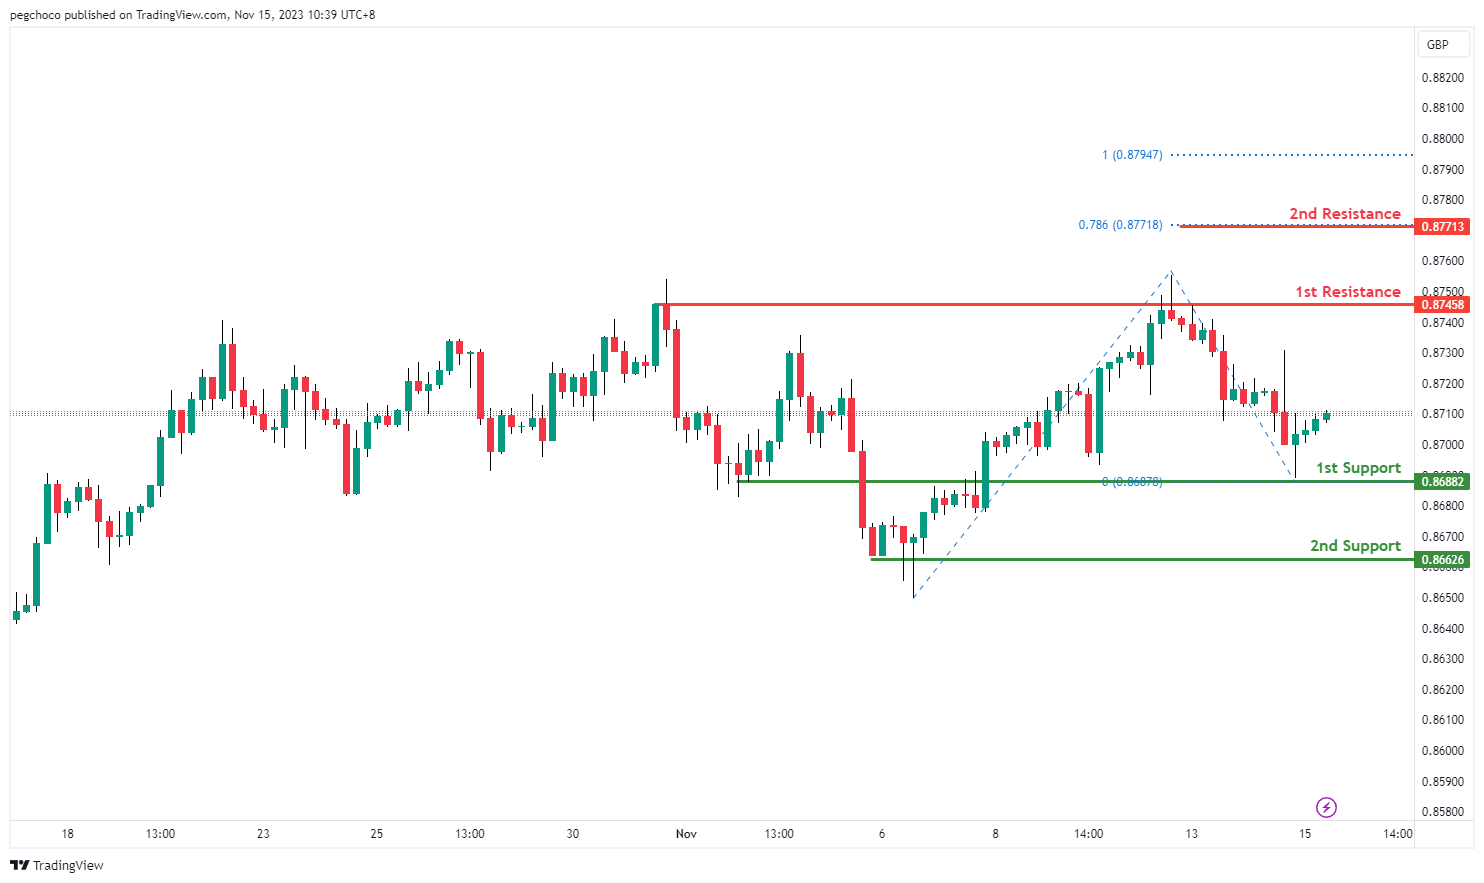
The EUR/GBP chart currently demonstrates a bullish momentum, suggesting a potential for price to make a bullish continuation towards the 1st resistance.
The 1st resistance level at 0.8746 is identified as a pullback resistance. Higher up, the 2nd resistance level at 0.8771 is noted as a resistance level that aligns witt the 78.60% Fibonacci projection level.
To the downside, the 1st support level at 0.8688 is identified as an overlap support. Additionally, the 2nd support level at 0.8663 is marked as a pullback support, reinforcing the potential strength of the support zone.
GBP/USD:
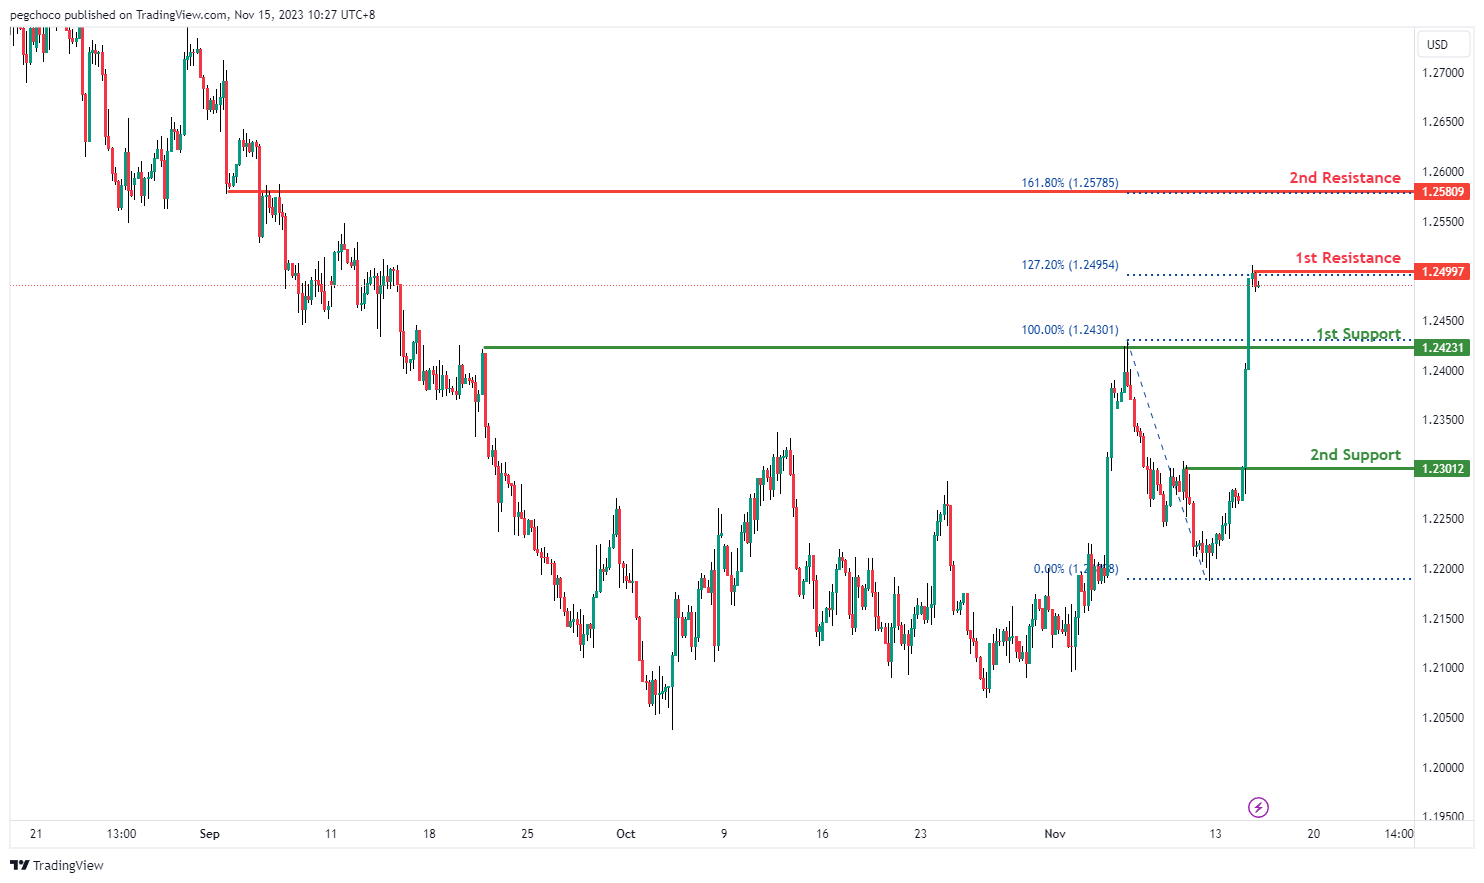
The GBP/USD chart currently displays a bullish overall momentum, but there’s a possibility of a short-term drop towards the 1st support level before a potential bounce that could lead to a rise towards the 1st resistance level.
The 1st support level at 1.2423 is identified as a pullback support. This level is expected to be a point of interest for potential buyers in the short term, possibly acting as a support zone where the price could find some stability during a downward move.
Similarly, the 2nd support at 1.2301 is also considered a pullback support. These pullback support levels indicate areas where buyers have previously stepped in, adding to their significance as relevant support levels to monitor.
On the resistance side, the 1st resistance at 1.2499 is noteworthy as it aligns with the 127.20% Fibonacci Extension level. This Fibonacci extension level suggests a potential zone where selling interest may intensify, acting as a barrier to further upward movement.
Furthermore, the 2nd resistance at 1.2580 is categorized as an overlap resistance and coincides with the 161.80% Fibonacci Extension level. This level adds another layer of resistance, indicating a point where the price could encounter increased selling pressure during its potential rise.
GBP/JPY:
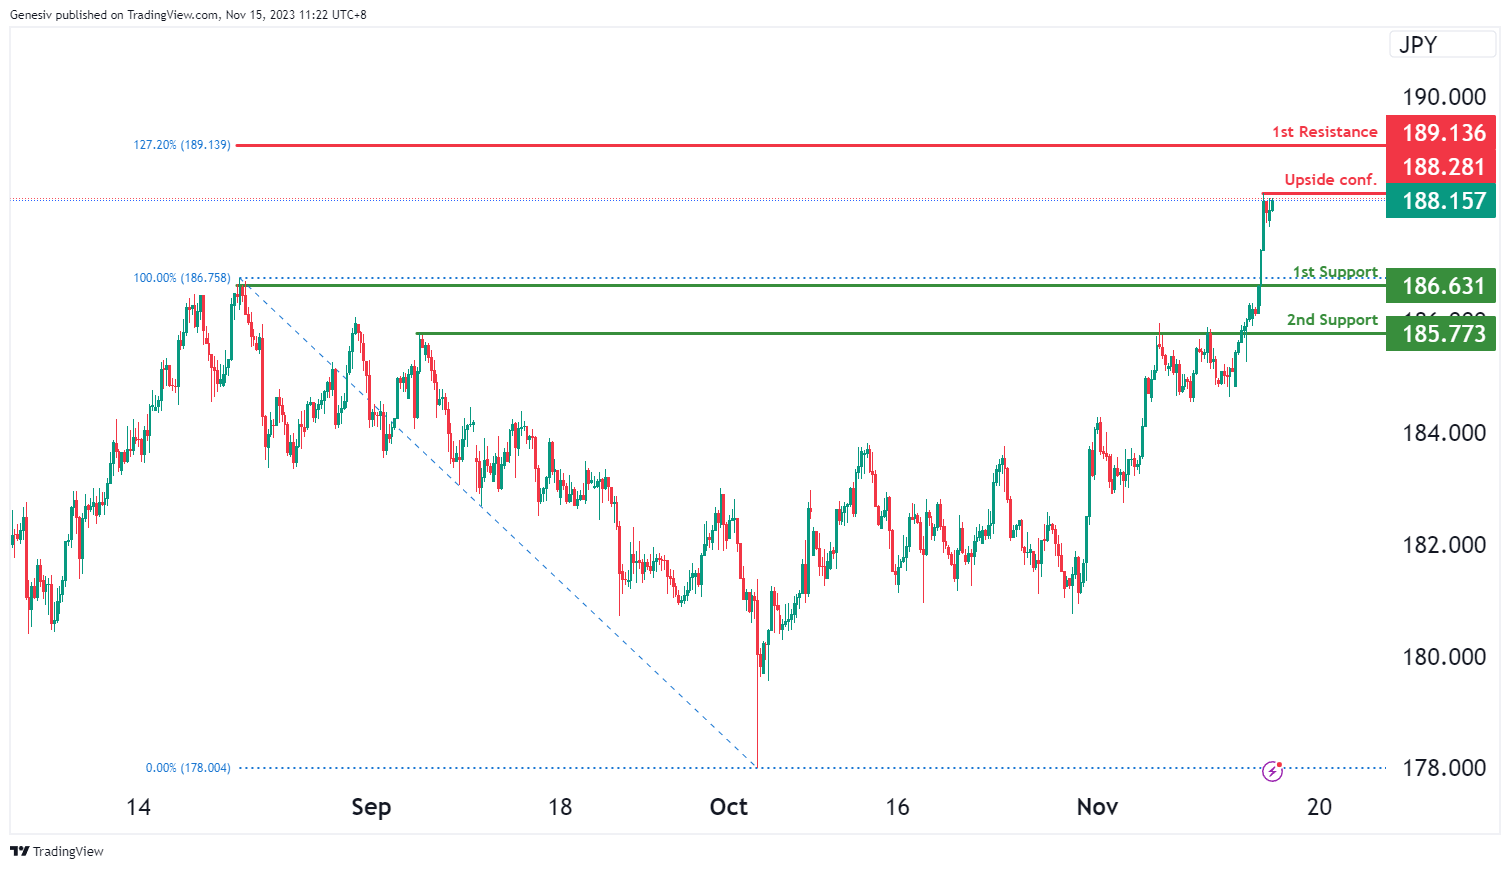
The GBP/JPY chart currently exhibits a bullish momentum, suggesting a potential bullish continuation towards the first resistance should price break above the upside confirmation.
The upside confirmation level at 188.28 is identified as a pullback support while the 1st resistance level at 189.14 is marked as a resistance level that aligns with the 127.20% Fibonacci extension level.
To the downside, the 1st support level at 186.63 is identified as a pullback support. Additionally, the 2nd support level at 185.77 is also noted as a pullback support, further reinforcing the potential strength of the support zone.
USD/CHF:
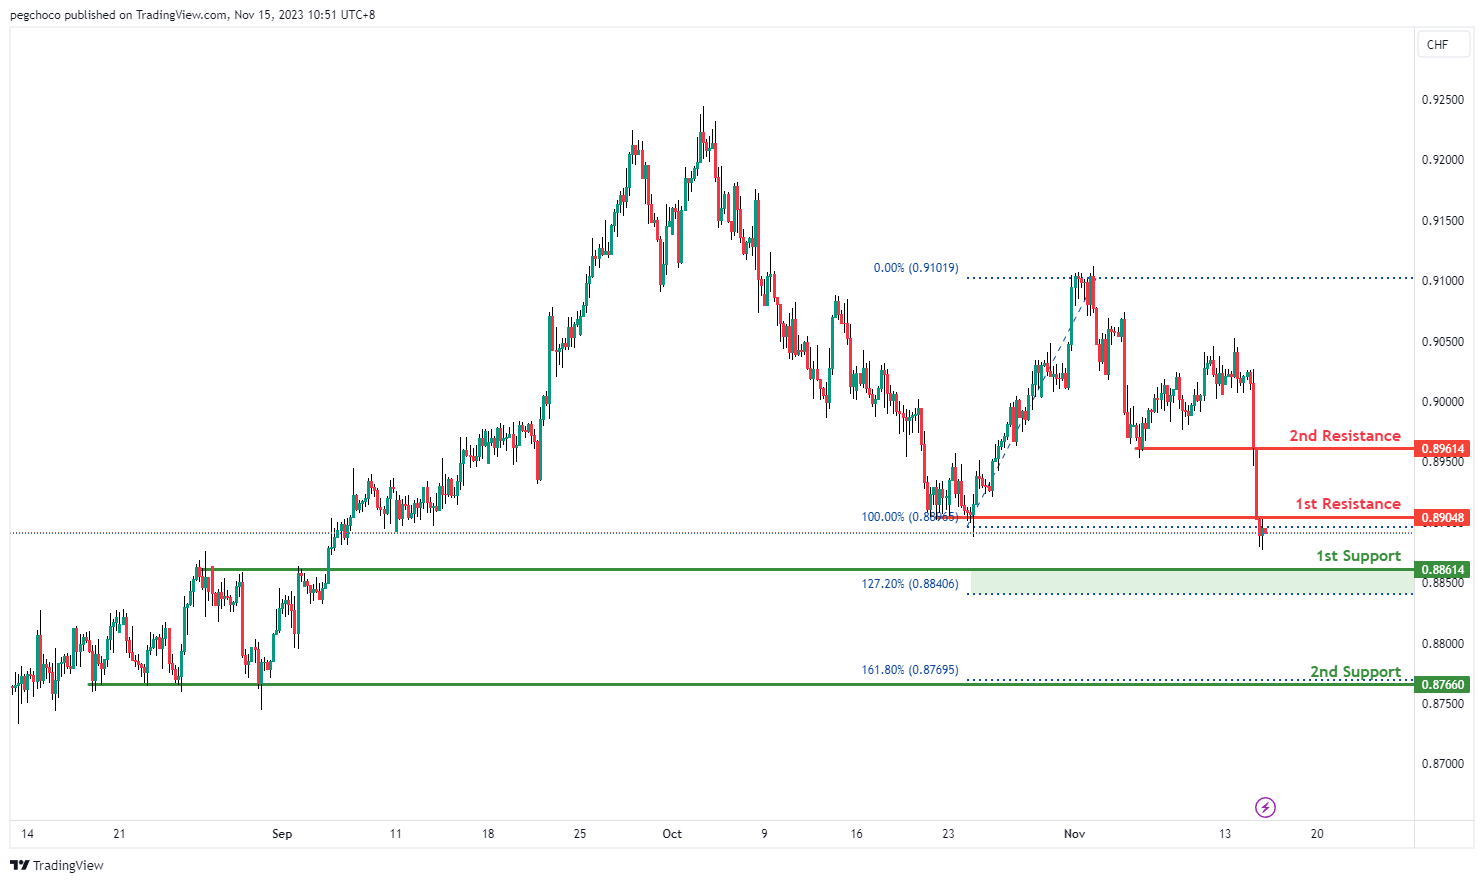
The USD/CHF chart currently exhibits a bearish overall momentum, suggesting the potential for a bearish continuation towards the 1st support level.
The 1st support level at 0.8861 is identified as a pullback support and coincides with the 127.20% Fibonacci Extension level. This confluence suggests a significant level of support where traders might expect buying interest or a pause in the bearish movement.
The 2nd support at 0.8766 is considered a multi-swing low support and coincides with the 161.80% Fibonacci Extension level. Such levels often indicate areas where buyers have previously intervened, further reinforcing their importance as potential support levels.
On the resistance side, the 1st resistance at 0.8904 is categorized as a pullback resistance. This level may act as a barrier to upward movements, where selling interest could intensify.
Similarly, the 2nd resistance at 0.8961 is also noted as a pullback resistance, adding another layer of potential resistance to the price’s upward movements.
USD/JPY:
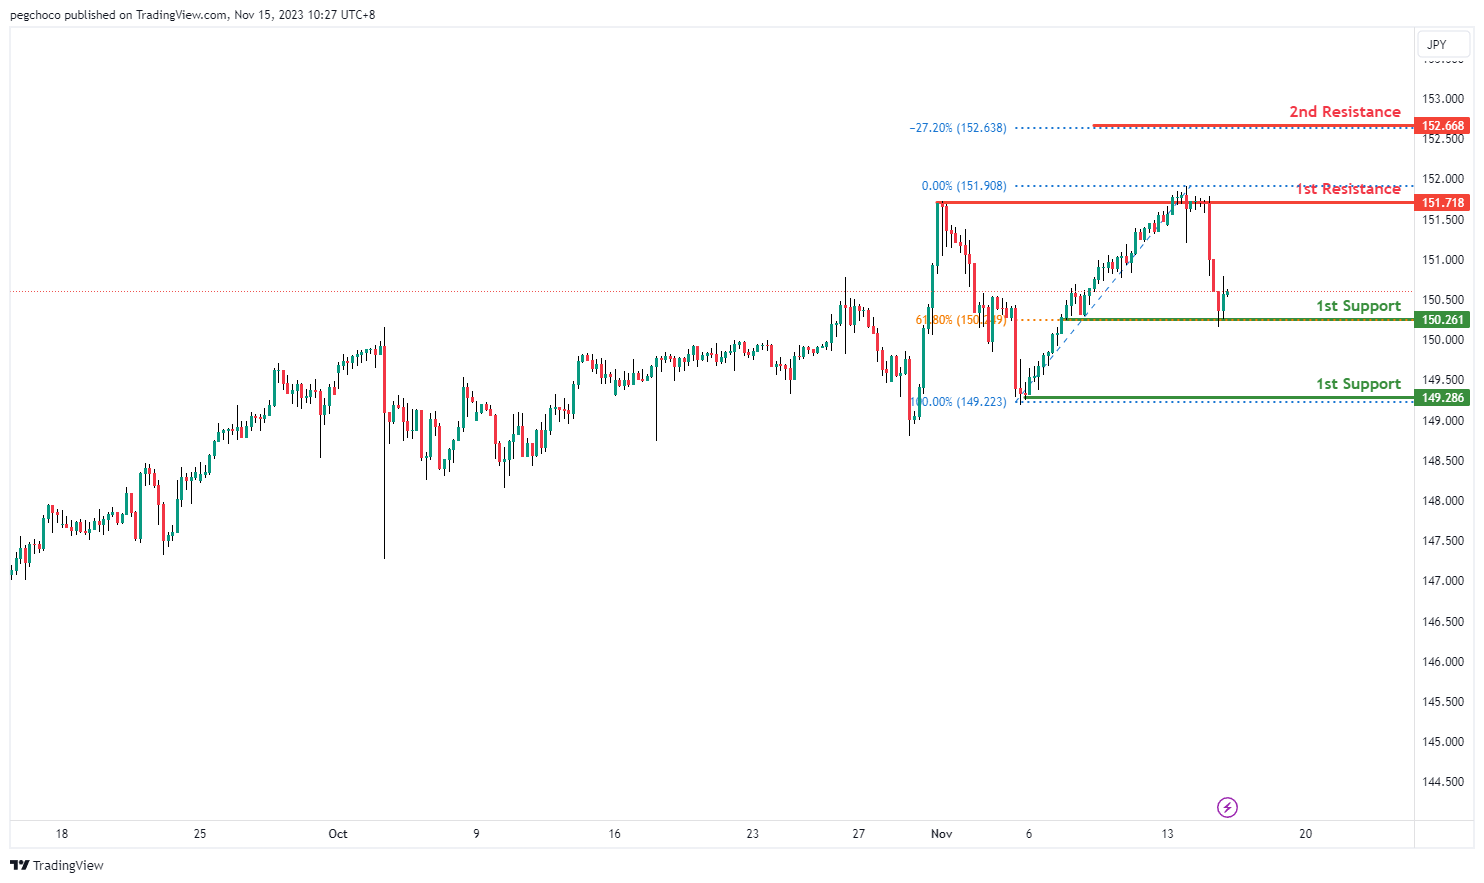
The USD/JPY chart currently has a bullish overall momentum, suggesting the potential for a bullish bounce off the 1st support level and a move towards the 1st resistance.
The 1st support level at 150.26 is identified as an overlap support and also coincides with the 61.80% Fibonacci Retracement level. This confluence indicates a significant level of support where traders may anticipate buying interest or a pause in the bullish movement.
The 2nd support at 149.28 is considered a swing low support, further reinforcing its potential as a support level. Swing lows often represent areas where buyers have previously stepped in, making it a relevant support level.
On the resistance side, the 1st resistance at 151.71 is categorized as a multi-swing high resistance, suggesting that there could be selling interest in this area. This level could act as a barrier to further upward movement.
The 2nd resistance at 152.66 is noted as a level where the price may encounter selling pressure and corresponds to the -27% Fibonacci Extension level.
USD/CAD:
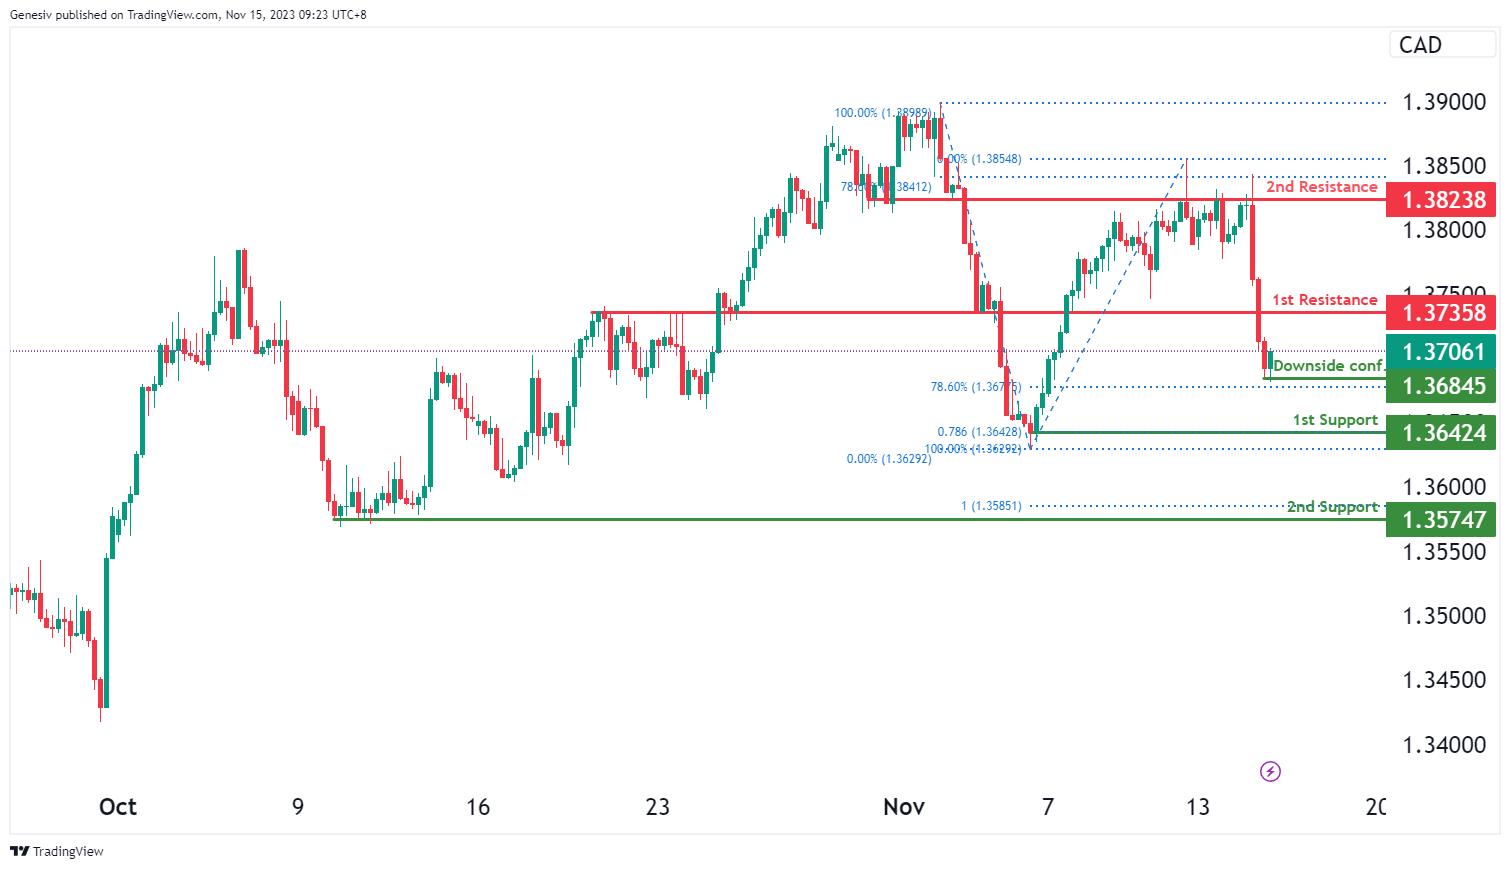
The USD/CAD chart currently shows an overall bearish momentum, indicating the potential for further downside movement should price break under the downside confirmation.
The downside confirmation level at 1.3685 is identified as a pullback support that aligns close to the 78.60% Fibonacci retracement level while the 1st support level at 1.3642 is marked as a swing-low support that aligns close to the 78.60% Fibonacci projection level. Further below, the 2nd support level at 1.3575 is noted as a pullabck support that aligns close to the 100.00% Fibonacci projection level.
To the upside, the 1st resistance level at 1.3736 is identified as an overlap resistance. Higher up, the 2nd resistance level at 1.3824 is also marked as an overlap resistance that aligns close to the 78.60% Fibonacci retracement level.
AUD/USD:
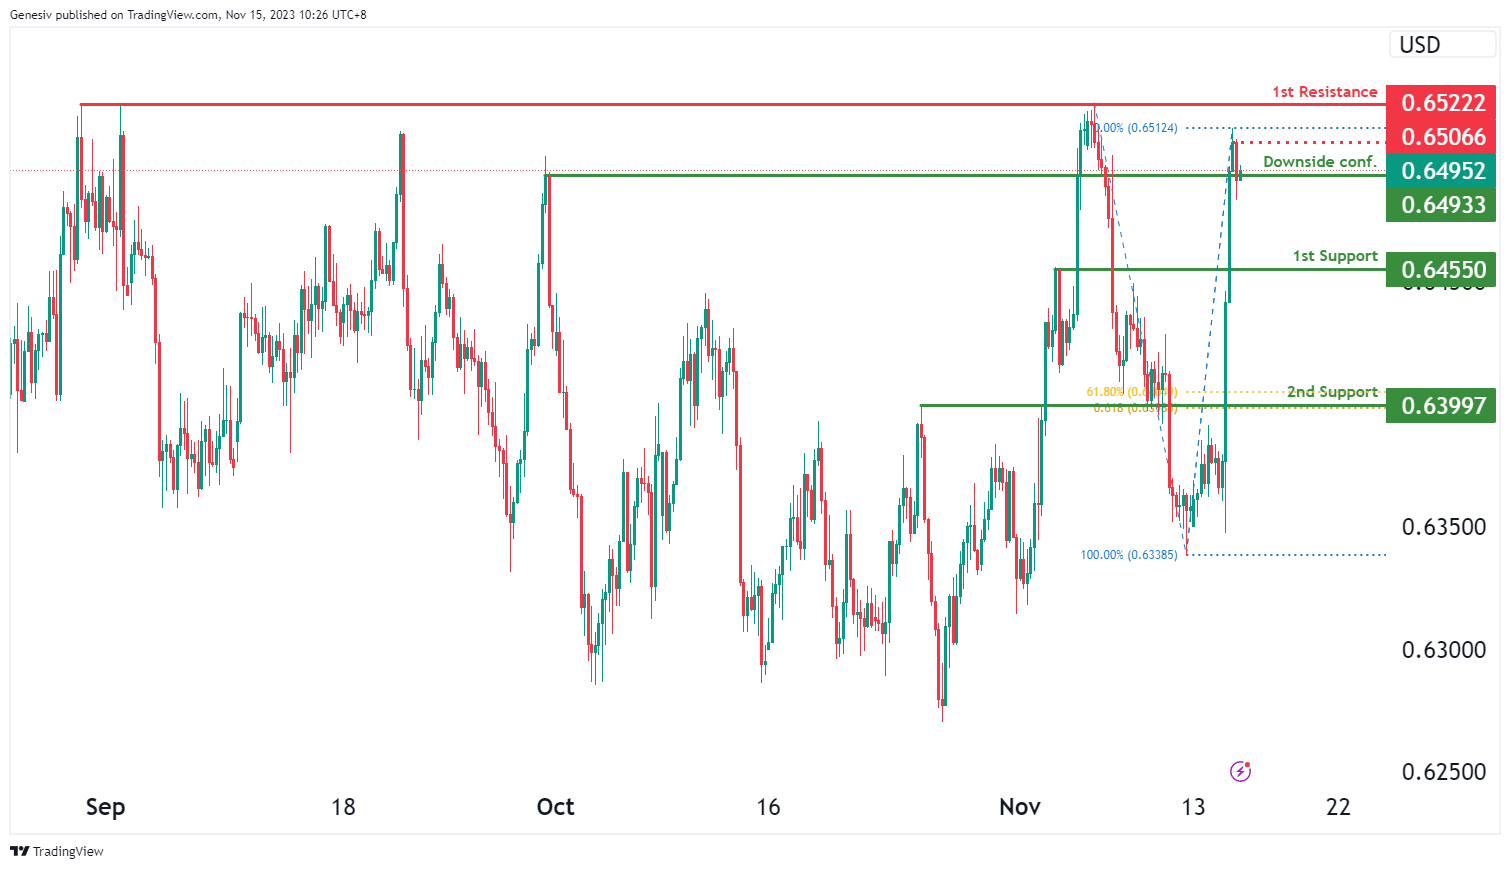
The AUD/USD chart currently exhibits an overall bullish momentum, suggesting the potential for a bullish continuation towards the 1st resistance.
The intermediate resistance level at 0.6507 is identified as a pullback resistance. Higher up, the 1st resistance level at 0.6522 is marked as a multi-swing-high resistance, suggesting that it could serve as a strong resistance level.
On the support side, the downside confirmation level at 0.6493 is identified as a pullback support. Should price break below this level, it could trigger a bearish move towards the 1st support level. The 1st support level at 0.6455 is noted as a pullback support. Further below, the 2nd support level at 0.6399 is also marked as a pullback support that aligns with a confluence of Fibonacci levels i.e. the 61.80% retracement and the 61.80% projection levels, suggesting a significant support level.
NZD/USD
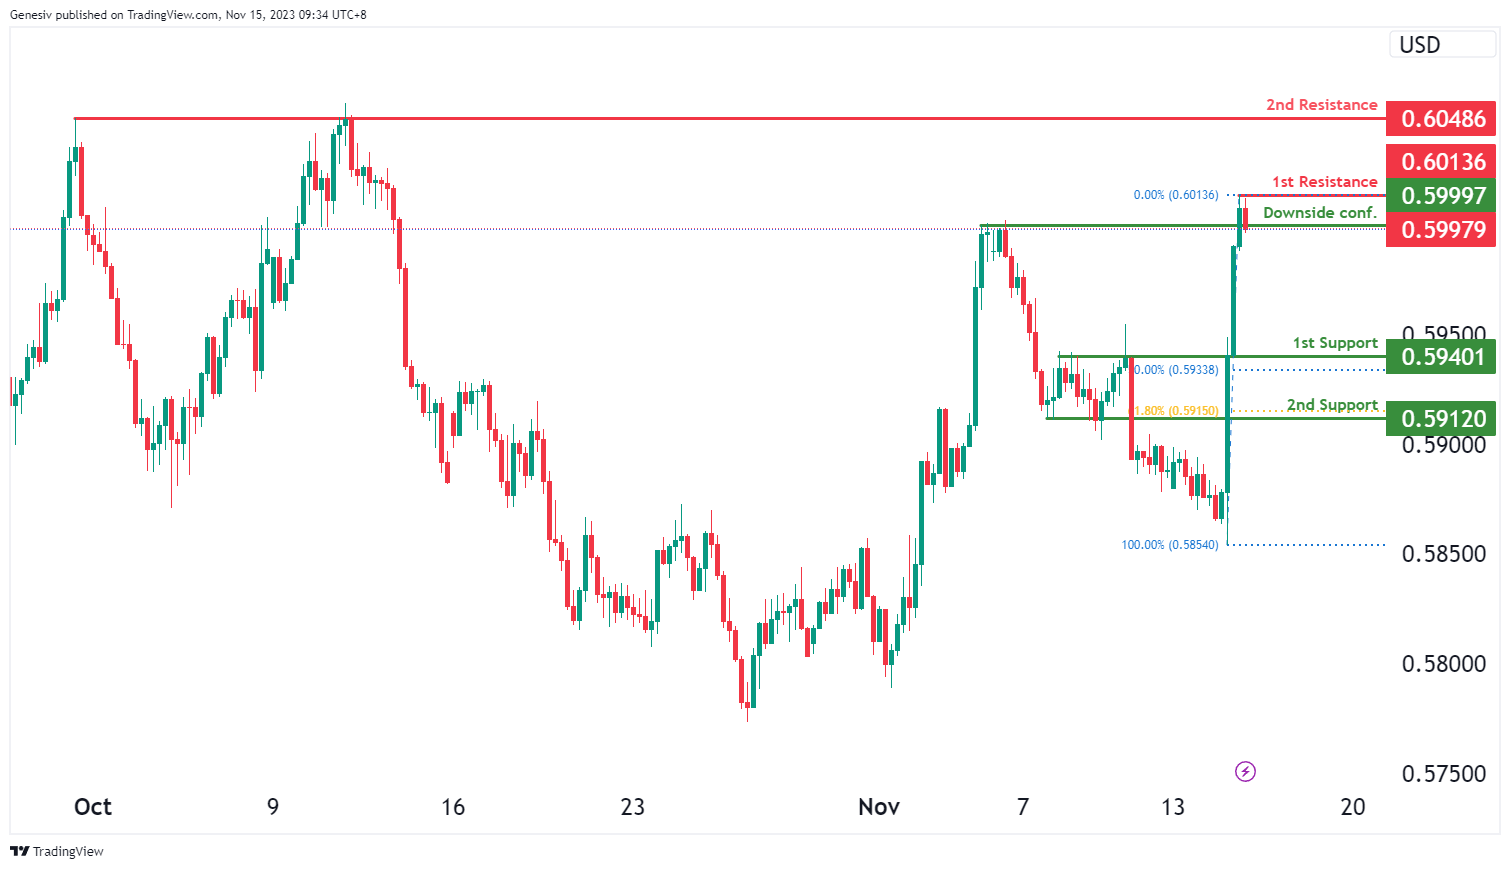
The NZD/USD chart currently exhibits an overall bullish momentum, suggesting the potential for further upward movement.
The 1st resistance level at 0.6014 is identified as a pullback resistance while the 2nd resistance level at 0.6049 is marked as a multi-swing-high resistance, indicating its potential strength as a barrier to further bullish movement.
To the downside, the 1st support level at 0.5940 is identified as a pullback support that aligns close to the 50.00% Fibonacci retracement level. Further below, the 2nd support level at 0.5912 is also noted as a pullback support that aligns with the 61.80% Fibonacci retracement level, signifying its significance as a strong support area.
DJ30:
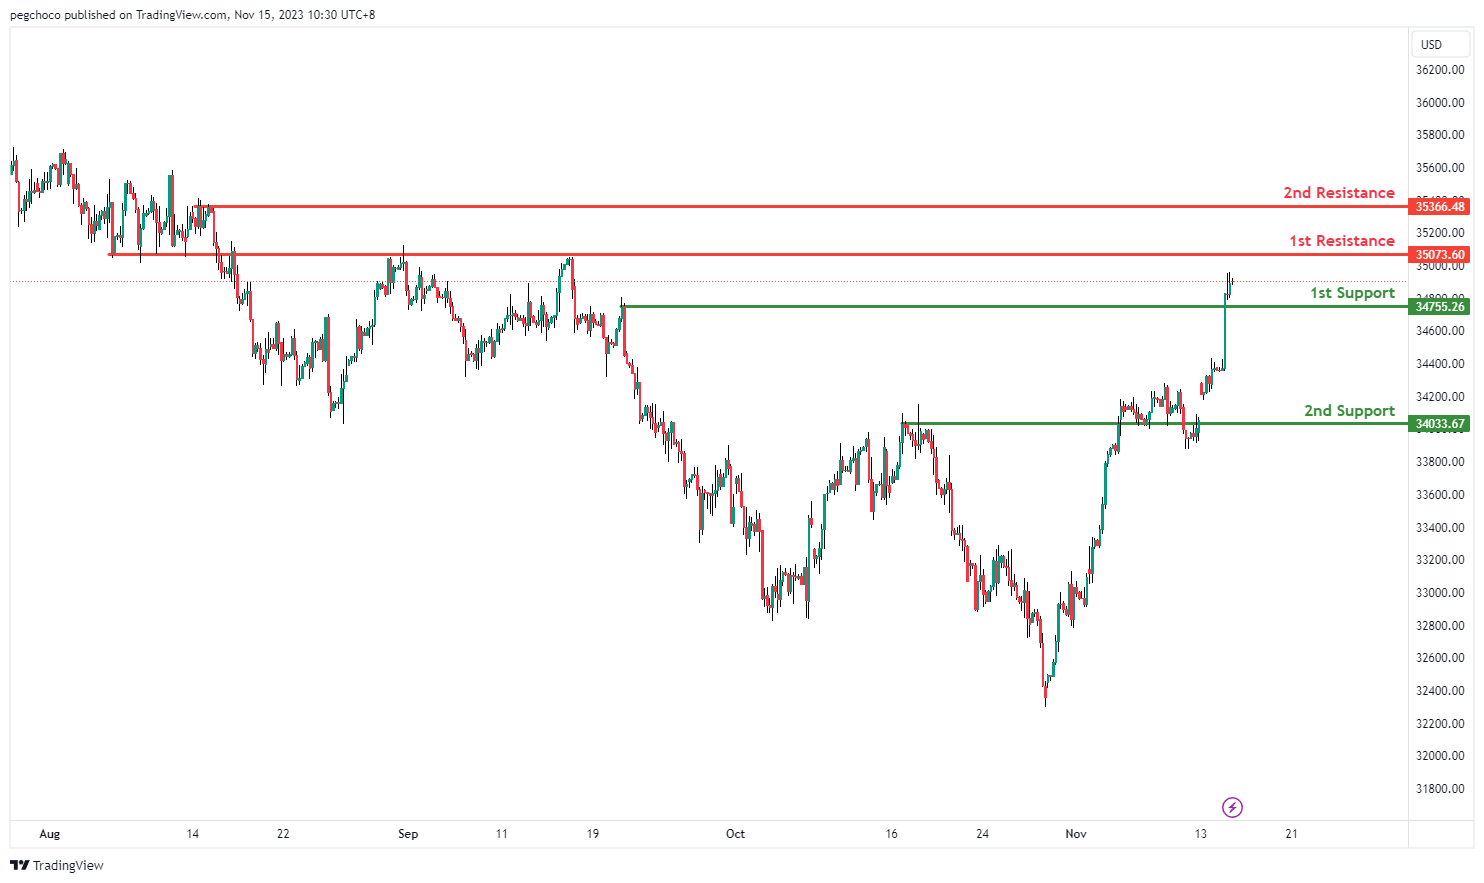
The DJ30 chart is currently showing an overall bullish momentum, suggesting a potential for price to make a bullish continuation towards the 1st resistance.
The 1st resistance level at 35073.60 is marked as an overlap resistance. Higher up, the 2nd resistance level at 35366.48 is noted as a pullback resistance, indicating a potential resistance area for further upward movement.
On the support side, the 1st support level at 34755.26 is identified as a pullback support. Further below, the 2nd support level at 34033.67 is noted as an overlap support, marking another potential level for a strong support area.
GER40:
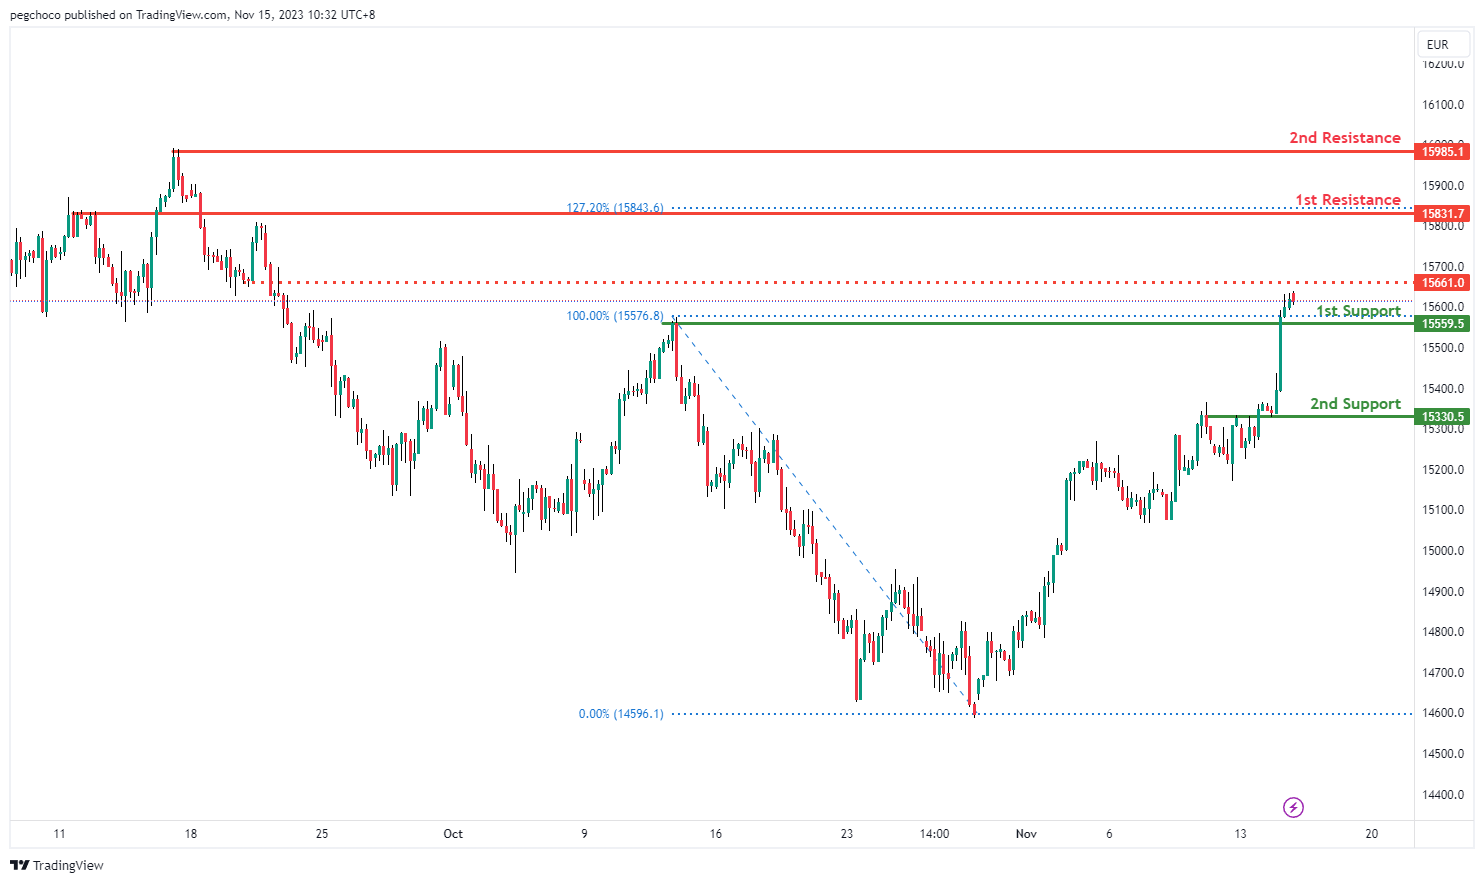
The GER40 chart is currently displaying an overall bullish momentum, suggesting a potential for price to make a bullish continuation towards the 1st resistance should it break above the intermediate resistance.
The intermediate resistance level at 15661.00 is identified as a pullback resistance while the 1st resistance level at 15831.70 is marked as an overlap resistance that aligns with the 127.20% Fibonacci extension level. Higher up, the 2nd resistance level at 15985.10 is noted as a swing-high resistance, indicating a potential resistance area for further upward movement.
On the support side, the 1st support level at 15559.50 is identified as a pullback support. Further below, the 2nd support level at 15330.50 is noted as an overlap support, marking another potential level for a strong support area.
`US500
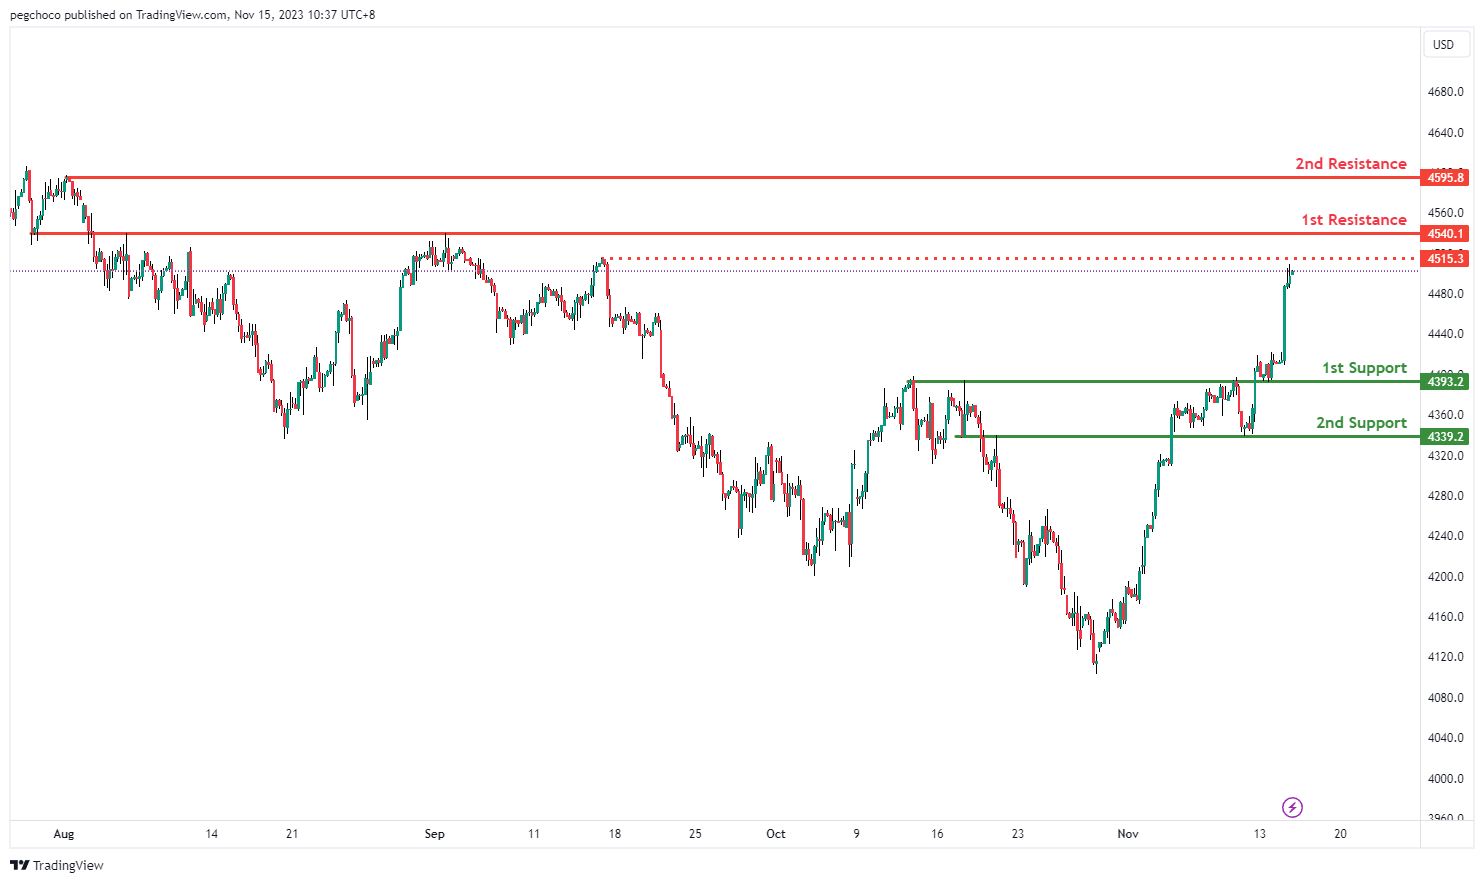
The US500 chart is currently indicating an overall bullish momentum, suggesting a potential for price to make a bullish continuation towards the 1st resistance should it break above the intermediate resistance.
The intermediate resistance level at 4515.30 is identified as a pullback resistance while the 1st resistance level at 4540.10 is marked as an overlap resistance. Higher up, the 2nd resistance level at 4595.80 is noted as a pullback resistance, indicating a potential resistance area for further upward movement.
On the support side, the 1st support level at 4393.20 is identified as an overlap support. Further below, the 2nd support level at 4339.20 is also noted as an overlap support, marking another potential level for a strong support area.
BTC/USD:
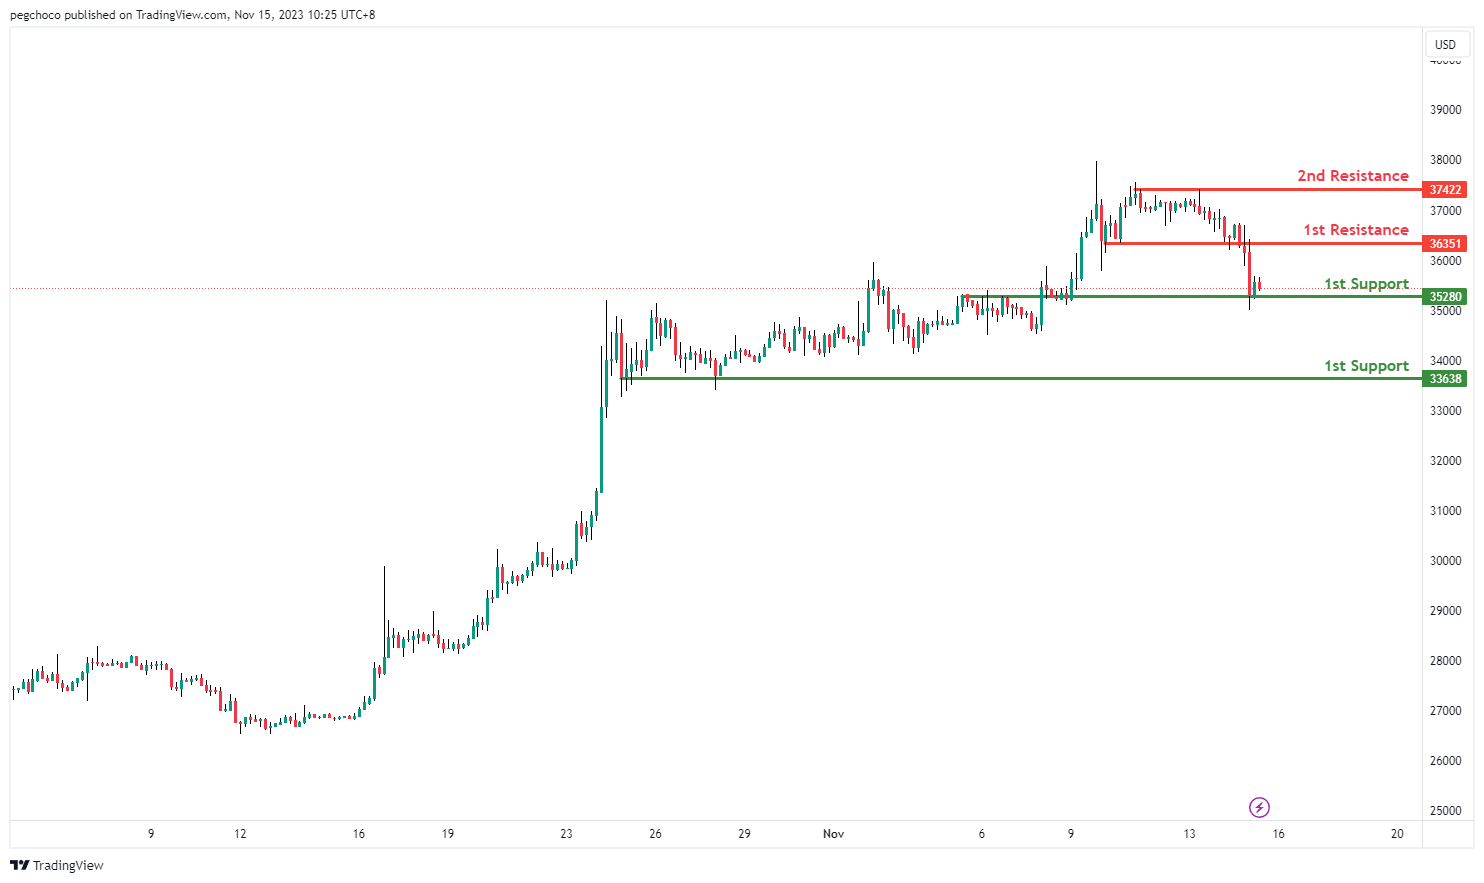
The BTC/USD chart is currently exhibiting a an overall bearish momentum with a potential for price to make a bearish continuation towards the 1st support.
The 1st support level at 35280 is identified as an overlap support. Further below, the 2nd support level at 33638 is marked as a pullback support, potentially acting as a strong support area.
To the upside, the 1st resistance level at 36351 is idenitfed as a pullback resistance while the 2nd resistance level at 37422 is also noted as another pullback resistance, indicating a significant level where price might encounter hurdles to its upward movement.
ETH/USD:
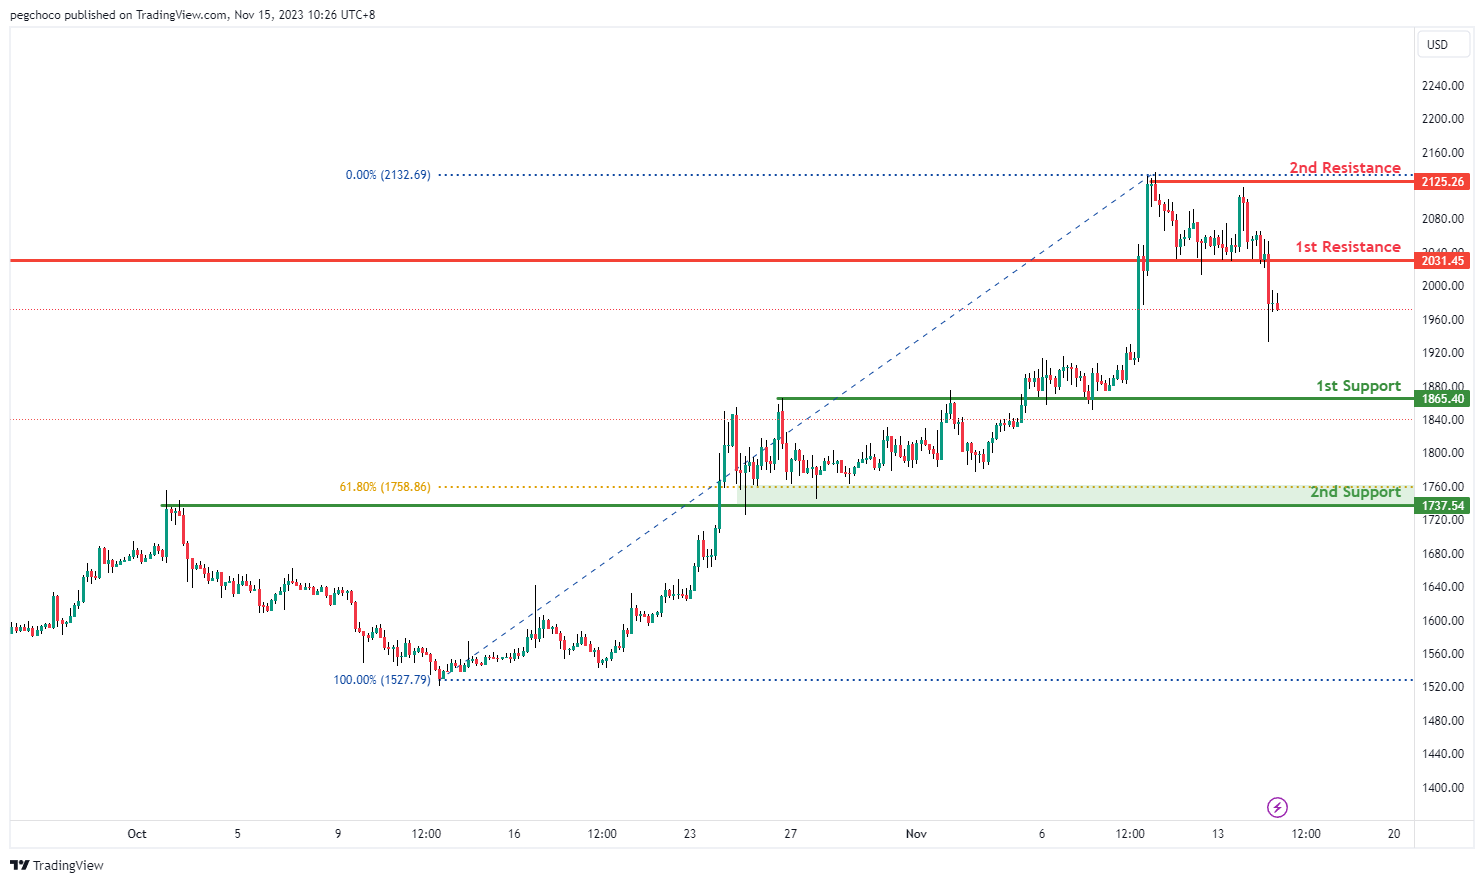
The ETH/USD chart currently displays an overall bearish momentumwith a potential for price to make a bearish continuation towards the 1st support.
The 1st support level at 1865.40 is identified as an overlap support. Further below, the 2nd support level at 1737.54 is also marked as an overlap support that aligns with the 61.80% Fibonacci retracement level.
To the upside, the 1st resistance level at 2031.45 is idenitfed as an overlap resistance while the 2nd resistance level at 2125.26 is noted as a pullback resistance, indicating a significant level where price might encounter hurdles to its upward movement.
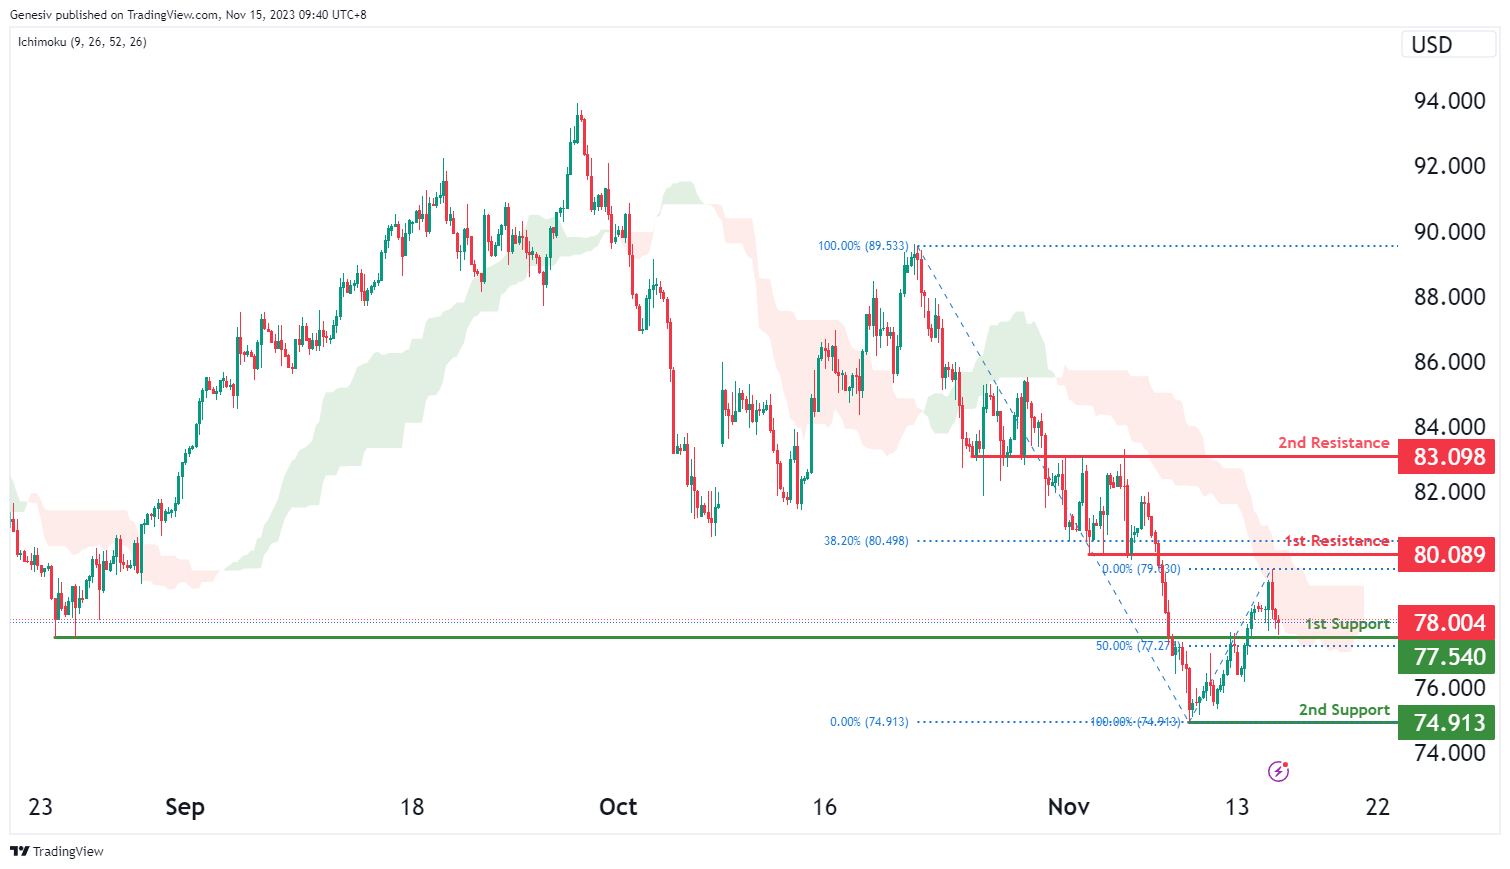
WTI/USD:
The WTI (West Texas Intermediate) chart currently shows a weak bullish momentum, suggesting the potential for further upward movement towards the 1st resistance. However, price is also trading within the bearish Ichimoku cloud and any price gains could potentially be restricted by the cloud.
The 1st resistance level at 80.09 is identified as a pullback resistance that aligns close to the 38.20% Fibonacci retracement level. Higher up, the 2nd resistance level at 83.09 is marked as an overlap resistance, suggesting potential strength as a barrier to further bullish movement.
To the downside, the 1st support level at 77.54 is identified as an overlap support that aligns with the 50.00% Fibonacci retracement level. Further below, the 2nd support level at 74.91 is noted as a swing-low support, signifying its potential as a strong support area.
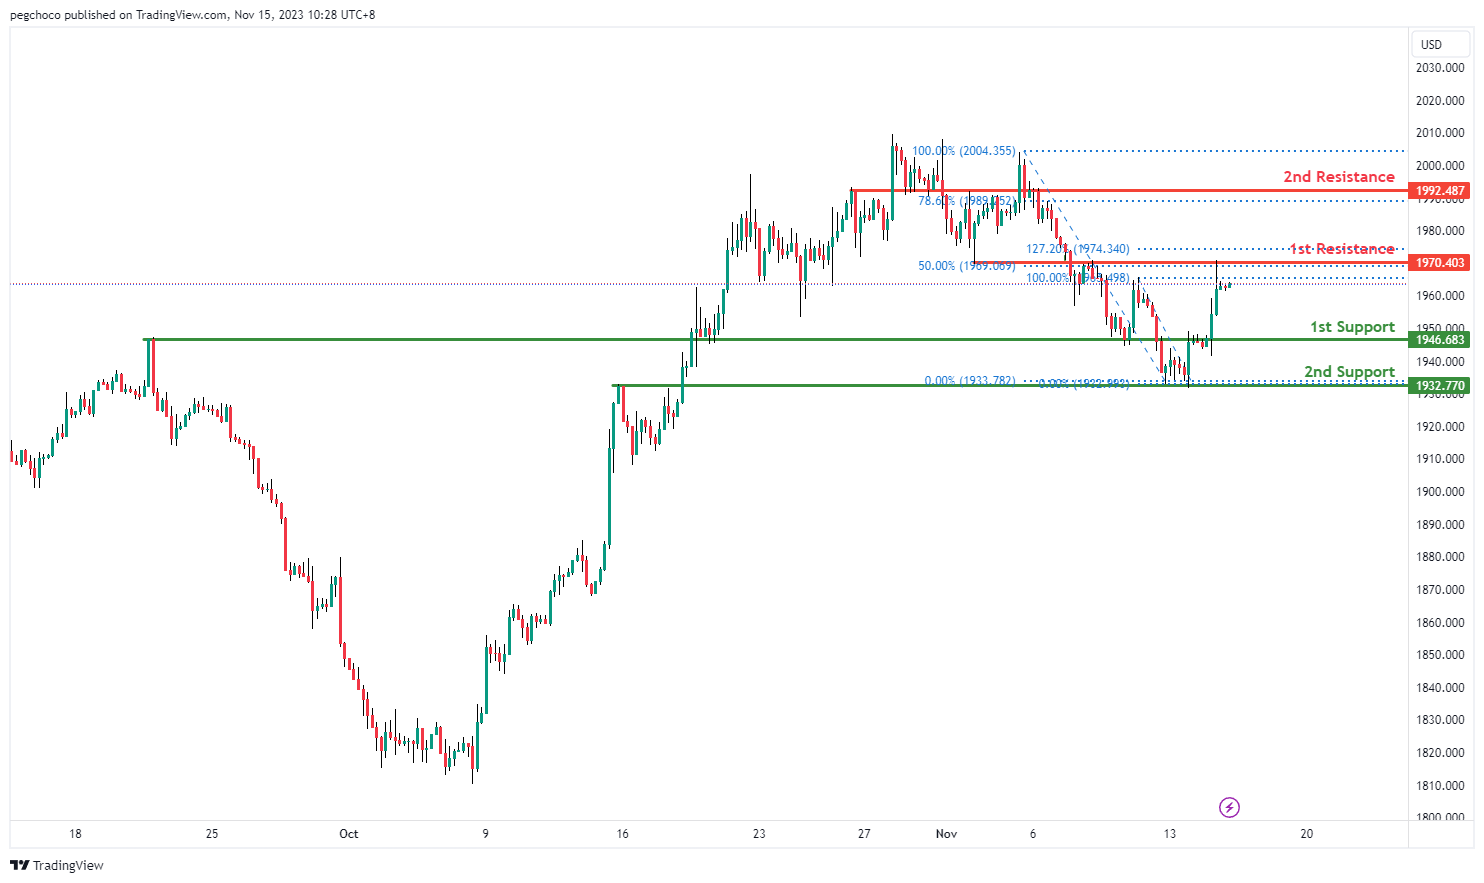
XAU/USD (GOLD):
The XAU/USD chart currently exhibits a bullish overall momentum, suggesting the potential for a bullish continuation towards the 1st resistance.
The 1st support level at 1946.68 is identified as a pullback support, indicating it could act as a significant level of support. Pullback supports often attract buying interest or lead to a pause in the bullish movement.
The 2nd support at 1932.77 is categorized as an overlap support, further reinforcing its potential as a support level. Overlap supports indicate areas where historical price action has found support.
On the resistance side, the 1st resistance at 1970.40 is noted as an overlap resistance and coincides with the 50% Fibonacci Retracement level. This confluence suggests that there could be selling interest in this area, potentially acting as a barrier to further upward movement.
The 2nd resistance at 1992.48 is identified as an overlap resistance, further strengthening the potential resistance level.
The accuracy, completeness and timeliness of the information contained on this site cannot be guaranteed. IC Markets does not warranty, guarantee or make any representations, or assume any liability regarding financial results based on the use of the information in the site.
News, views, opinions, recommendations and other information obtained from sources outside of www.icmarkets.com, used in this site are believed to be reliable, but we cannot guarantee their accuracy or completeness. All such information is subject to change at any time without notice. IC Markets assumes no responsibility for the content of any linked site.
The fact that such links may exist does not indicate approval or endorsement of any material contained on any linked site. IC Markets is not liable for any harm caused by the transmission, through accessing the services or information on this site, of a computer virus, or other computer code or programming device that might be used to access, delete, damage, disable, disrupt or otherwise impede in any manner, the operation of the site or of any user’s software, hardware, data or property.


