
EUR/USD:
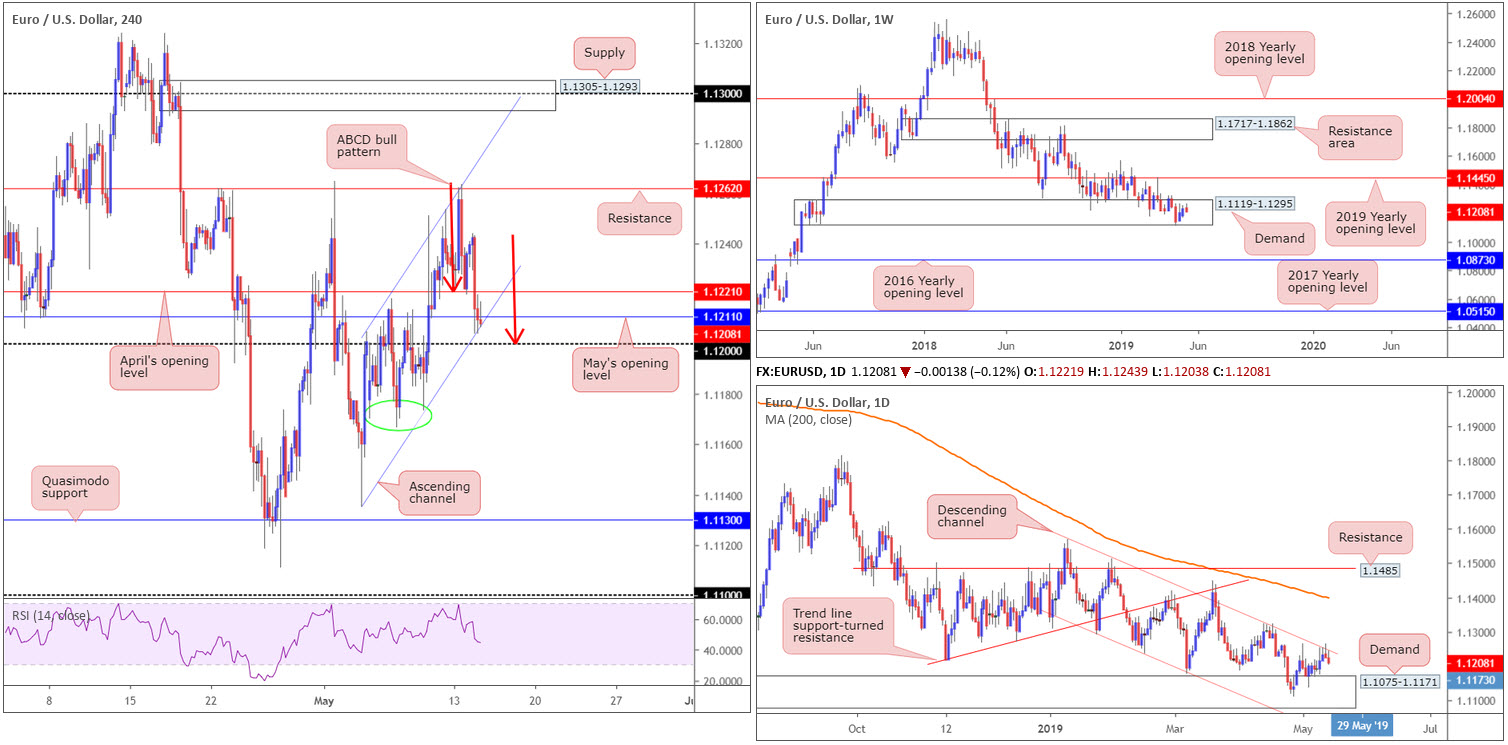
The euro ceded ground against its US counterpart Tuesday, extending Monday’s losses. A rising dollar, coupled with the release of the ZEW survey showing weaker-than-forecasted numbers for Germany, collectively weighed on the single currency, with the EUR/USD settling for the day a few points north of the 1.12 handle on the H4 timeframe.
The other key thing to note around 1.12, technically speaking, is a closely merging channel support extended from the low 1.1135, and an ABCD bullish approach (red arrows) at 1.12. April and May’s opening levels at 1.1221 and 1.1211 are also close by, though could, given current price, now potentially serve as resistance.
Focus on the weekly timeframe remains within the walls of a long-standing demand zone at 1.1119-1.1295, perhaps absorbing sellers from the daily channel resistance stretched from the high 1.1569. Interestingly, the next downside target on the daily timeframe falls in at demand drawn from 1.1075-1.1171, glued to the underside of the current weekly demand base.
Areas of consideration:
The research team sees the 1.12 handle as a support of note, given it merging with a H4 ABCD bullish formation and a nearby H4 channel support. While the trade is set within weekly demand mentioned above at 1.1119-1.1295, buyers have to contend with daily players pushing lower from channel resistance (1.1569), as well as the fact both May and April’s opening levels on the H4 may breed resistance. For that reason, entering off 1.12 without additional confirmation is a chancy move, according to our technical studies.
In the event we push for lower ground and overthrow 1.12 today, we have 1.1170ish H4 support (green circle) in sight, followed then by a reasonably free run towards H4 Quasimodo support at 1.1130. Shorts, therefore, could be an option if we test waters beyond 1.12.
Today’s data points: German Prelim GDP q/q; EUR Flash GDP q/q; US Core Retail Sales m/m; US Retail Sales m/m; FOMC Member Quarles Speaks.
GBP/USD:
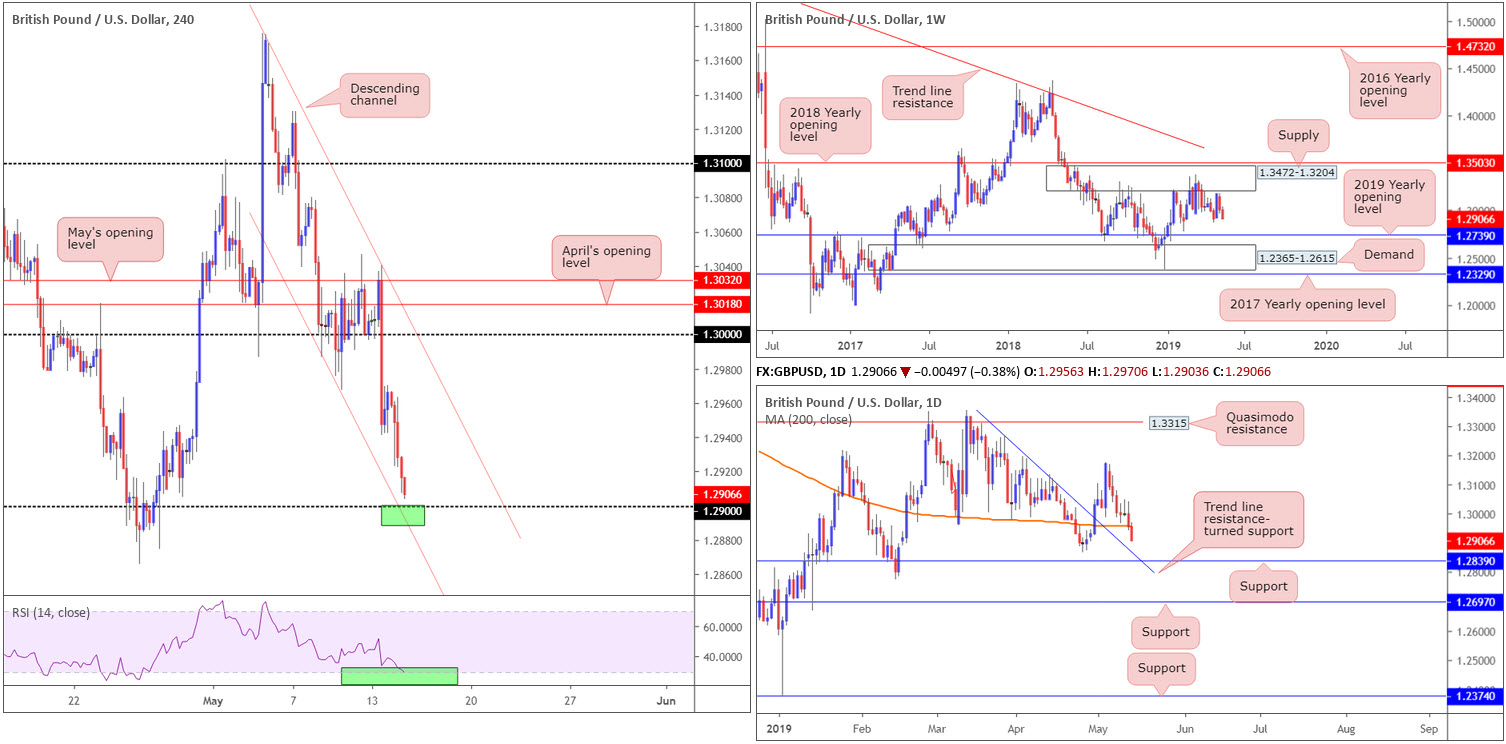
With Brexit talks between the Conservatives and Labour gridlocked, as well as easing concerns over US/China trade dispute and a mixed employment report out of the UK, the British pound remained on the defensive vs. its US counterpart Tuesday, down 0.38%.
The 1.29 handle on the H4 timeframe prodded its way into view, which, by and of itself, is a notable support level. What gives this figure extra credibility is the converging H4 channel support drawn from the low 1.2987, and the RSI confirming oversold status (green zones).
The story on the weekly timeframe has price continuing to head lower after coming within touching distance of supply at 1.3472-1.3204 in recent trade, situated a few points south of the 2018 yearly opening level at 1.3503. Follow-through selling from this point could eventually attempt an approach towards the 2019 yearly opening level at 1.2739, shadowed closely by a demand area at 1.2365-1.2615.
Closer analysis of price action on the daily timeframe, nonetheless, shows the unit dethroned its 200-day SMA and is now steering towards merging trend line resistance-turned support (extended from the high 1.3380) and support at 1.2839.
Areas of consideration:
Although the higher-timeframe picture exhibits scope to push beyond 1.29, a bounce from this figure would not be surprising owing to its connection with H4 channel support (see above). Waiting for additional confirmation to develop off 1.29 before pressing the buy button is recommended (entry and risk parameters can be defined according to the selected confirmation technique), though, not only because of higher-timeframe pressure, but also due to round numbers being prone to fakeouts.
Should we dig through 1.29, however, the next port of call on the H4 timeframe can be seen at daily support underlined at 1.2839. And as already noted this level pools together with a daily trend line resistance-turned support.
Today’s data points: US Core Retail Sales m/m; US Retail Sales m/m; FOMC Member Quarles Speaks.
AUD/USD:
Outlook unchanged due to lacklustre movement.
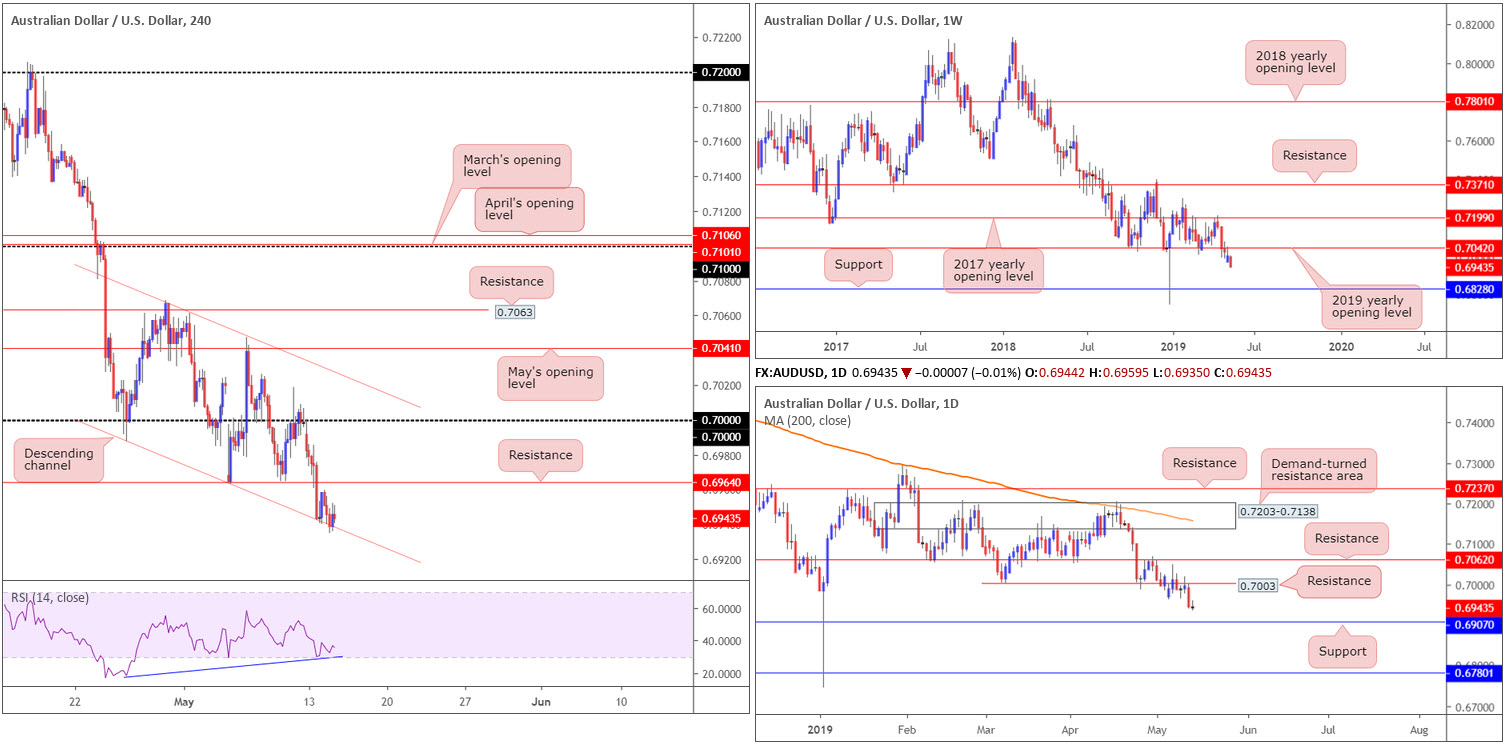
Narrowly mixed vs. its US peer Tuesday, the Australian dollar remains treading water off H4 channel support etched from the low 0.6988 – confirmed by the RSI indicator offering positive divergence ahead of its oversold area (blue line).
Ahead of important data out of Australia and China today, the next upside target to be aware of on the H4 timeframe is resistance at 0.6964, whereas beneath the current channel we have the 0.69 handle (not visible on the screen).
According to the higher-timeframe charts, the pendulum is not swinging in favour of the buyers at the moment. Distancing itself further from the underside of its 2019 yearly opening level at 0.7042 on the weekly timeframe, the pair is seen starved of support until shaking hands with 0.6828.
Resistance coming in at 0.7003 on the daily timeframe remains in focus, with the possibility of further selling materialising in the direction of support pencilled in at 0.6907. Note 0.7003 is likely strengthened on the back of weekly sellers possibly in the mix from 0.7042 (see above).
Areas of consideration:
On account of the technical picture, entering long from the current H4 channel support line remains a chancy move, despite confirming RSI divergence. With that being the case, price action is likely to engulf the said channel and head for 0.69 (remember, though, daily support also comes in at 0.6907).
To take advantage of this move, traders could sell the breakout candle and position a protective stop-loss order beyond its upper shadow, or wait and see if a retest develops and enter on the back of the rejecting candle’s structure. Whichever technique is employed, ensure risk/reward provides more than a 1:1 ratio to 0.6907.
Today’s data points: Australian Westpac Consumer Sentiment; Australian Wage Price Index q/q; China Fixed Asset Investment ytd/y; China Industrial Production y/y; US Core Retail Sales m/m; US Retail Sales m/m; FOMC Member Quarles Speaks.
USD/JPY:
Outlook unchanged.
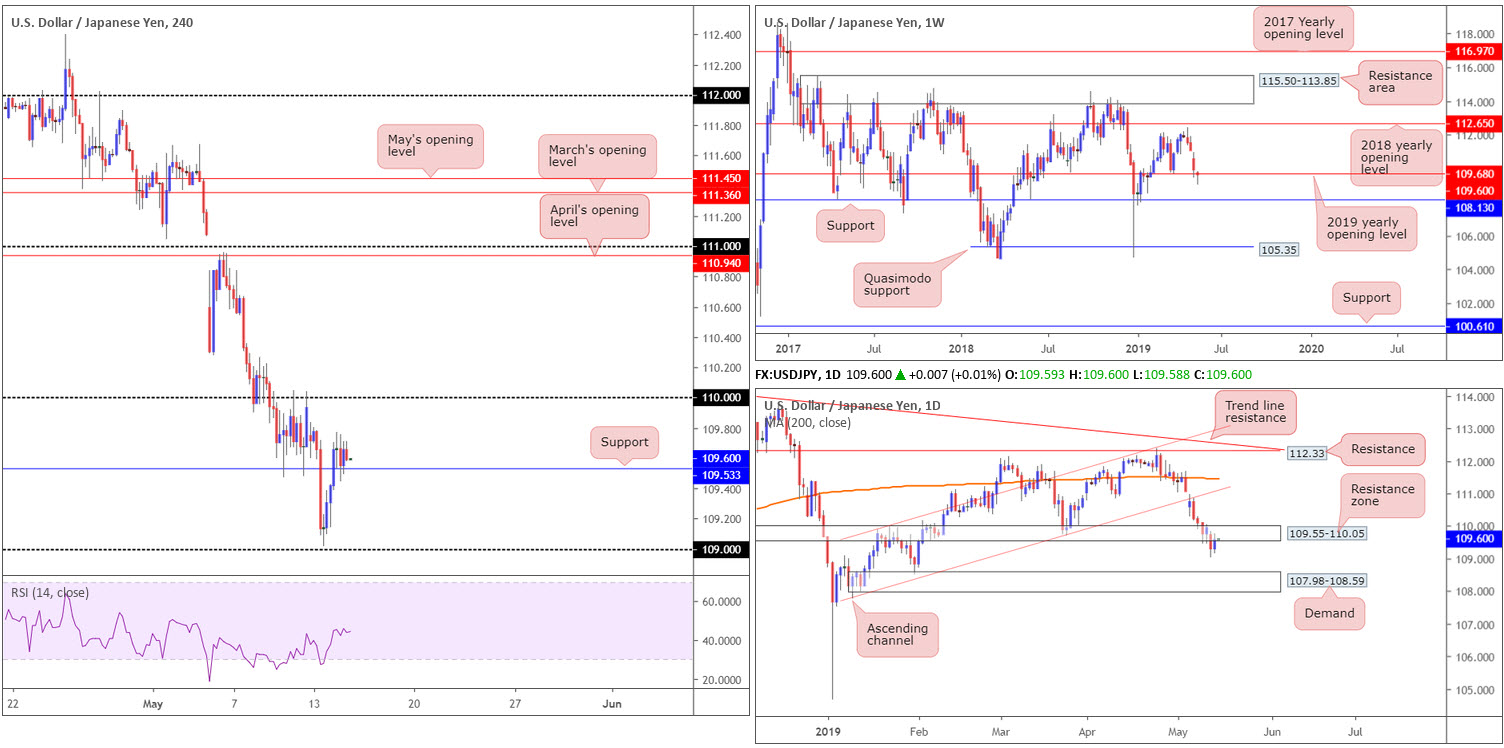
In contrast to Monday’s anti-risk mood, safe-haven positioning unwound Tuesday and left the Japanese yen weaker vs. the buck. The USD/JPY’s H4 candles engulfed local resistance at 109.53 to the upside, which, as you can see, now offers the market a base of support. Continued bidding from this angle has the 110 handle in view as its next resistance that capped upside on two occasions last week.
Though we’re testing support on the H4 timeframe, daily flow is shaking hands with the underside of a resistance zone parked at 109.55-110.05. In union with the daily base, we can also see weekly price roaming close by its 2019 yearly opening level at 109.68 (resistance as of current price). Higher-timeframe structure, as well as the market being entrenched within a reasonably strong downtrend, positions the buyers on weak footing.
Areas of consideration:
Multi-timeframe analysis portends 110 as a potentially problematic resistance to overcome on the H4. For that reason, a decisive push beyond this barrier is unlikely. Price action reclaiming H4 support at 109.53 to the downside appears the more realistic route.
A close beneath 109.53, followed up with a retest by way of a H4 or H1 bearish candlestick formation – think shooting star or bearish engulfing pattern – would, owing to the higher-timeframe picture, likely be sufficient evidence to generate seller interest in this market (traders can determine entry and risk levels according to the selected candlestick’s rules of engagement), targeting 109 as the initial take-profit zone.
Today’s data points: US Core Retail Sales m/m; US Retail Sales m/m; FOMC Member Quarles Speaks.
USD/CAD:
Outlook unchanged due to lacklustre movement.
Registering mild losses, the USD/CAD concluded Tuesday’s session unchanged in terms of structure. In light of yesterday’s lacklustre performance, much of the following piece will echo thoughts put forward in Tuesday morning’s briefing.
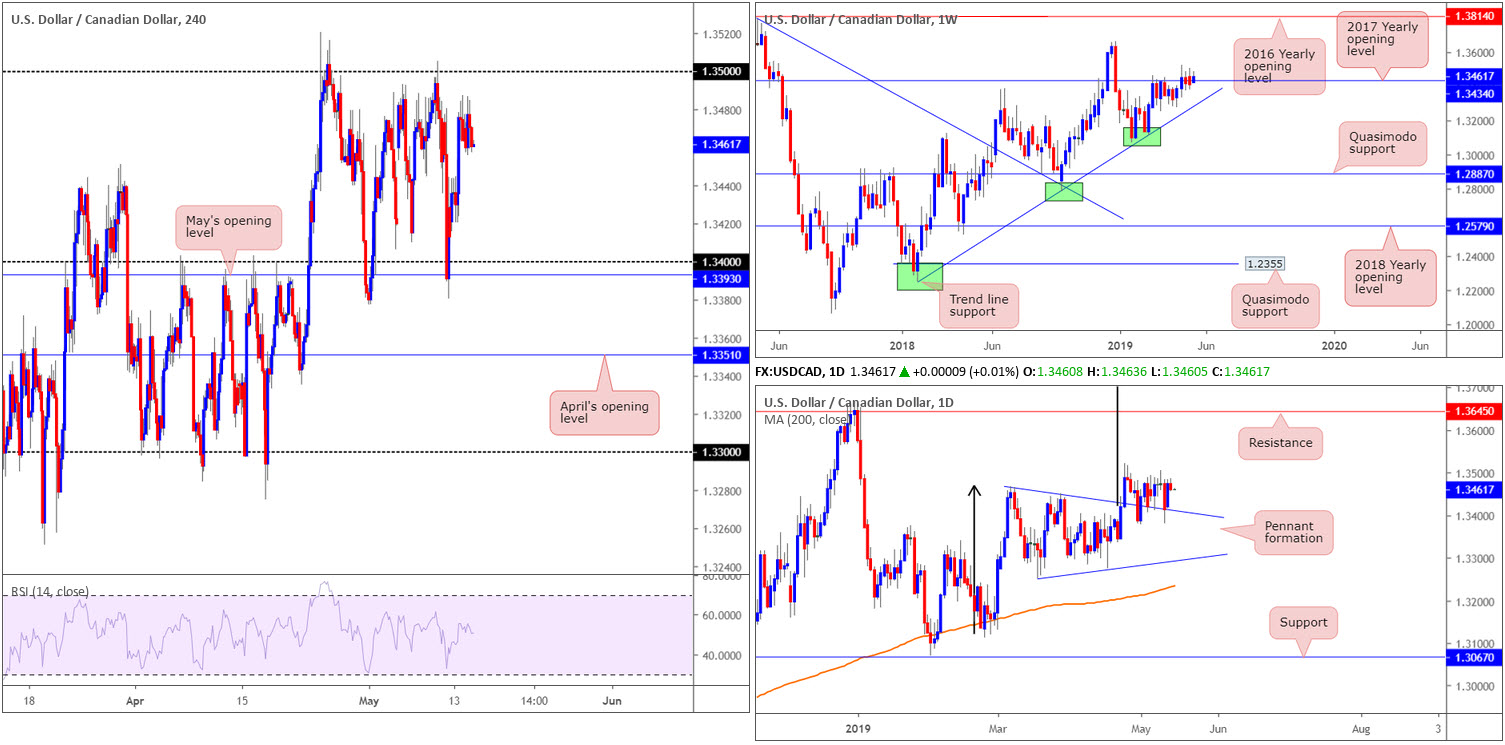
The H4 candles are seen consolidating gains ahead of 1.35. Note the H4 timeframe has been rooted within a range between 1.34/May’s opening level at 1.3393 and 1.35 since late April. The next area of resistance beyond 1.35 falls in around 1.3570 (not seen on the screen).
On a wider perspective, weekly price is seen establishing ground above its 2017 yearly opening level at 1.3434, heightening the idea we may push in the direction of the 2018 yearly high of 1.3664.
Analysis of price action on the daily timeframe shows the unit continues to feed off support drawn from the top edge of a pennant pattern (1.3467). Although the traditional price target (calculated by taking the distance from the beginning of the preceding move and adding it to the breakout price) remains on the chart at 1.3768 (black arrows), the next upside target from a structural standpoint falls in around resistance at 1.3645.
Areas of consideration:
In the event further buying develops, the market may observe a H4 close form above 1.35. Should this occur, traders have the choice of either buying the breakout candle and placing stop-loss orders beneath its tail, or waiting and seeing if a retest scenario takes shape and entering on the back of the rejection candle’s structure.
As highlighted above, the next upside target on the H4 scale can be seen around 1.3570, though according to the higher timeframes we could be heading much higher.
Today’s data points: US Core Retail Sales m/m; US Retail Sales m/m; FOMC Member Quarles Speaks; Canadian CPI m/m; Canadian Common CPI y/y; Canadian Median CPI y/y; Canadian Trimmed CPI y/y.
USD/CHF:
Breaking a three-day bearish phase, the US dollar gained against the Swiss franc on the back of broad-based USD bidding Tuesday, up 0.22%.
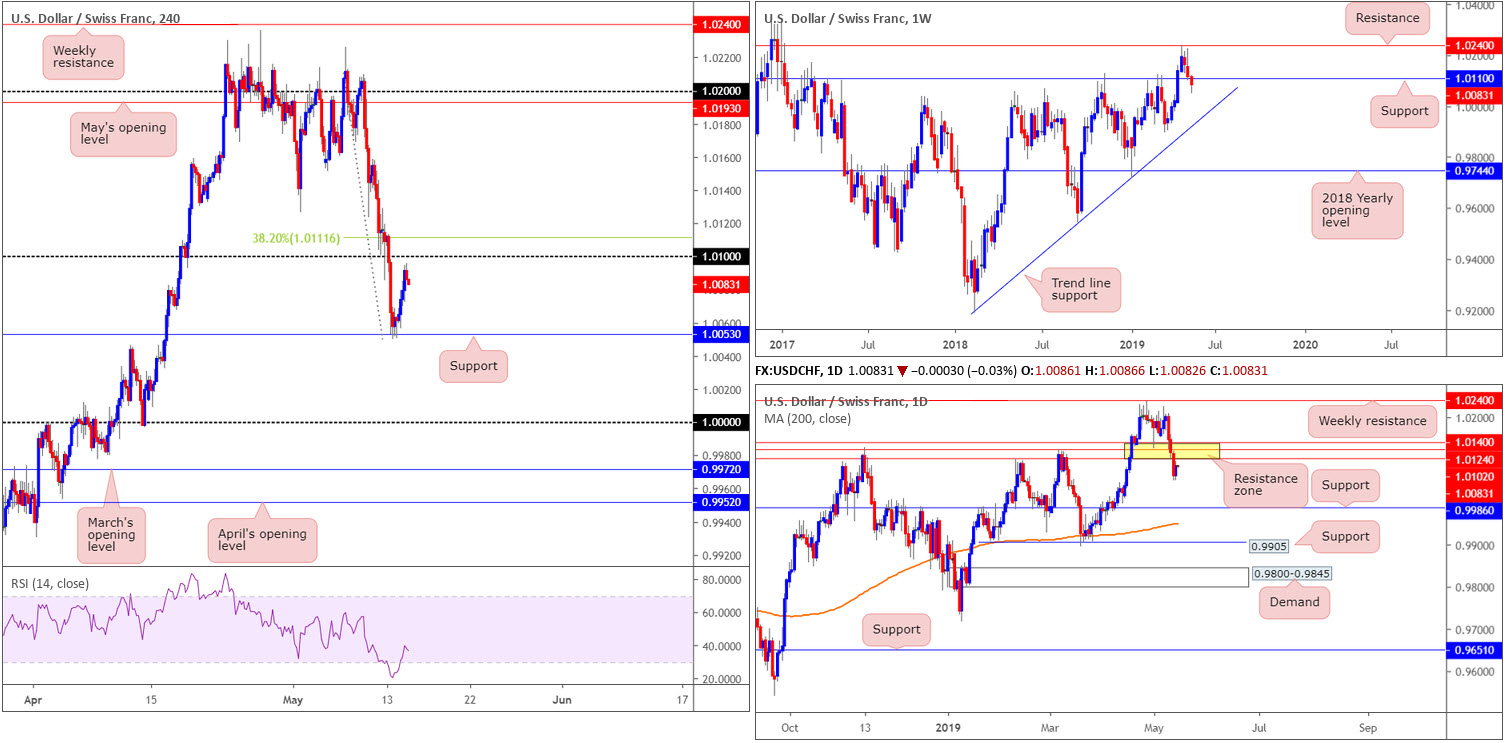
With downside attempts limited by H4 support priced in at 1.0053, the pair appears poised to approach the underside of 1.01, shadowed closely by a 38.2% Fibonacci resistance at 1.0111. What’s also notable from a technical perspective here is the nearby daily resistance zone (yellow) at 1.0102/1.0140, as well as the underside of a weekly support-turned potential resistance at 1.0110.
Areas of consideration:
Keeping it short and sweet today, focus is drawn towards the 1.01 level on the H4 timeframe for shorting opportunities. Conservative stop-loss placement, according to our technical studies, is above the top edge of the daily resistance area at 1.0140.
Aggressive traders, nonetheless, may look to decrease risk size here by opting to use the weekly support-turned potential resistance at 1.0110 as a platform to position stops. The initial downside target can be seen at H4 support mentioned above at 1.0053, followed by parity (1.0000).
Today’s data points: US Core Retail Sales m/m; US Retail Sales m/m; FOMC Member Quarles Speaks.
Dow Jones Industrial Average (DOW 30):
US equities rose Tuesday, with the Dow Jones Industrial Average surging nearly 300 points. This comes after major averages plunged more than 2% as the trade dispute between the US and China escalated.
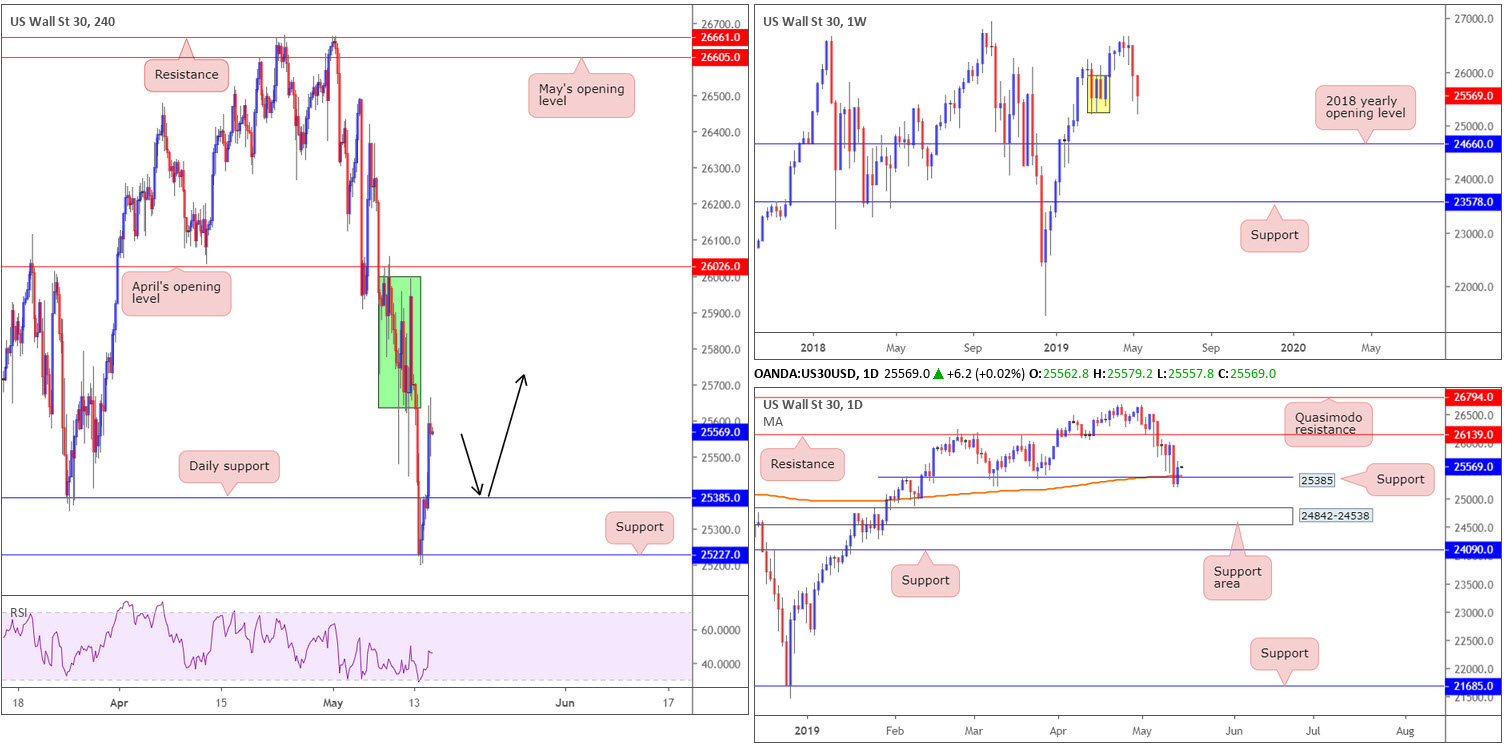
From a technical perspective, we can see daily price dipped beneath support at 25385, along with its 200-day SMA Monday, though reclaimed both technical barriers yesterday. Assuming buyers remain on the offensive here, resistance is seen at 26139. The weekly timeframe’s demand marked in yellow at 25217-25927, in spite of a mild break beneath its lower boundary, appears to be holding firm.
Closer analysis on the H4 timeframe has the candles rebounding from support coming in at 25277, and the RSI indicator following suit from oversold territory. While the next upside resistance enters the fold around 26026 on this scale (April’s opening level), there’s a considerable amount of wood to chop through before getting there (green). Therefore, expect some resistance to emerge prior to reaching 26026.
Areas of consideration:
With clear-cut daily support at 25385 aligning with the 200-day SMA, buyers are already likely involved here, possibly targeting the daily resistance highlighted above at 26139. Couple this with weekly demand at 25217-25927, albeit somewhat fragile at the moment, also in the mix, buyers appear to have the upper hand.
Having pinpointed possible direction, the research team wants to see the H4 candles retest daily support mentioned above at 25385 and produce a bullish candlestick signal (black arrows). That way, traders have identified possible buyer intent and also have a pattern in which to base entry and risk levels from.
Today’s data points: US Core Retail Sales m/m; US Retail Sales m/m; FOMC Member Quarles Speaks.
XAU/USD (GOLD):
Outlook unchanged due to lacklustre movement.
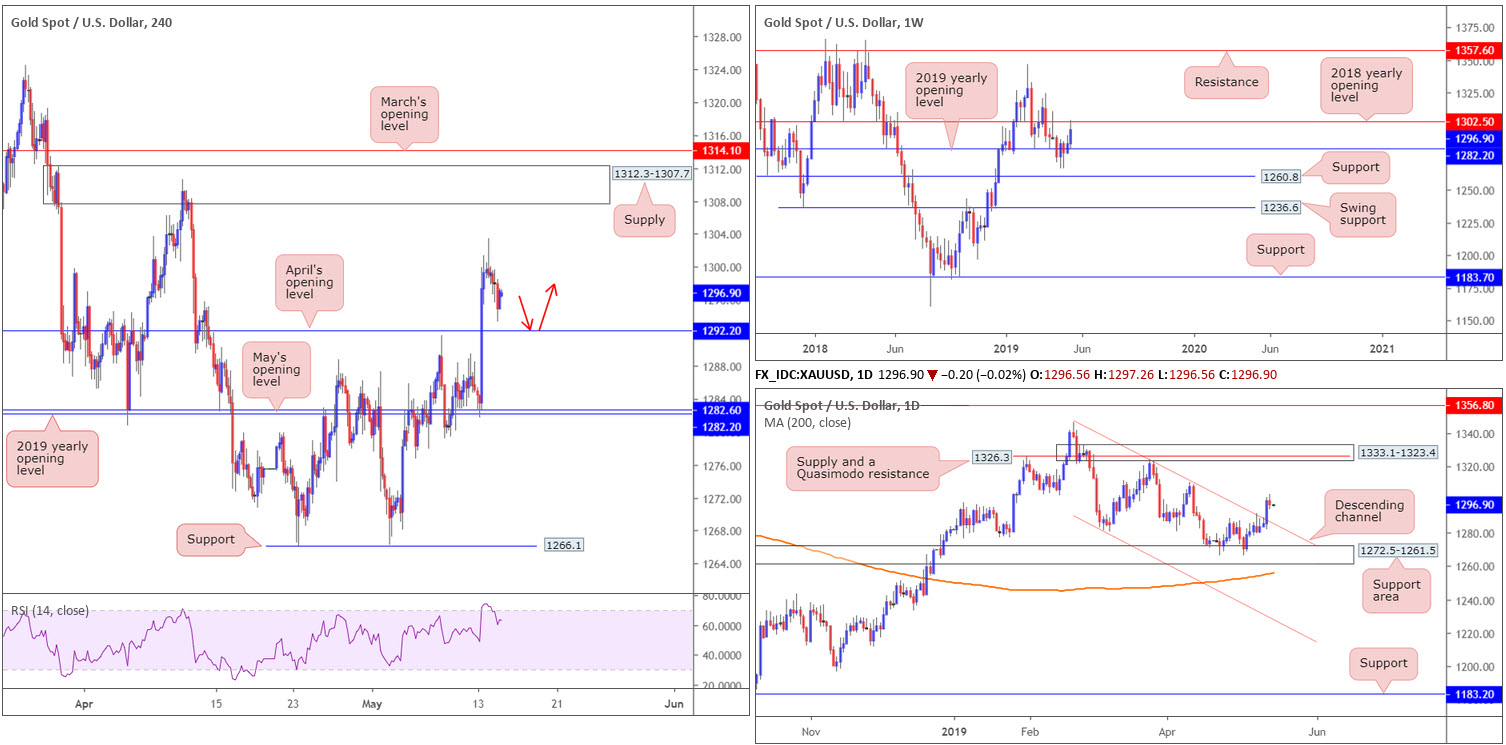
After Monday’s impressive advance that lifted the metal beyond its $1300 mark, buyers failed to sustain gains Tuesday and drifted to a session low of 1293.8. As underscored as a possibility in Tuesday’s morning brief, the 2018 yearly opening level at 1302.5 on the weekly timeframe is now serving as resistance. Further pressure to the downside from here may eventually call for a test of the 2019 yearly opening level plotted at 1282.2.
Contrary to the weekly timeframe’s position, though, the daily candles exhibit scope to explore higher ground, targeting the 1310.6 April 10 high, followed by a supply zone at 1333.1-1323.4. Before reaching the said areas, traders are urged to pencil in the possibility a retest of channel resistance-turned support (extended from the high 1346.7) may develop.
Across on the H4 timeframe, price action is poised to retest April’s opening level at 1292.2 as support. The runway north from here, aside from local resistance at yesterday’s high 1303.4, leads to a supply zone coming in at 1312.3-1307.7.
Areas of consideration:
As both daily and H4 timeframes exhibit scope to press higher, a retest of April’s opening level at 1292.2 as support remains of interest today. However, seeing as we’re also trading from weekly resistance, traders are recommended to wait for additional confirmation to materialise before pulling the trigger. This could be anything from a bullish candlestick reversal signal, an MA crossover or even drilling down to the lower timeframes and entering based on local structure: support and resistance.
Failure to retest 1292.2, focus is drawn towards the H4 supply at 1312.3-1307.7 for shorts, given the close connection the area has to weekly resistance at 1302.5. Conservative stop-loss placement is seen above March’s opening level at 1314.1.
The accuracy, completeness and timeliness of the information contained on this site cannot be guaranteed. IC Markets does not warranty, guarantee or make any representations, or assume any liability with regard to financial results based on the use of the information in the site.
News, views, opinions, recommendations and other information obtained from sources outside of www.icmarkets.com.au, used in this site are believed to be reliable, but we cannot guarantee their accuracy or completeness. All such information is subject to change at any time without notice. IC Markets assumes no responsibility for the content of any linked site. The fact that such links may exist does not indicate approval or endorsement of any material contained on any linked site.
IC Markets is not liable for any harm caused by the transmission, through accessing the services or information on this site, of a computer virus, or other computer code or programming device that might be used to access, delete, damage, disable, disrupt or otherwise impede in any manner, the operation of the site or of any user’s software, hardware, data or property.


