
A note on lower-timeframe confirming price action…
Waiting for lower timeframe confirmation is our main tool to confirm strength within higher timeframe zones, and has really been the key to our trading success. It takes a little time to understand the subtle nuances, however, as each trade is never the same, but once you master the rhythm so to speak, you will be saved from countless unnecessary losing trades. The following is a list of what we look for:
- A break/retest of supply or demand dependent on which way you’re trading.
- A trendline break/retest.
- Buying/selling tails/wicks – essentially we look for a cluster of very obvious spikes off of lower timeframe support and resistance levels within the higher timeframe zone.
- Candlestick patterns. We tend to stick with pin bars and engulfing bars as these have proven to be the most effective.
We typically search for lower-timeframe confirmation between the M15 and H1 timeframes, since most of our higher-timeframe areas begin with the H4. Stops are usually placed 3-5 pips beyond confirming structures.
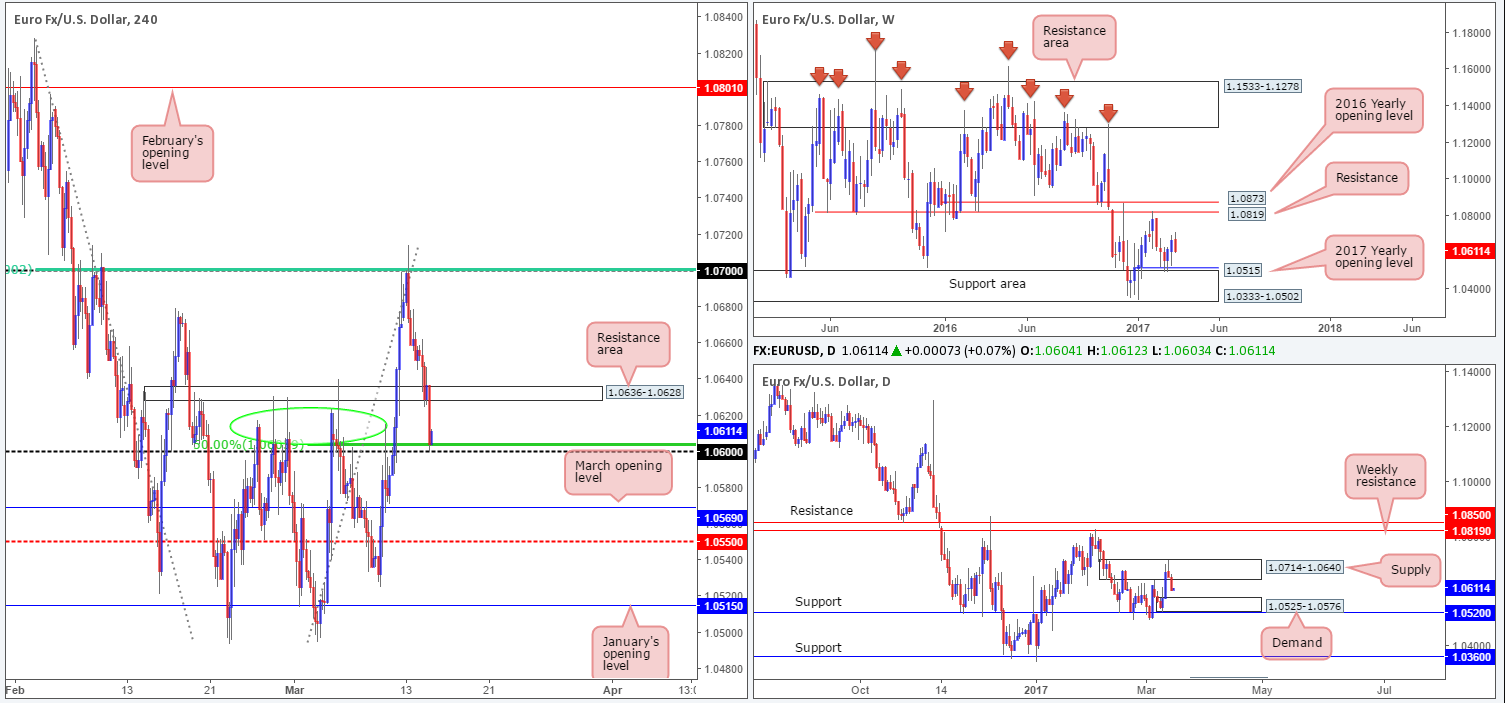
EUR/USD:
The EUR sustained further losses against its US counterpart during the course of yesterday’s sessions, consequently bringing the pair down as far as the 1.06 handle into the closing bell. US PPI data came in hotter than expected, but failed to generate much of a reaction. Although1.06 boasts little higher-timeframe structure; it does merge closely with the 50.0% retracement value at 1.0603. Furthermore, the pair is likely to find some support around 1.06ish region with it having been a strong barrier of resistance on a number of occasions over the past few weeks (see green circle).
Our suggestions: With little higher-timeframe structure seen supporting the 1.06 zone, it’s still a risky buy from here, in our opinion. As a result of this, we would strongly recommend waiting for a lower-timeframe confirming buy signal (see the top of this report) to form before considering a position. The first take-profit target is set at the nearby H4 resistance area coming in at 1.0636-1.0628.
In addition to the technicals, the much anticipated FOMC rate decision, economic projections and press conference is finally upon us today. According to the CME’s FedWatch tool, there’s over a 90% chance that we’ll see an increase of 25bps. Therefore, remain alert during this time!
Data points to consider: US CPI report/US retail sales both scheduled for release at 12.30pm, FOMC rate decision, economic projections and press conference at 6-6.30pm GMT.
Levels to watch/live orders:
- Buys: 1.06 neighborhood ([waiting for a lower-timeframe confirming signal to form is advised] stop loss: dependent on where one confirms this level).
- Sells: Flat (stop loss: N/A).
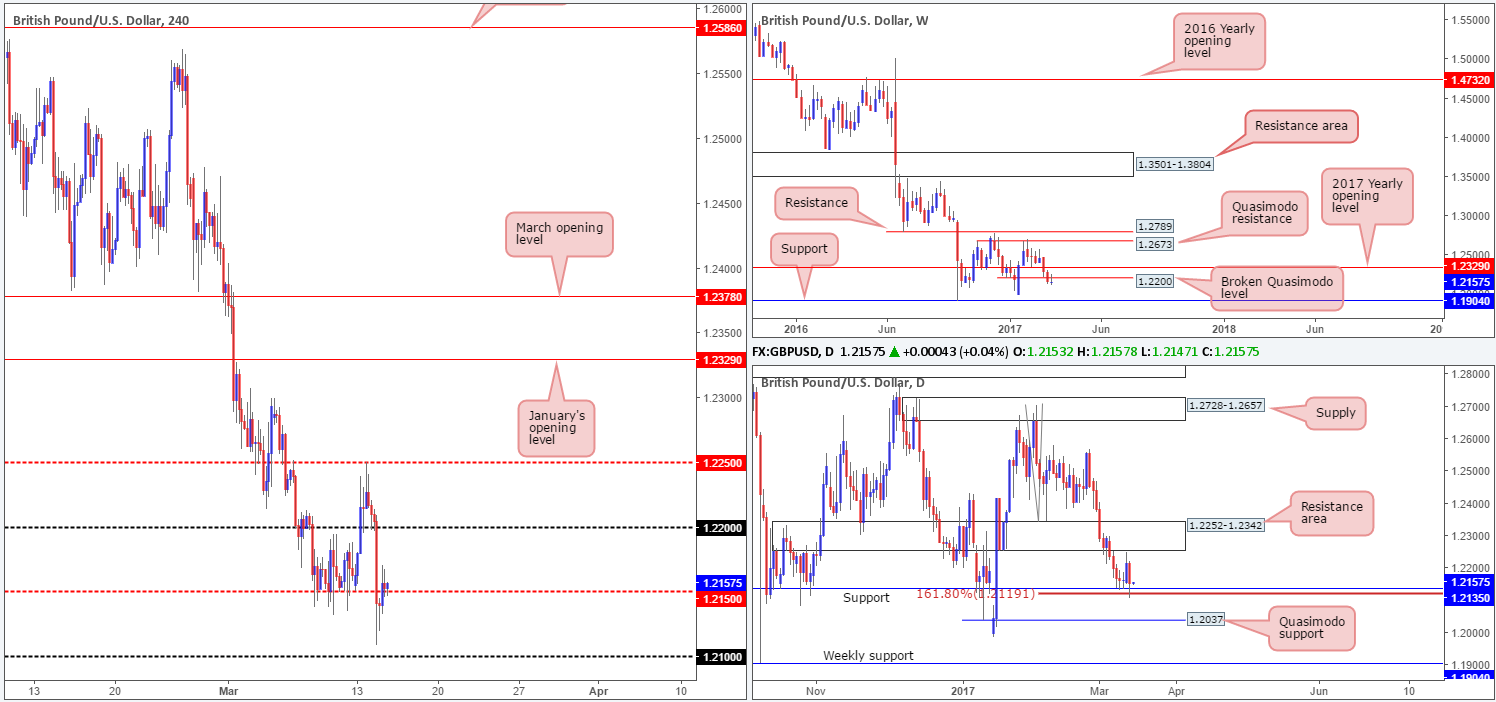
GBP/USD:
Weekly action is currently seen defending the underside of a recently broken weekly Quasimodo line coming in at 1.22. On the condition that the pair remains bearish beyond this hurdle, then the next port of call on this scale can be seen around weekly support coming in at 1.1904. Looking down to the daily timeframe, yesterday’s candle tested daily support drawn from 1.2135/ the daily 161.8% Fib ext. at 1.2119 taken from the high 1.2706, consequently erasing all of Monday’s gains!
Over on the H4 candles, we can see that the major plummeted lower going into the early hours of Europe yesterday, taking out both the 1.22 handle and the H4 mid-way support at 1.2150. Nevertheless, during the London morning segment, price did manage to bottom just ahead of the 1.21 handle and break back above the 1.2150 vicinity into the US open.
Our suggestions: Although the market does sport a rather bearish vibe right now, traders are in somewhat of a precarious position according to technical structure. A sell trade looks fantastic from the weekly timeframe, but at the same time, a potentially terrible idea on the daily timeframe. A buy trade on the other hand, appears sound from the daily timeframe, but risky from a weekly perspective.
With the much anticipated FOMC rate decision, economic projections and press conference upon us today, and UK employment data just around the corner, we feel opting to stand on the sidelines may very well be the better path to take. At least until the FOMC have had their way!
Data points to consider: UK employment report at 9.30am. US CPI report/US retail sales both scheduled for release at 12.30pm, FOMC rate decision, economic projections and press conference at 6-6.30pm GMT.
Levels to watch/live orders:
- Buys: Flat (stop loss: N/A).
- Sells: Flat (stop loss: N/A).
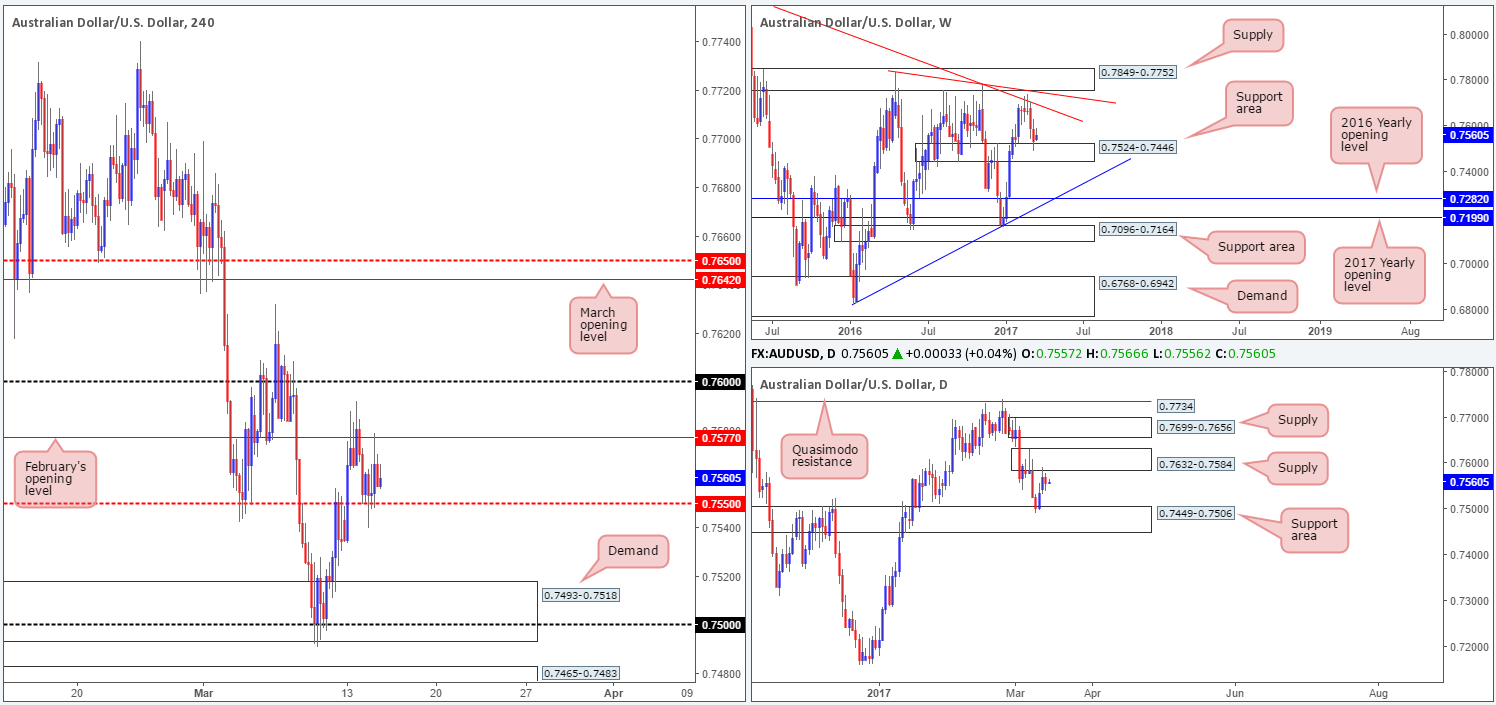
AUD/USD:
After the pair broke beyond the H4 mid-way support hurdle at 0.7550 during the early hours of Monday’s segment, price has remained somewhat directionless between 0.7550 and the overhead February opening level at 0.7577. Over on the weekly scale the weekly support area continues to buoy price, which could eventually prompt an approach up to the weekly trendline resistance extended from the high 0.8163. On the other side of the field, however, daily price is seen tickling the underside of a daily supply zone at 0.7632-0.7584. In order for weekly price to advance, this daily zone will have to be taken out. Of particular interest here is the daily supply at 0.7699-0.7656 seen above the current zone, given that it intersects with the aforementioned weekly trendline resistance.
Our suggestions: There is very little telling us to get involved with this market at the moment. While a break above February’s opening base would be considered a bullish signal according to the weekly timeframe, we would be wary of buying here owing to the next upside target sitting at 0.76, and also the fact that price would still be trading within daily supply!
Our team feels that in light of the slightly restricted price action currently in view, the best position to take here is no position at all.
Data points to consider: US CPI report/US retail sales both scheduled for release at 12.30pm, FOMC rate decision, economic projections and press conference at 6-6.30pm GMT.
Levels to watch/live orders:
- Buys: Flat (stop loss: N/A).
- Sells: Flat (stop loss: N/A).
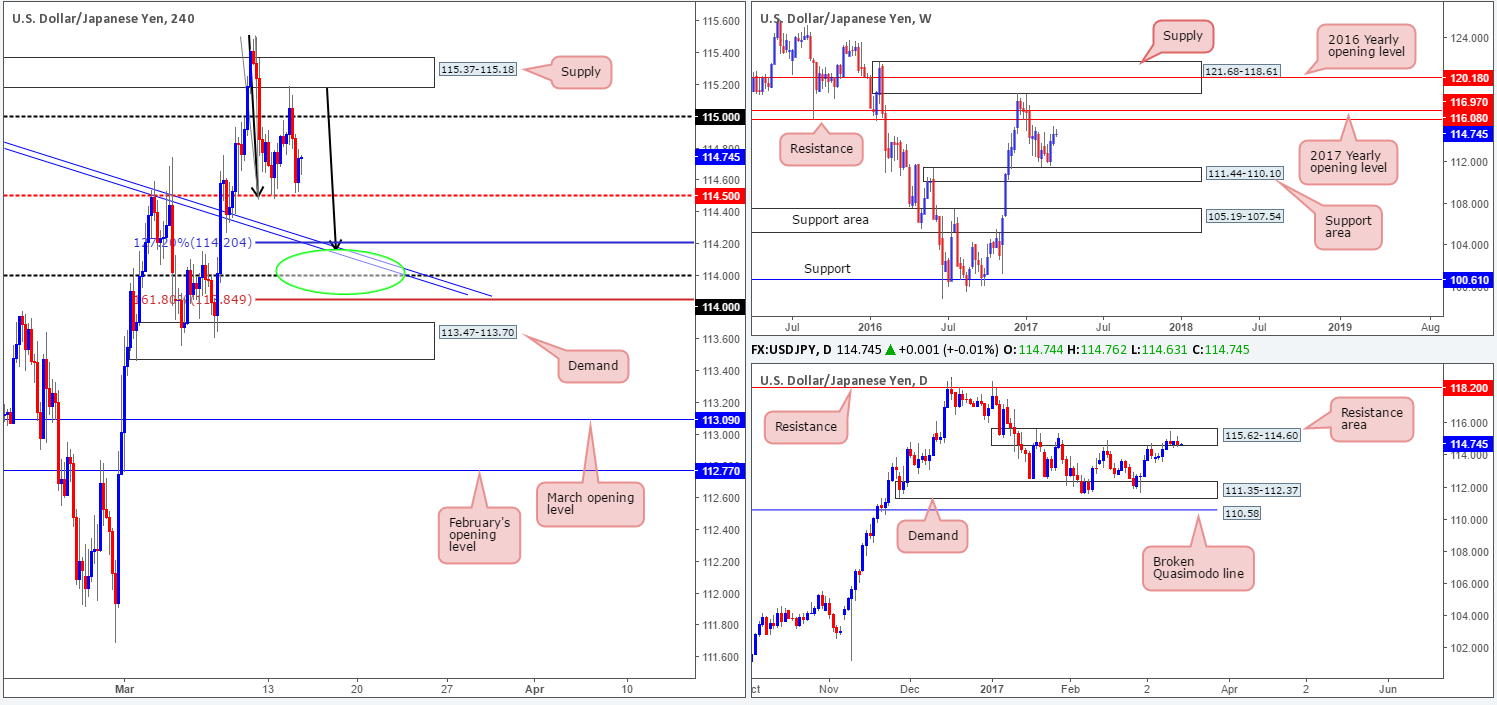
USD/JPY:
During the course of yesterday’s sessions the USD/JPY aggressively whipsawed through the 115 handle, tapped the underside of a nearby H4 supply zone at 115.37-115.18, and proceeded to selloff going into the London segment. With the H4 candles now currently finding support just ahead of the H4 mid-way number 114.50, where do we go from here? Well, according to the weekly timeframe, price remains on course to cross swords with a weekly resistance level seen at 116.08. Despite this, the daily candles are persistently holding ground within the walls of a daily resistance area coming in at 115.62-114.60.
Our suggestions: Based on the above notes, our team has their eye on the H4 113.84/114.20 (AB=CD H4 Fib ext. 127.2/161.8%) neighborhood for longs. Granted this does entail entering long just below the current daily resistance area, but what with weekly price suggesting further buying could be on the cards and the confluence (H4 trendline support extended from the high 115.62, 114 handle and H4 AB=CD approach [black arrows]) seen around 113.84/114.20, a bounce north from here is considered high probability, in our opinion. Be that as it may, we would not advise trading this zone around FOMC time today, as volatility is expected to be high.
Data points to consider: US CPI report/US retail sales both scheduled for release at 12.30pm, FOMC rate decision, economic projections and press conference at 6-6.30pm GMT.
Levels to watch/live orders:
- Buys: 113.84/114.20 ([waiting for a lower-timeframe confirming signal to form is advised – this will help avoid a fakeout down to the nearby H4 demand at 113.47-113.70] stop loss: dependent on where one confirms this level).
- Sells: Flat (stop loss: N/A).
USD/CAD:
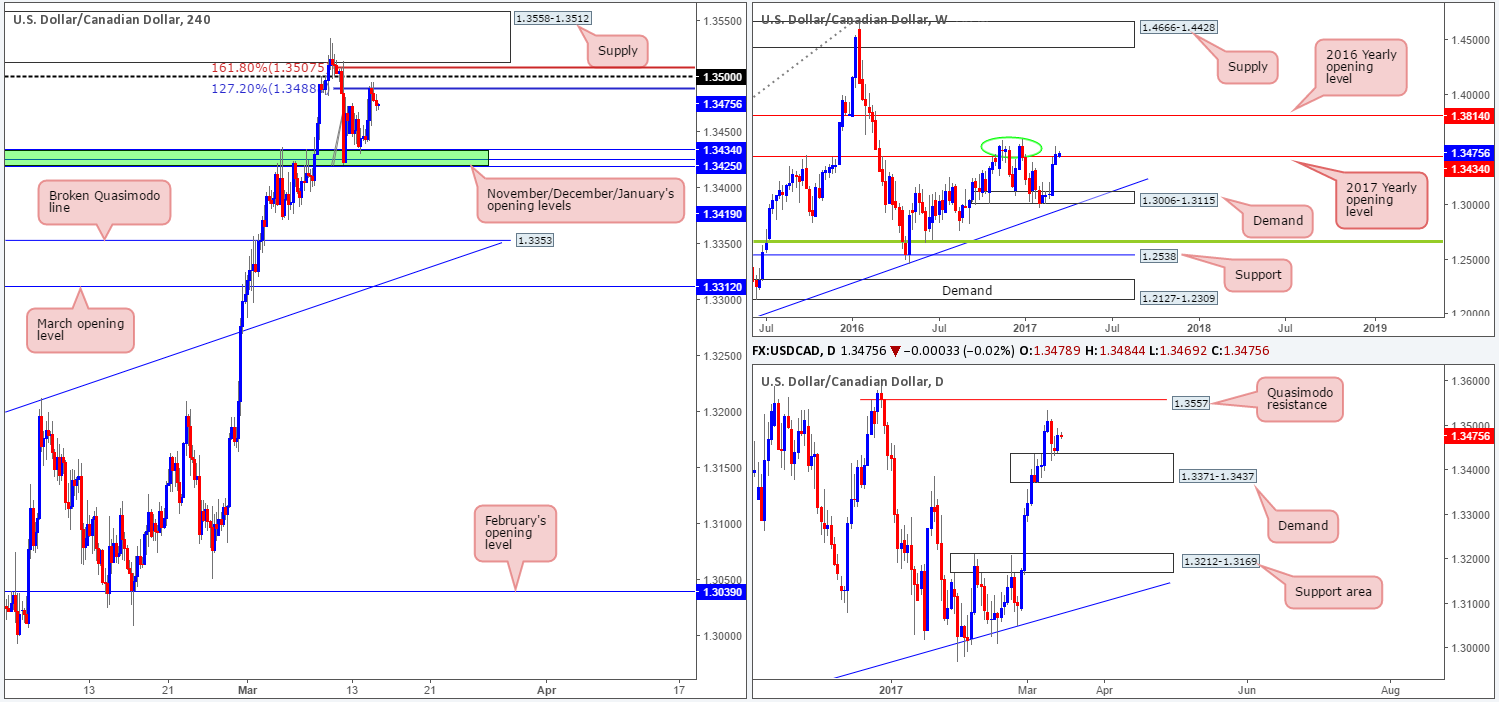
Recent action shows that the USD/CAD extended its bounce from the 1.3419/1.3434 H4 region (November/December/January’s opening levels), lifting price up to within striking distance of the 1.35 handle. As you can see, the H4 candles have held ground within a H4 AB=CD Fib ext. 161.8%/127.2% area at 1.3507/1.3488 (taken from the low 1.3420) and is selling off as we write. This was a nice reversal zone. The thing that turned us off, however, was the fact that H4 momentum is still pointing to the upside and daily price had recently bounced from the top edge of a daily demand area chalked in at 1.3371-1.3437. The flipside to this, of course, is the weekly timeframe. The unit managed to marginally close beyond the 2017 yearly opening level at 1.3434. But since the close above this line was relatively minor, and taking into account that there is a nearby weekly double-top formation seen around the 1.3588 region (green circle), we do not consider 1.3434 to be out of the picture as a weekly resistance just yet!
Our suggestions: In view of the conflict seen between the higher-timeframe structures at the moment, we are wary of attempting to try and sell right now, despite the beautiful H4 AB=CD setup in play! And as for buying, this is also something we would not be comfortable taking part in, owing to the weekly structure mentioned above. With this in mind, opting to stand on the sidelines here may very well be the better path to take today.
Data points to consider: US CPI report/US retail sales both scheduled for release at 12.30pm, FOMC rate decision, economic projections and press conference at 6-6.30pm. Crude oil inventories at 2.30pm GMT.
Levels to watch/live orders:
- Buys: Flat (stop loss: N/A).
- Sells: Flat (stop loss: N/A).
USD/CHF:
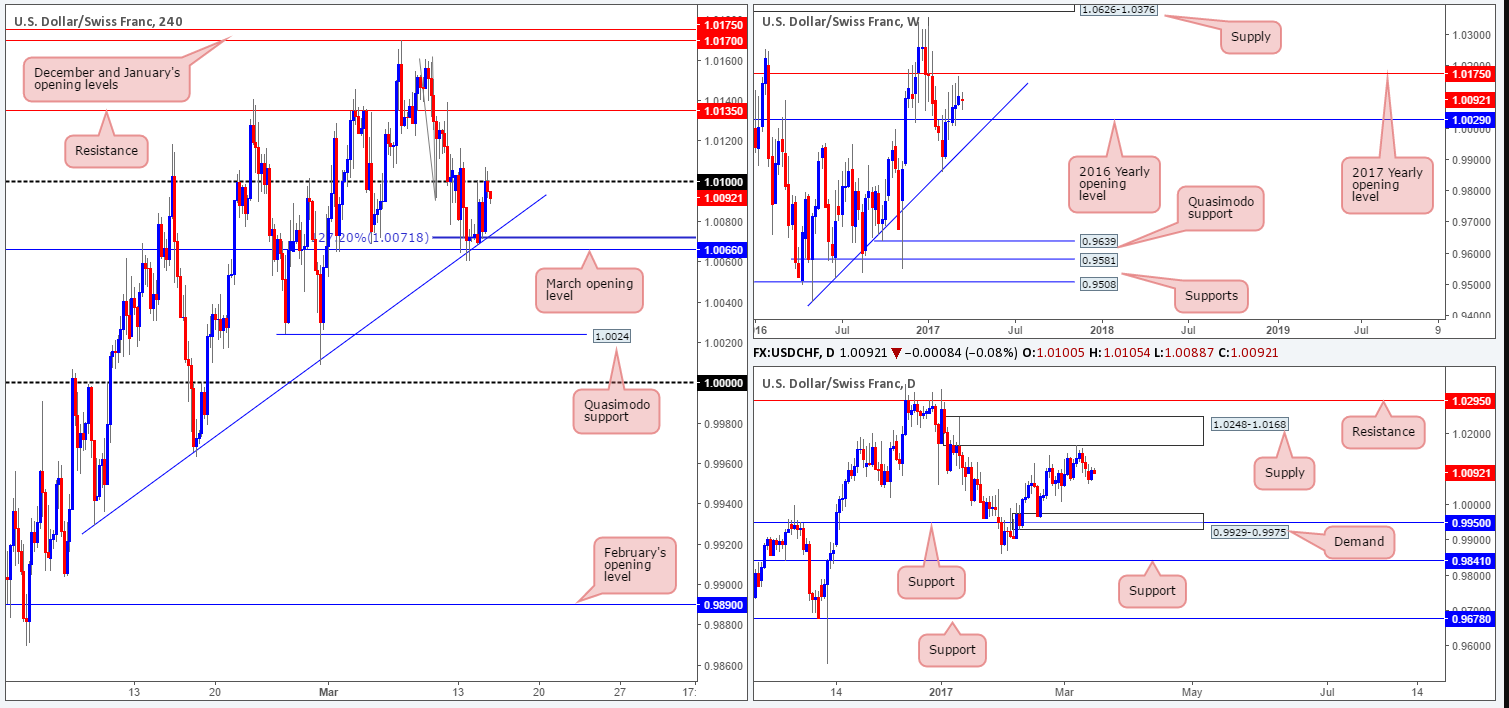
Try as it might, the Swissy could not muster enough strength to breach March’s opening level at 1.0066. As highlighted in Monday’s report, this number is bolstered by a H4 trendline support taken from the low 0.9929 and a H4 127.2% Fib ext. at 1.0071 (taken from the high 1.0160). As we write, nevertheless, the nearby 1.01 handle is providing resistance to this market. Whether or not this will be enough to push the unit back down to the 1.0066 perimeter is difficult to judge, since there is no higher-timeframe structures positioned nearby these levels.
Looking up to the weekly picture, price is seen trading mid-range between the 2017/2016 yearly opening levels at 1.0175/1.0029. By the same token, daily action is also currently seen trading mid-range between daily supply at 1.0248-1.0168 and daily demand pegged at 0.9929-0.9975, which happens to intersect with a daily support level seen at 0.9950.
Our suggestions: A break above 1.01 boasts little room for maneuver with H4 resistance seen at 1.0135. A break below 1.0066 on the other hand may call for price to challenge the H4 Quasimodo support at 1.0024, followed closely by parity (1.0000). To that end, we feel there’s a possibility for shorts beyond 1.0066 today if a retest of this number as resistance is seen that’s bolstered by a lower-timeframe sell signal (see the top of this report). However, do remain vigilant today since we have the much anticipated FOMC rate decision, economic projections and press conference just around the corner.
Data points to consider: US CPI report/US retail sales both scheduled for release at 12.30pm, FOMC rate decision, economic projections and press conference at 6-6.30pm. CHF PPI data at 8.15am GMT.
Levels to watch/live orders:
- Buys: Flat (stop loss: N/A).
- Sells: Watch for price to engulf 1.0066 and then look to trade any retest seen thereafter (waiting for a lower-timeframe confirming signal to form following the retest is advised] stop loss: dependent on where one confirms the level).
DOW 30:
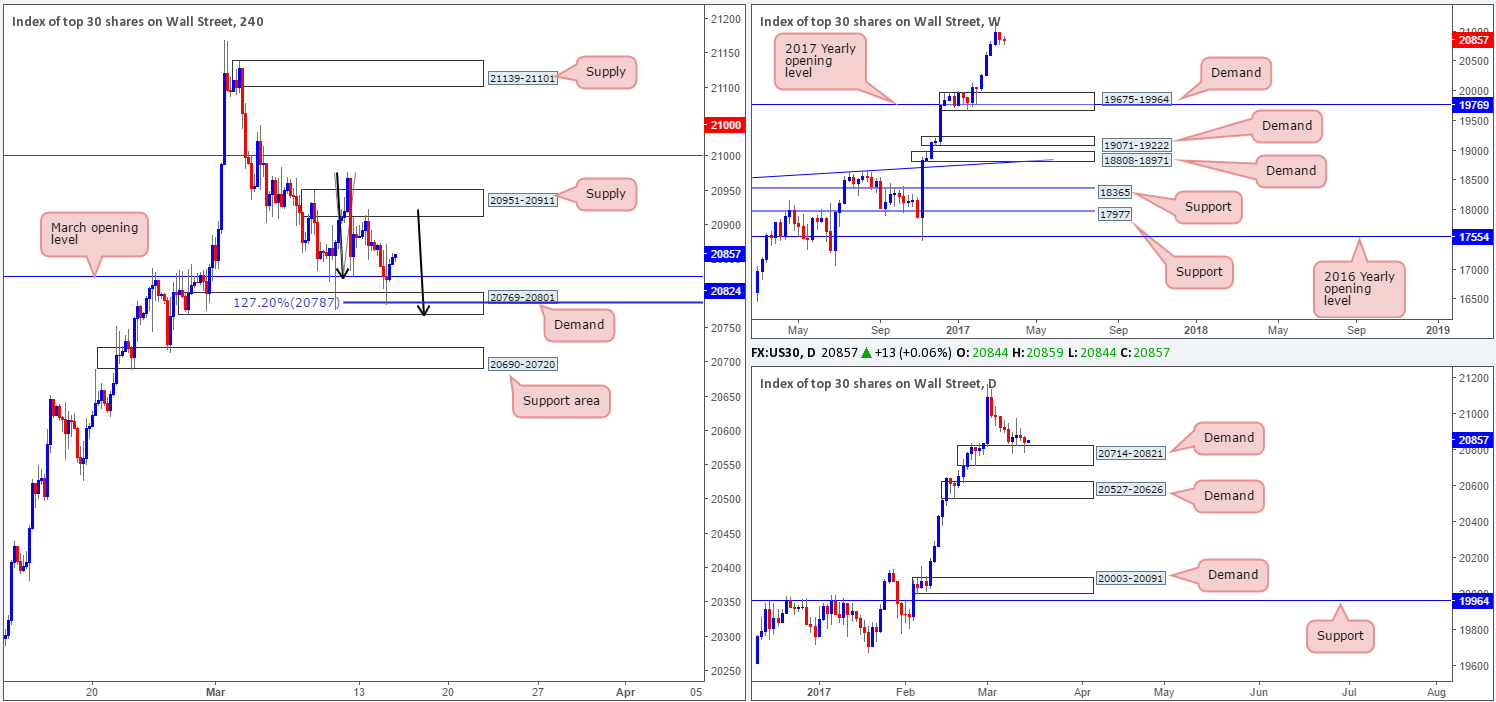
As can be seen from the H4 chart this morning, the DOW momentarily surpassed March’s opening level at 20824, bounced off a H4 AB=CD 127.2% Fib ext. at 20787 (seen lodged within a H4 demand at 20769-20801), and ended the day closing at 20844. What this move also accomplished was a relatively nice-looking daily buying tail printed from the top edge of a daily demand zone seen at 20714-20821.
With equities still trading nearby record highs, there’s a good chance that this unit could stretch higher today and potentially even break through H4 supply at 20951-20911. Should price retest March’s opening base line sometime today, we would consider a long in this market on the condition that a reasonably sized H4 bullish rotation candle is seen. However, do remain vigilant today since we have the much anticipated FOMC rate decision, economic projections and press conference just around the corner.
Our suggestions: Watch for potential longs off the 20824 barrier today. In the event that one manages to pin down a setup from here, we’d look to trail the position up to the aforementioned H4 supply, followed closely by the 21000 mark.
Data points to consider: US CPI report/US retail sales both scheduled for release at 12.30pm, FOMC rate decision, economic projections and press conference at 6-6.30pm GMT.
Levels to watch/live orders:
- Buys: 20824 region ([waiting for a reasonably sized H4 bull candle to form here before pulling the trigger is advised] stop loss: ideally beyond the trigger candle).
- Sells: Flat (stop loss: N/A).
GOLD:
Following the daily bearish selling wick printed on Monday, we saw the yellow metal take a hit during yesterday’s trading, bringing price back to the top edge of the daily support area at 1197.4-1187.7. What is also quite notable from a technical perspective is the H4 bullish AB=CD 127.2% pattern that completed within the walls of a H4 demand zone drawn from 1194.8-1198.3. As we can all see, price is rallying from this base. How far price will advance from here is, well, anybody’s guess. The reason we say this is simply due to the weekly timeframe indicating that price could potentially continue driving lower until we reach the weekly support level drawn from 1180.1.
Our suggestions: While there is some conflict seen between the higher timeframes at the moment, there’s a good chance that H4 flow will reach the 1204.0 region before stalling. Well done to any of our readers who managed to get long from the tip of the H4 AB=CD formation!
Unless the H4 candles retest the current H4 demand sometime today (at this point we would consider entering long from here assuming that we have the backing of a lower-timeframe buy signal [see the top of this report]), we will remain flat until after today’s FOMC event.

Levels to watch/live orders:
- Buys: 1194.8-1198.3 ([waiting for a lower-timeframe confirming signal to form is advised prior to pulling the trigger here] stop loss: dependent on where one confirms this area).
- Sells: Flat (stop loss: N/A).


