
Key risk events today:
BoJ Outlook Report, Monetary Policy Statement and Press Conference; UK Inflation; US Industrial Production m/m; SNB Chairman Jordan Speaks; BoC Monetary Policy Report, Rate Statement, Overnight Rate and Press Conference; Crude Oil Inventories.
(Previous analysis as well as outside sources – italics).
EUR/USD:
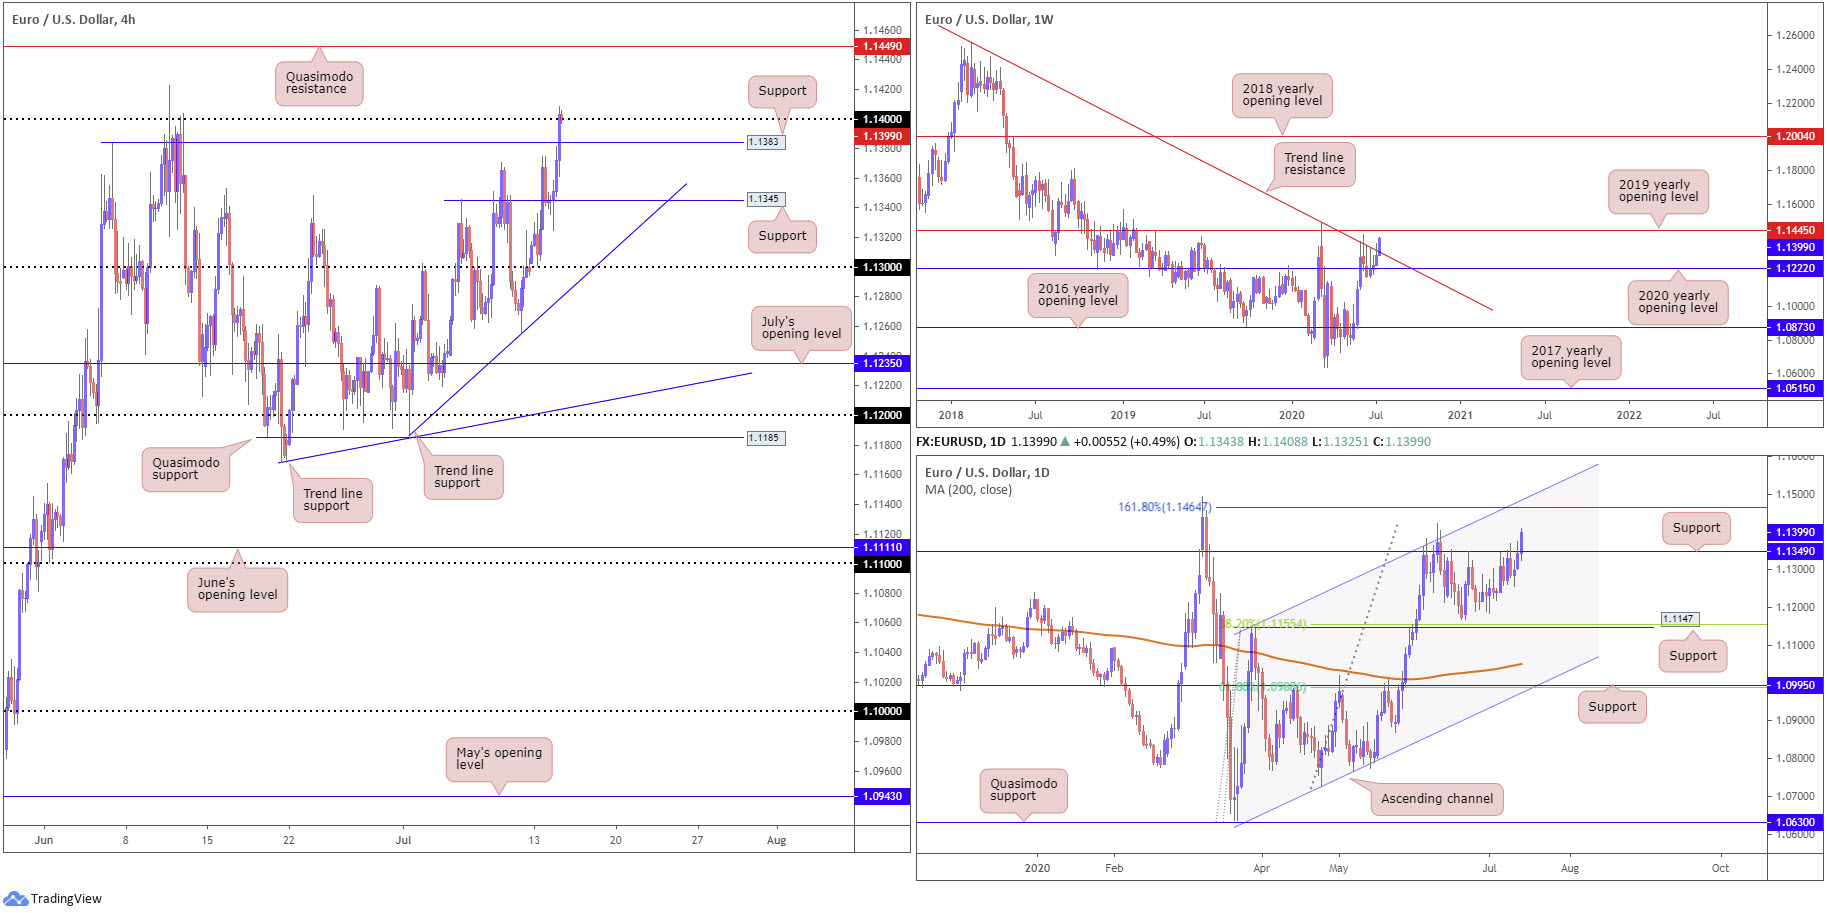
Europe’s single currency held onto the bulk of its gains Tuesday, as the US dollar continued to navigate lower terrain. Following a 1.1345 support retest (prior Quasimodo resistance), price action on the H4 timeframe rode through Quasimodo resistance at 1.1383 (now a serving support) and touched gloves with the 1.14 handle.
Traders who read Tuesday’s technical briefing may recall the following (italics):
Today’s technical spotlight is fixed on 1.1345 H4 support, which may call for a retest and lure dip-buying into the fold. Conservative buyers will possibly seek additional confirmation before pulling the trigger, though irrespective of the entry method the initial take-profit targets rest at 1.1383 and 1.14 on the H4.
As you can see, the above played out as expected.
Registering a third consecutive daily advance, a rally beyond 1.14 could be seen today, with Quasimodo resistance at 1.1449 plotted as the next upside hurdle.
Further out, we can see weekly price making headway above long-term trend line resistance, extended from the high 1.2555. This pulls focus towards the 2019 yearly opening level at 1.1445.
Daily resistance at 1.1349, a level capping upside since the beginning of June, ceded ground Tuesday (now acting support), pointing to a possible approach towards a 161.8% Fibonacci extension point at 1.1464, combined with a channel resistance, extended from the high 1.1147.
Areas of consideration:
The broad bullish tone evident on the weekly and daily timeframes could keep the euro on the winning side of the table around 1.14 on the H4 today. A H4 close north of the latter has 1.1445 on the weekly timeframe (2019 yearly opening level) to target, followed by H4 Quasimodo resistance at 1.1449 and the 161.8% Fibonacci extension point on the daily timeframe at 1.1464.
Conservative buyers may seek additional confirmation before pulling the trigger, such as a retest forming at 1.14.
GBP/USD:
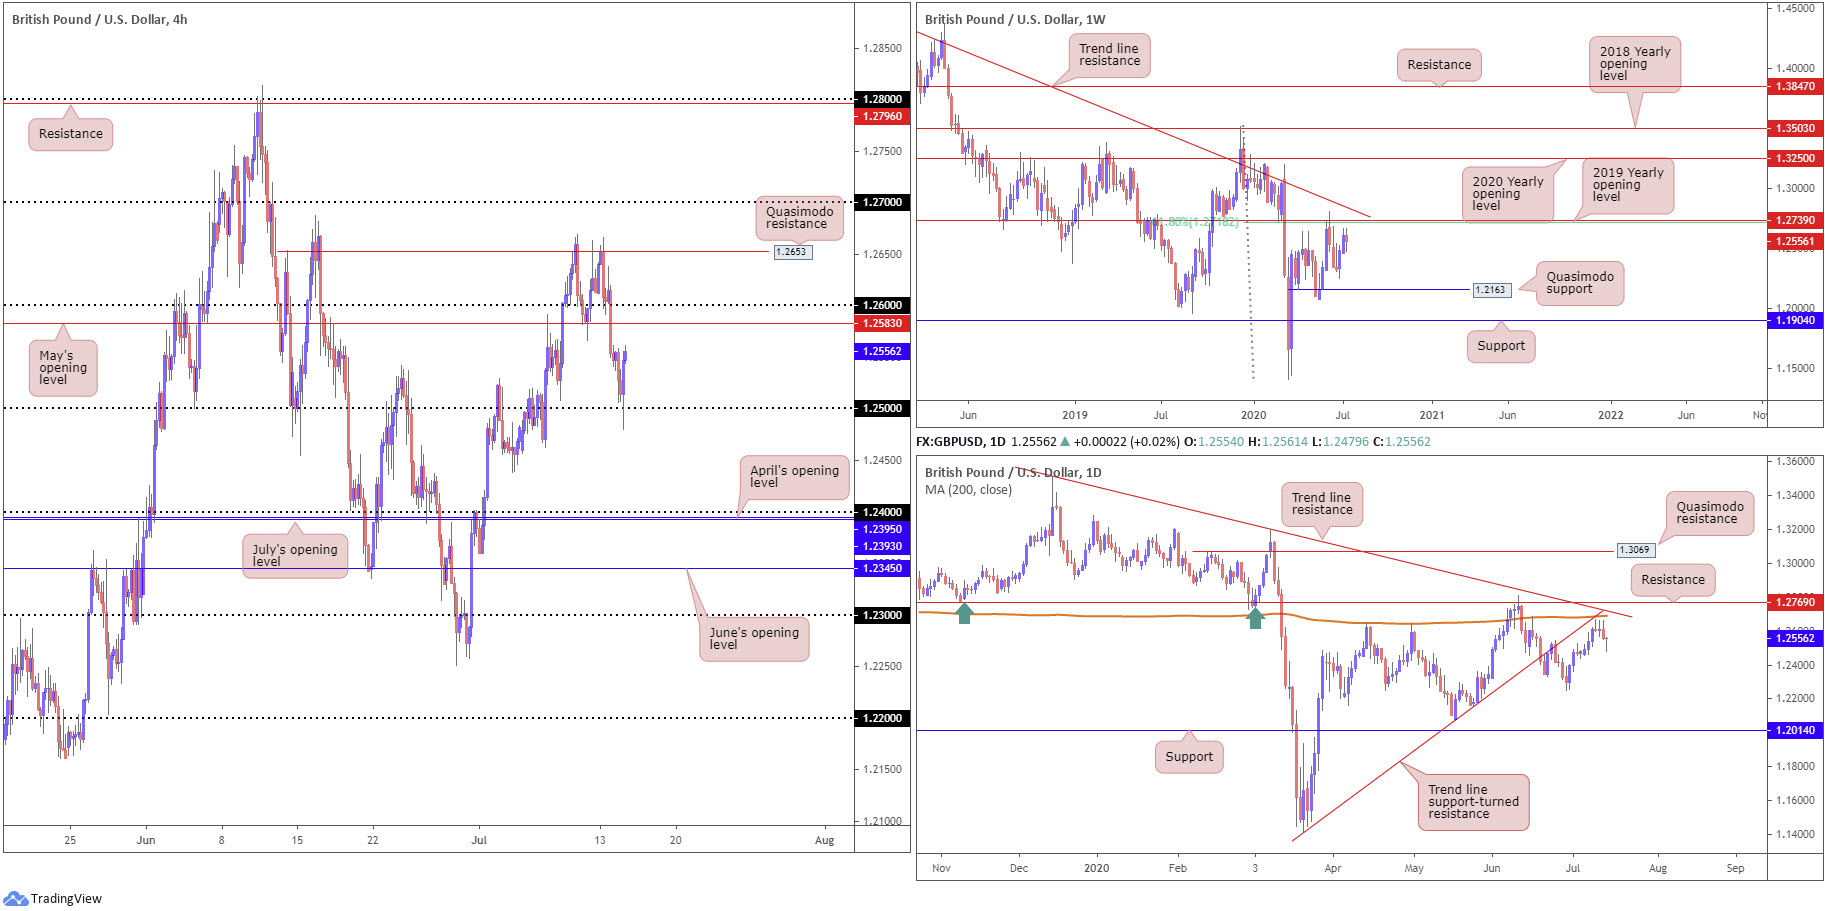
GBP/USD concluded Tuesday off worst levels, initially weighed on by soft UK growth data as well as Brexit uncertainty. Cable gave up the 1.25 handle at one stage, though managed to recover in fine form during US hours, moving May’s opening level at 1.2583 back into the spotlight as possible resistance, closely followed by the 1.26 handle.
The story on the weekly timeframe, following two consecutive weeks of gains, has price located within touching distance of considerable resistance, made up of a 61.8% Fibonacci retracement ratio at 1.2718 and the 2019 yearly opening level at 1.2739.
Movement on the daily timeframe, meanwhile, languishes just south of substantial resistance, made up of trend line support-turned resistance, taken from the low 1.1409, another trend line resistance, extended from the high 1.3514, the 200-day SMA (orange – 1.2690) and resistance at 1.2769. This resistance combination also boasts a connection to the aforementioned weekly resistances. Candlestick traders may also want to acknowledge yesterday’s hammer pattern (bullish).
Areas of consideration:
Between the 1.26 handle and May’s opening level at 1.2583 on the H4 timeframe could be an area of interest today for sellers. Do consider, though, this zone holds limited connection to the higher timeframes. Therefore, the possibility of a run above 1.26 is certainly there.
1.27 also remains interesting. Not only does the psychological base represent a take-profit target for longs, the round number emphasises robust resistance, closely joined by a collection of daily and weekly resistances (highlighted above).
AUD/USD:
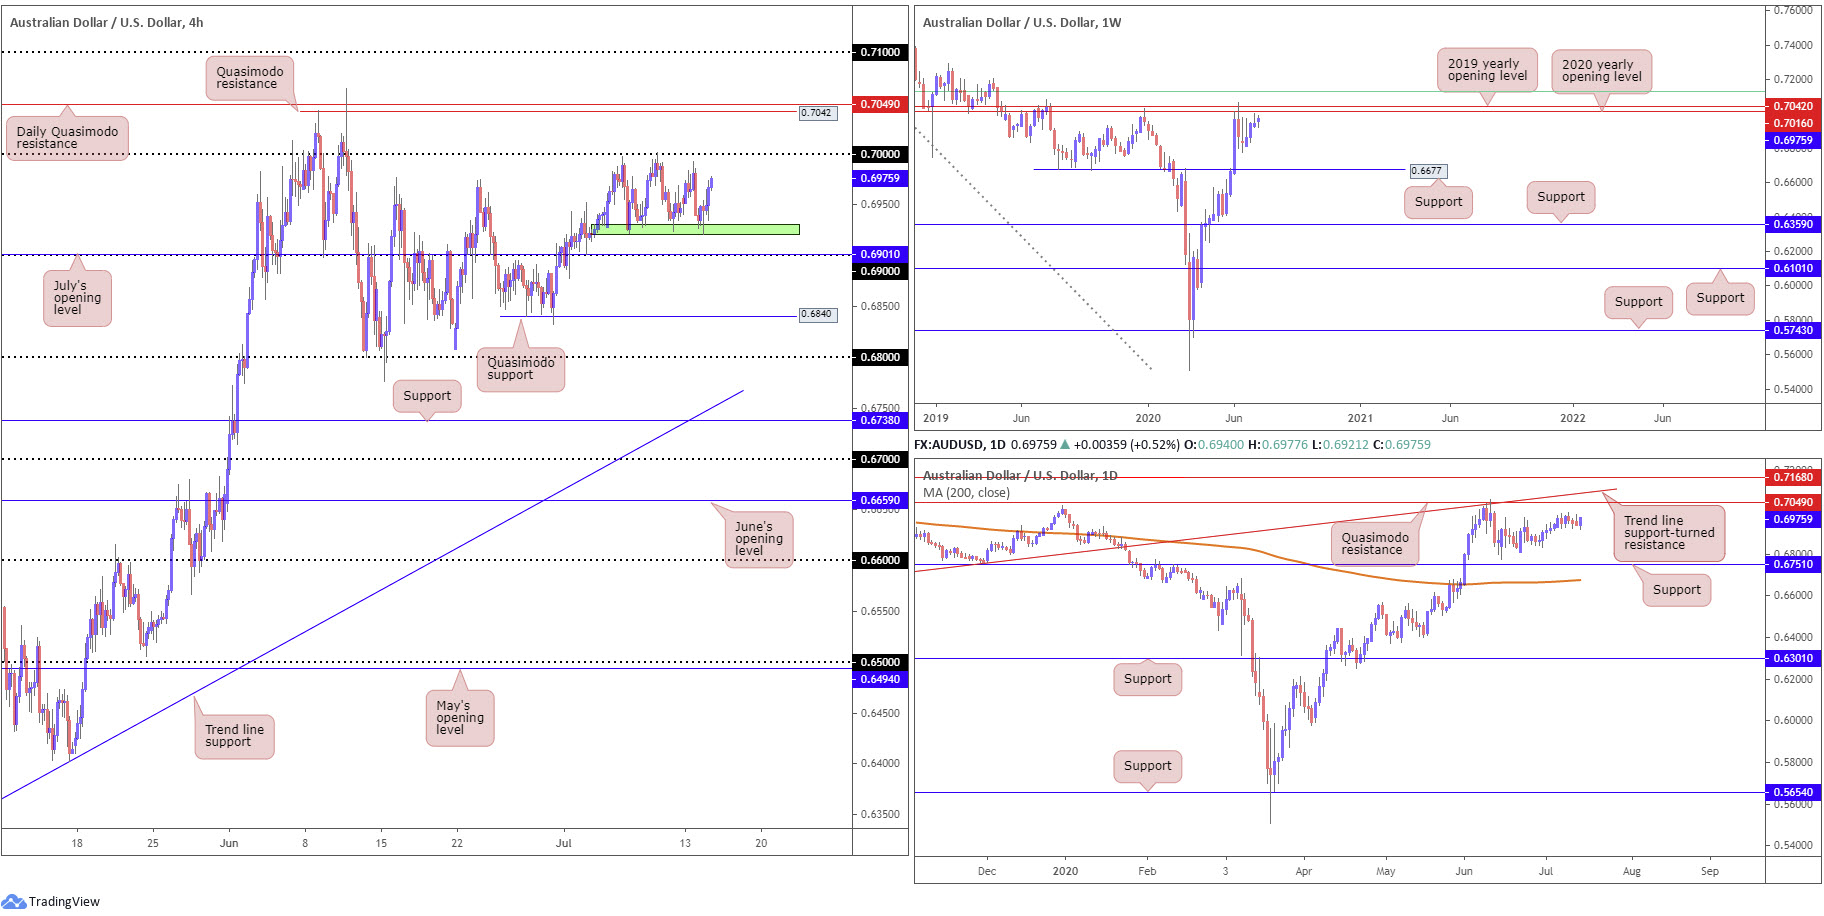
Local H4 support around 0.6930ish (green), once again, held form on Tuesday, aided on the back of upbeat risk sentiment. This places 0.70 back in the fold as an upside target. If a break of the aforementioned support comes to pass, however, the H4 candles are likely bound for 0.69 and July’s opening level at 0.6901. South of here, the pair appears starved of support until a Quasimodo formation hits at 0.6840.
From the weekly timeframe, resistance, forged in the shape of a 2020 yearly opening level and a 2019 yearly opening level, at 0.7016 and 0.7042, respectively, remains on the radar. It might also interest some traders to note just above the said resistances we have a 61.8% Fibonacci retracement ratio sited at 0.7128 (green). In terms of support on the weekly timeframe, crosshairs remain fixed on 0.6677.
A closer reading of candle action on the daily timeframe shows price wandering no man’s land (lack of technical structure), albeit steadily grinding higher since mid-June. Of particular interest on the chart, however, is Quasimodo resistance positioned at 0.7049, a level linking with trend line support-turned resistance, taken from the low 0.6670. Another level worth noting is support coming in at 0.6751 and the 200-day SMA (orange – 0.6675).
Areas of consideration:
Outlook remains unchanged.
With the round number 0.70 (H4) sharing space with weekly resistance at 0.7016, the 2020 yearly opening level, this combination remains a key reversal zone to watch.
Clearing 0.70, on the other hand, brings H4 Quasimodo resistance at 0.7042 to light, which not only lines up with the 2019 yearly opening level on the weekly timeframe, daily Quasimodo resistance also resides close by at 0.7049. Given that, this area is also worthy of the watchlist.
To the downside, aside from 0.6930 support, we have the 0.69 handle merging with July’s opening level at 0.6901 on the H4. Although capable of withstanding downside attempts, the base lacks higher timeframe confluence, therefore vulnerable.
USD/JPY:
Outlook unchanged due to lacklustre movement.
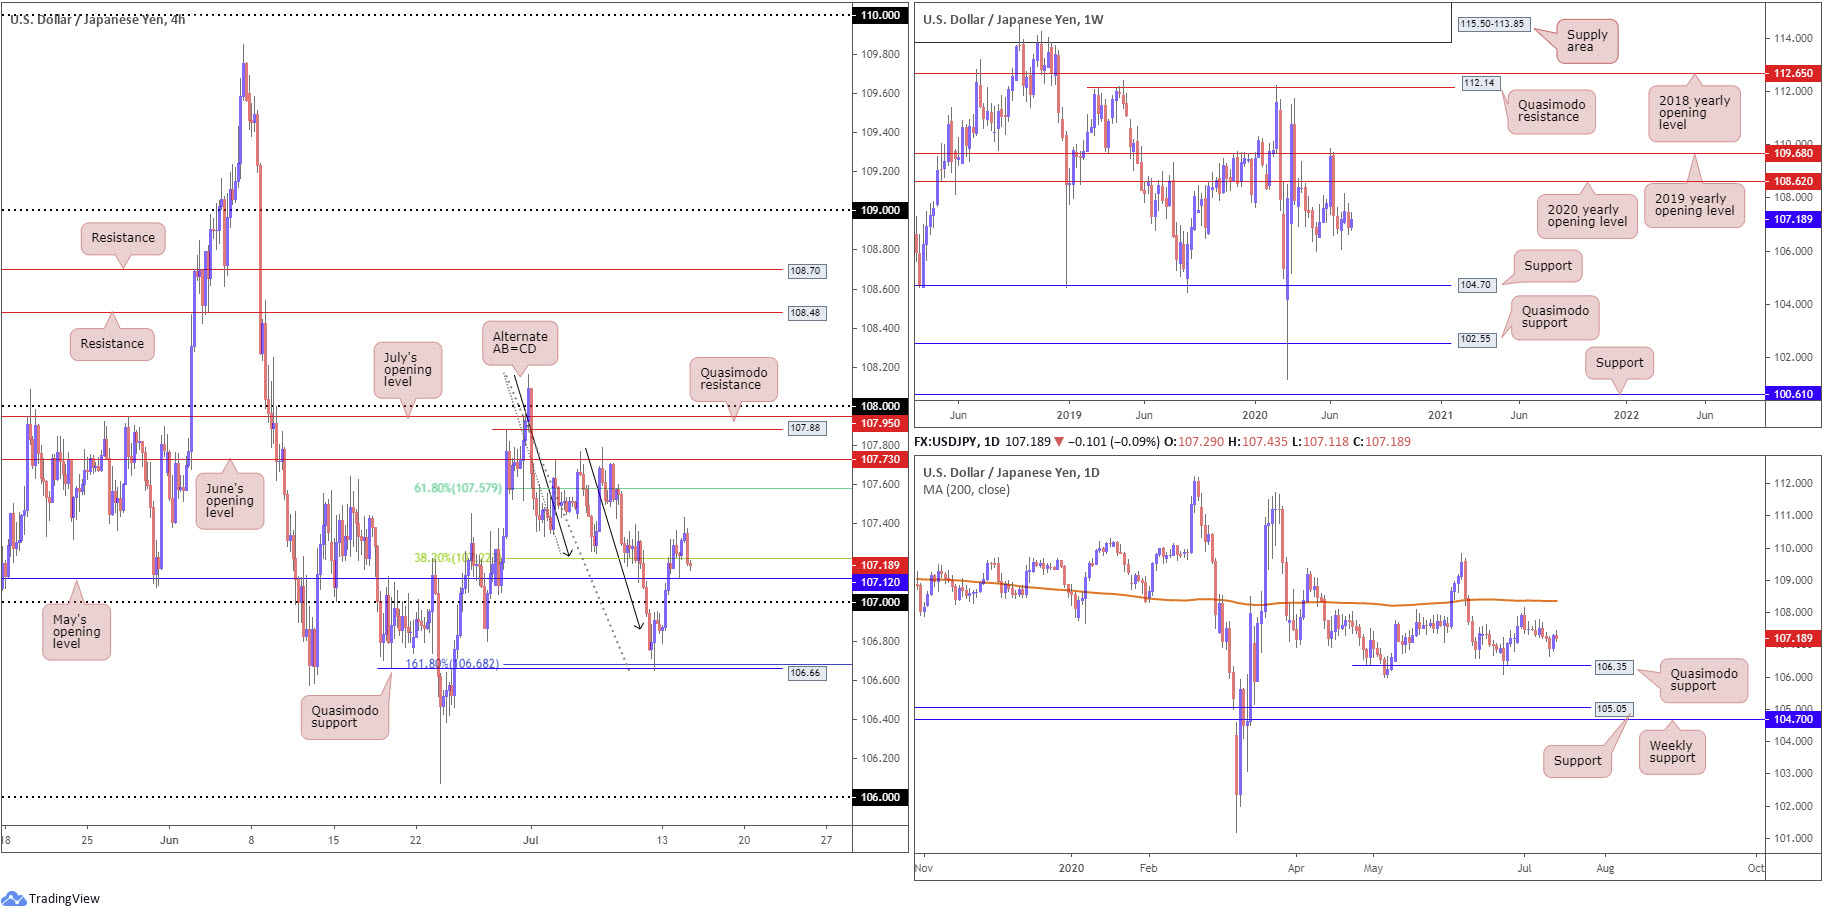
USD/JPY wrapped up marginally lower Tuesday as bids/offers remained pretty much even. The US dollar index, nevertheless, dipped a toe in waters beneath 96.50, weighed by a rebound in US equities.
For traders who read Monday’s technical briefing you may recall the following (italics):
The US dollar extended losses against its Japanese counterpart Friday, leaping through 107 support and testing an interesting area of support at 106.68, in the shape of a strong bullish candle. 106.68, a 161.8% Fibonacci extension point that converges closely with Quasimodo support at 106.66, represents the completion of what is known as an ‘alternate AB=CD (black arrows) correction’.
It is common for AB=CD traders to target the 38.2% Fibonacci retracement (derived from legs A-D), which in this case is seen at 107.22. The second take-profit target is generally found at the 61.8% Fibonacci retracement ratio (107.57).
As evident from the H4 chart this morning, the 38.2% Fibonacci retracement ratio at 107.22 was tested Monday, with Tuesday reaching highs at 107.43, no doubt pleasing longs off 106.66. The next target, as emphasised above, rests at the 61.8% Fibonacci retracement ratio from 107.57.
Further afield on the weekly timeframe, price is seen consolidating beneath the 2020 yearly opening level at 108.62. Support, on the other hand, can be derived from the 105.98 6th May low, with a break uncovering long-term support plotted at 104.70. Technical structure on the daily timeframe remains focused on Quasimodo support from 106.35 and the 200-day SMA (orange – 108.36), assuming we get past the 108.16 July 1st high.
Areas of consideration:
H4 AB=CD traders likely reduced risk to breakeven and banked partial profits at 107.22, with follow-through buying expected to reach the 61.8% Fibonacci retracement ratio from 107.57. Before reaching the latter, a second retest at May’s opening level from 107.12 could come to fruition, a move that may provide sufficient fuel to reach 107.57 and offer additional buying opportunities.
USD/CAD:
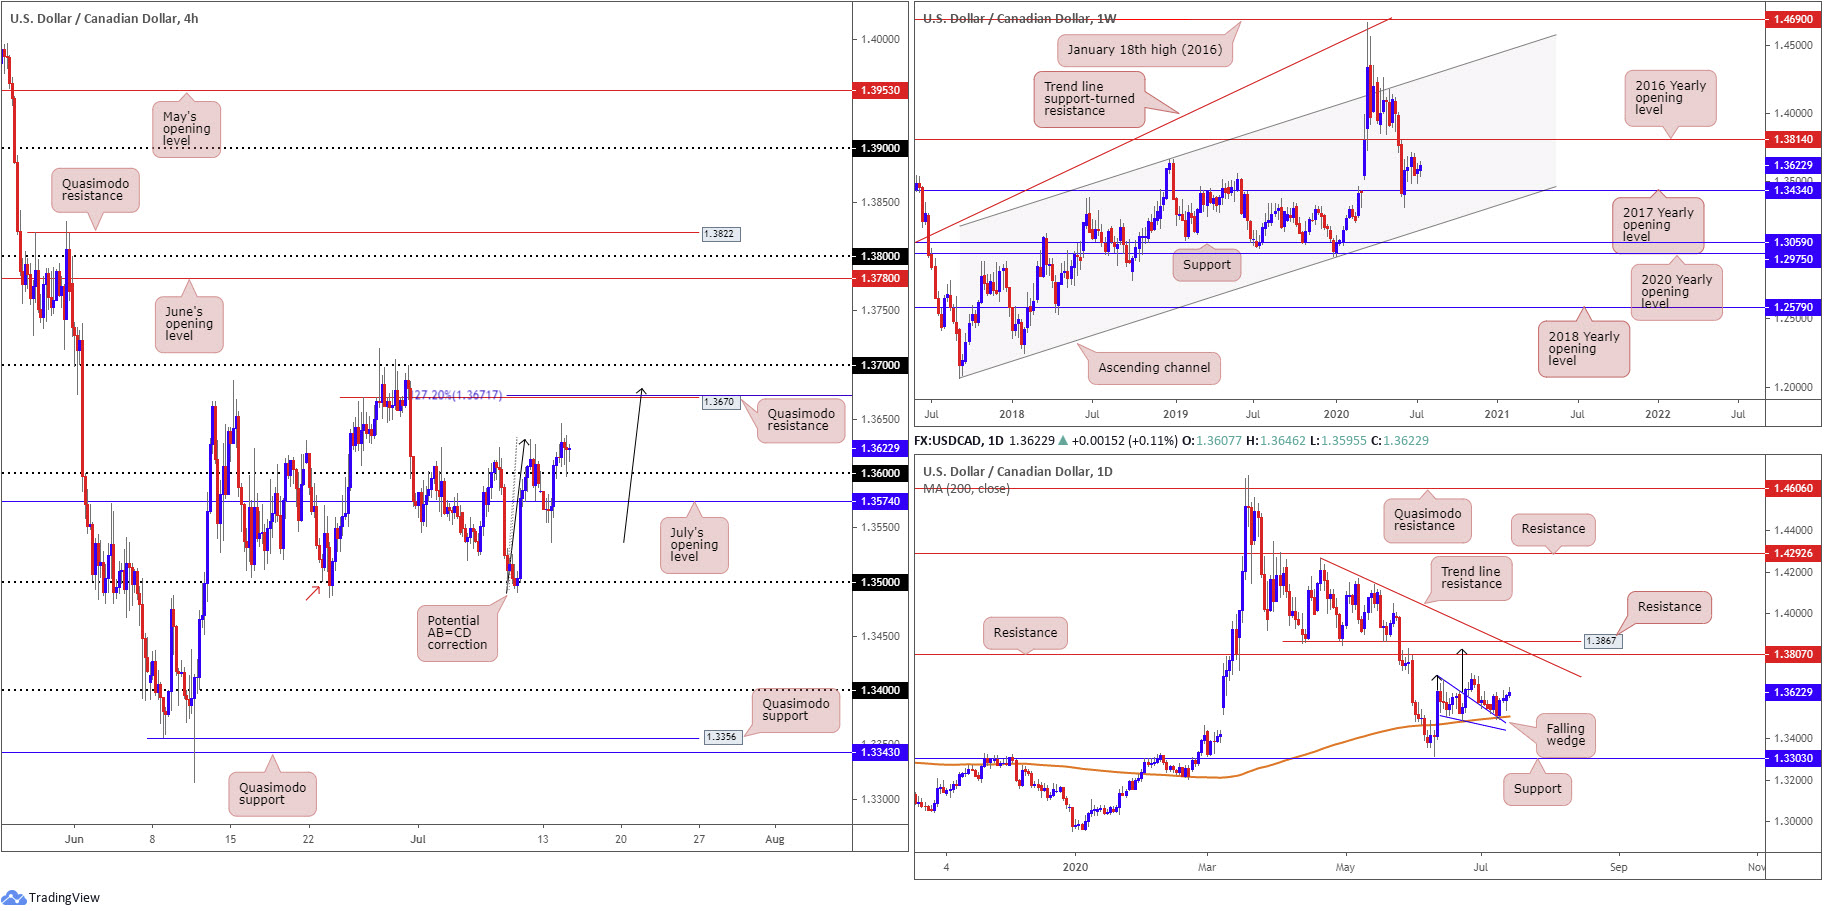
Despite WTI prices rallying above $40.00/bbl, movement that tends to bolster the Canadian dollar, and the US dollar index plunging through 96.50, USD/CAD tentatively defended 1.36 as support on the H4 timeframe Tuesday. This places Quasimodo resistance at 1.3670 in view today, sharing space with a 127.2% AB=CD (black arrows) resistance at 1.3671.
Action on the weekly timeframe currently hovers north of the 2017 yearly opening level at 1.3434. Beyond 1.3434, channel support, taken from the low 1.2061, can be viewed as the next potential floor. A USD/CAD bid throws the 2016 yearly opening level at 1.3814 in the pot as feasible resistance, with follow-through buying to try and tackle a dense block of supply between 1.4190/1.3912.
Technical movement on the daily timeframe witnessed a recovery form from the upper edge of a breached falling wedge pattern (1.3686/1.3504) into the second half of last week, merging with the 200-day SMA (1.3506). Take-profit targets out of a falling wedge pattern can be measured by taking the base value and adding this figure to the breakout point (black arrows), which as you can see in this case, meets closely with resistance at 1.3807, followed by another layer of resistance at 1.3867.
Areas of consideration:
Owing to daily structure (price rebounding from notable support), and lack of resistance on the weekly timeframe, traders are likely seeking bullish scenarios off 1.36 today, targeting H4 Quasimodo resistance at 1.3670 and 1.37. Moves beyond the aforementioned levels are also plausible, according to the higher timeframes (see above in bold), targeting the 1.38ish region.
USD/CHF:
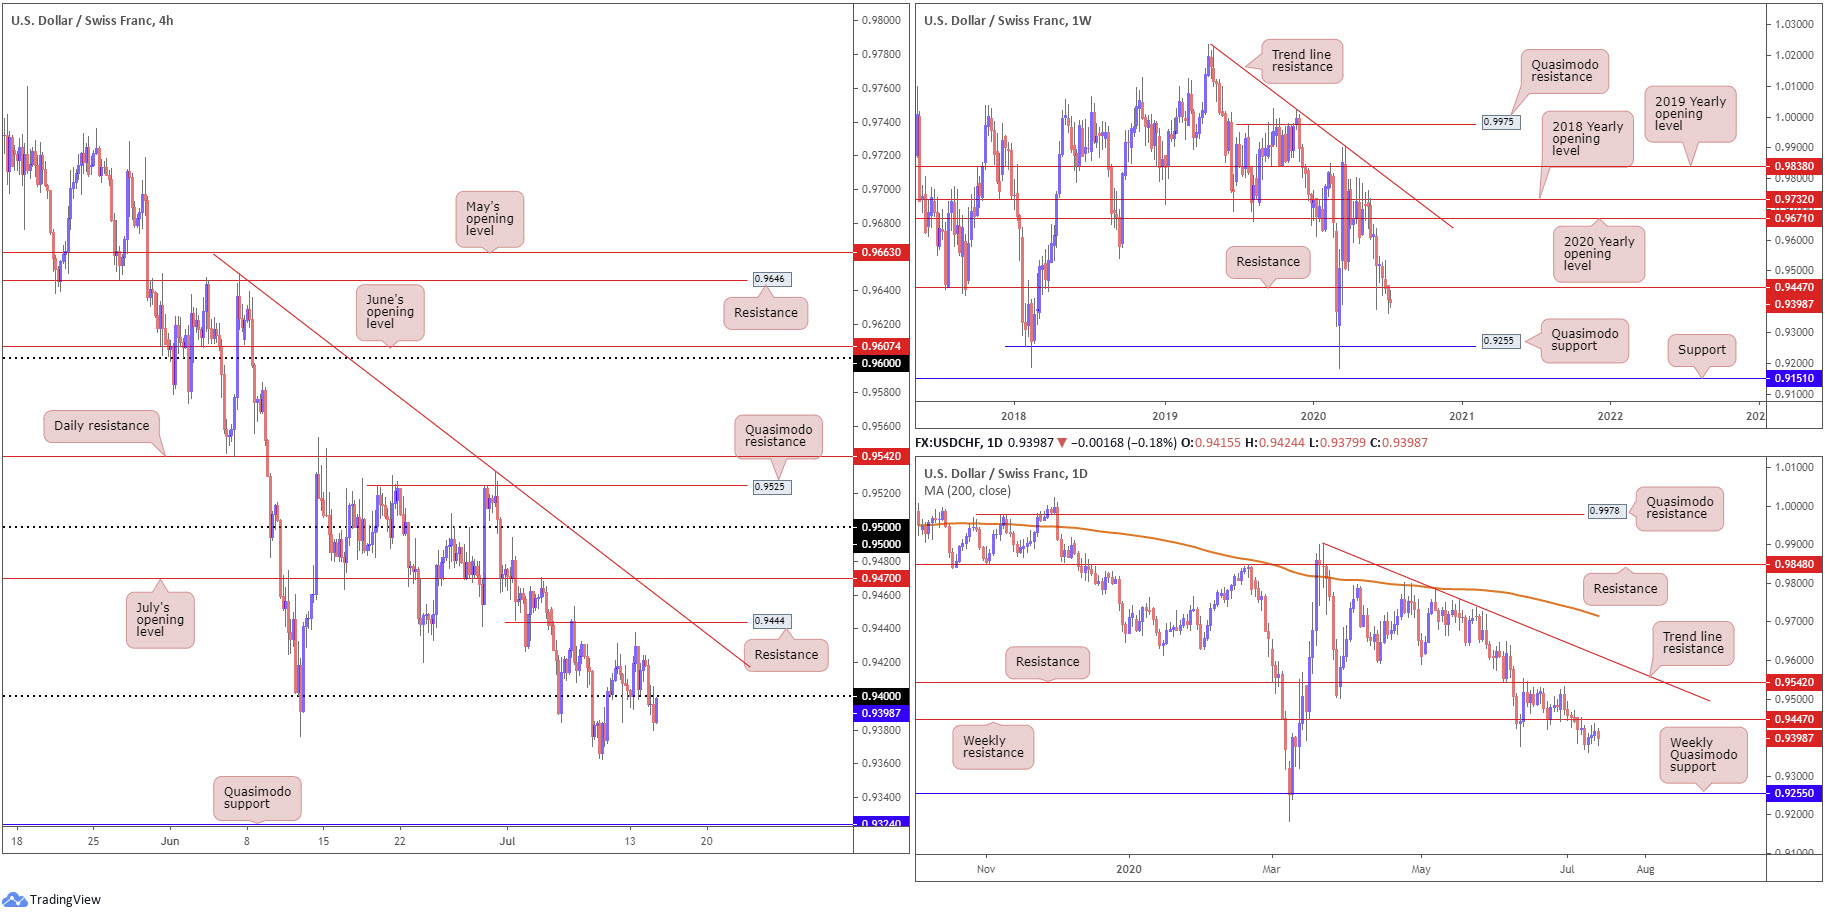
The US dollar index hopped through 96.50 Tuesday, making it difficult for USD/CHF to establish any kind of bullish defence off 0.94 on the H4. The latter gave way in early European hours and called for a retest heading into US trading. Despite a modest dip to lows at 0.9380, a second retest at 0.94 recently occurred. Assuming the unit remains under 0.94, this shifts focus to the 0.9362 July 9 low, with a breach exposing 0.9324, a Quasimodo support.
Based on the weekly timeframe, we can see price recently dipped through support at 0.9447 (now a serving resistance), chalking up a third consecutive weekly decline. The break south has likely caught the attention of sellers, targeting Quasimodo support plotted at 0.9255. The daily timeframe offers a similar picture to the weekly chart at the moment, underlining bearish themes south of the recently penetrated weekly support at 0.9447, targeting 0.9255.
Areas of consideration:
Higher timeframe sellers modestly govern movement south of weekly resistance at 0.9447 right now, sending a strong bearish vibe to the H4 timeframe today. As a consequence, the 0.94 retest as resistance (H4) may be enough to attract sellers, targeting the 0.9362 July 9 low, and Quasimodo support at 0.9324.
Dow Jones Industrial Average:
US stocks climbed Tuesday in dominant fashion after Fed Gov. Lael Brainard called for sustained large-scale asset purchases. The Dow Jones Industrial Average advanced 556.79 points, or 2.13%; the S&P 500 advanced 42.30 points, or 1.34%, and the tech-heavy Nasdaq 100 concluded higher by 87.31 points, or 0.82%.
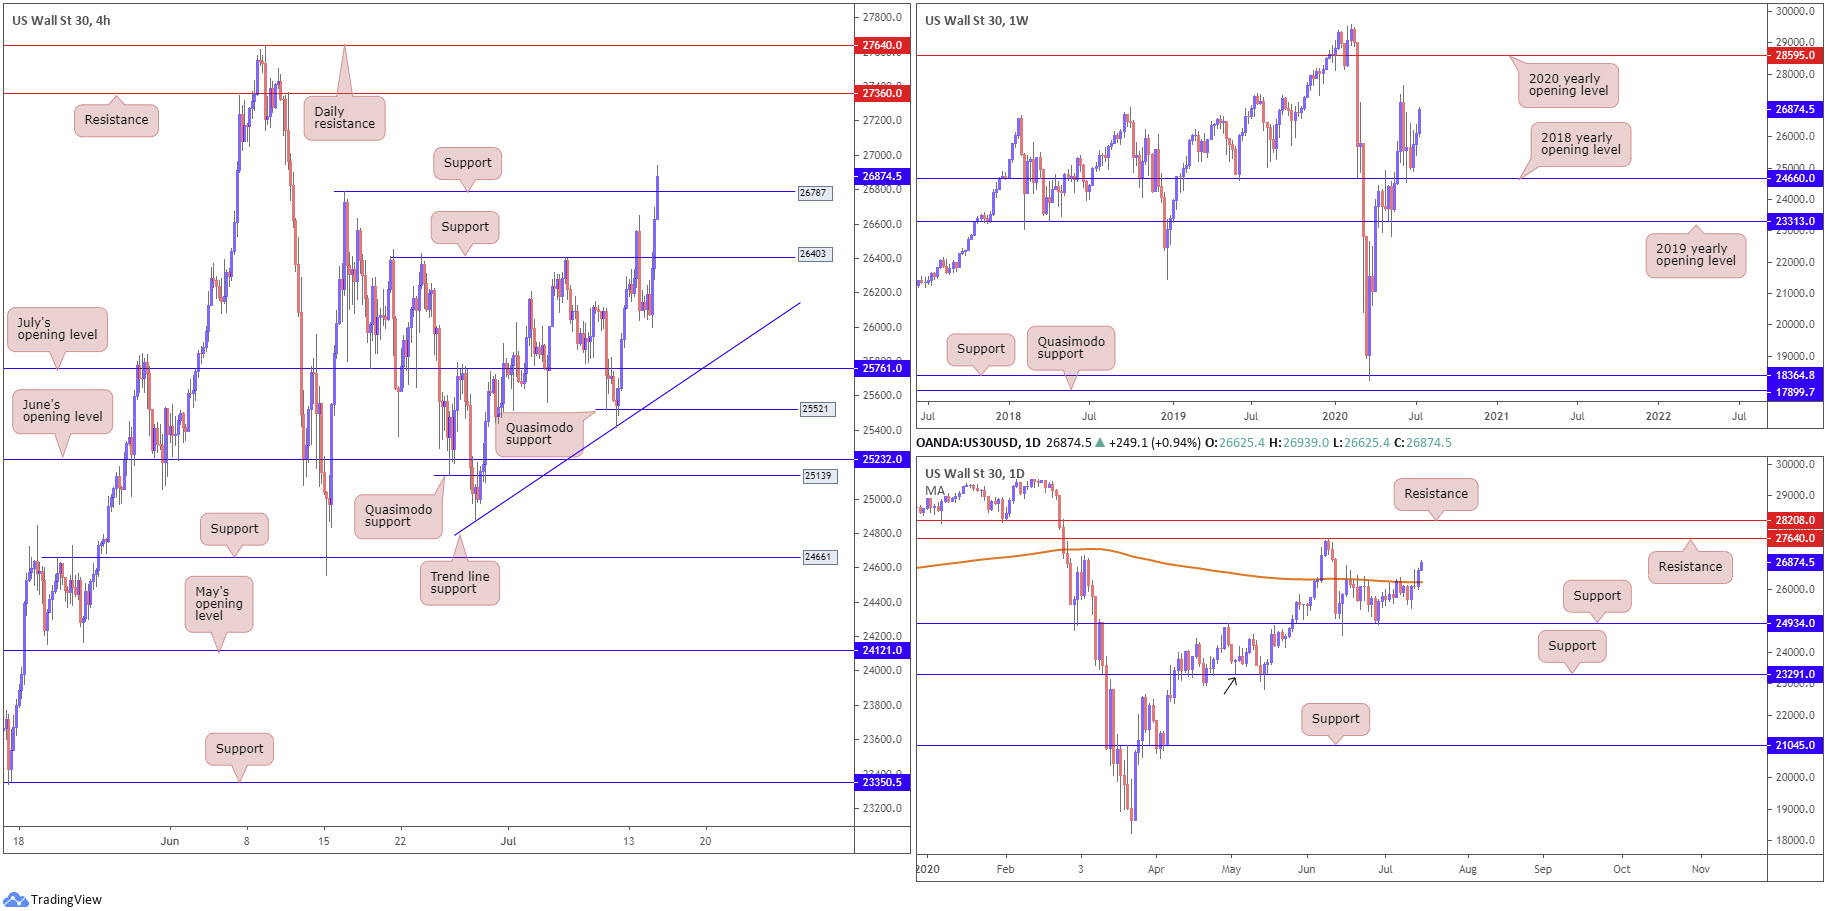
In recent hours, the unit extended upside on the back of Moderna’s COVID-19 vaccine hopes, consequently pushing through H4 resistance at 26403 (now a serving support) and the 26787 high. This has shined the spotlight on H4 resistance coming in at 27360.
Since June 15, price action on the daily timeframe has ranged between the 200-day SMA (orange – 26247) and support from 24934. The aforementioned SMA was penetrated Tuesday, pointing to a probable run towards resistance from 27640.
From the weekly timeframe, the 2018 yearly opening level at 24660 remains an important base of support. In the event traders manage to keep their head above water here, we might pull in the 27638 high, followed by the 2020 yearly opening level at 28595.
Areas of consideration:
Closing above the 200-day SMA swings the DJIA into bullish territory, with traders likely targeting daily resistance at 27640. In terms of H4 movement, buyers may welcome a retest at 26787 today, which if a bullish rotation comes to pass, could guide things towards H4 resistance at 27360, closely followed by the aforementioned daily resistance.
XAU/USD (GOLD):
For those who read Tuesday’s technical briefing you may recall the following (italics):
With higher timeframes recently conquering resistance and, at least for the time being, holding firm, H4 support at 1791.7/H4 trend line support likely remains of interest as a reversal zone today.
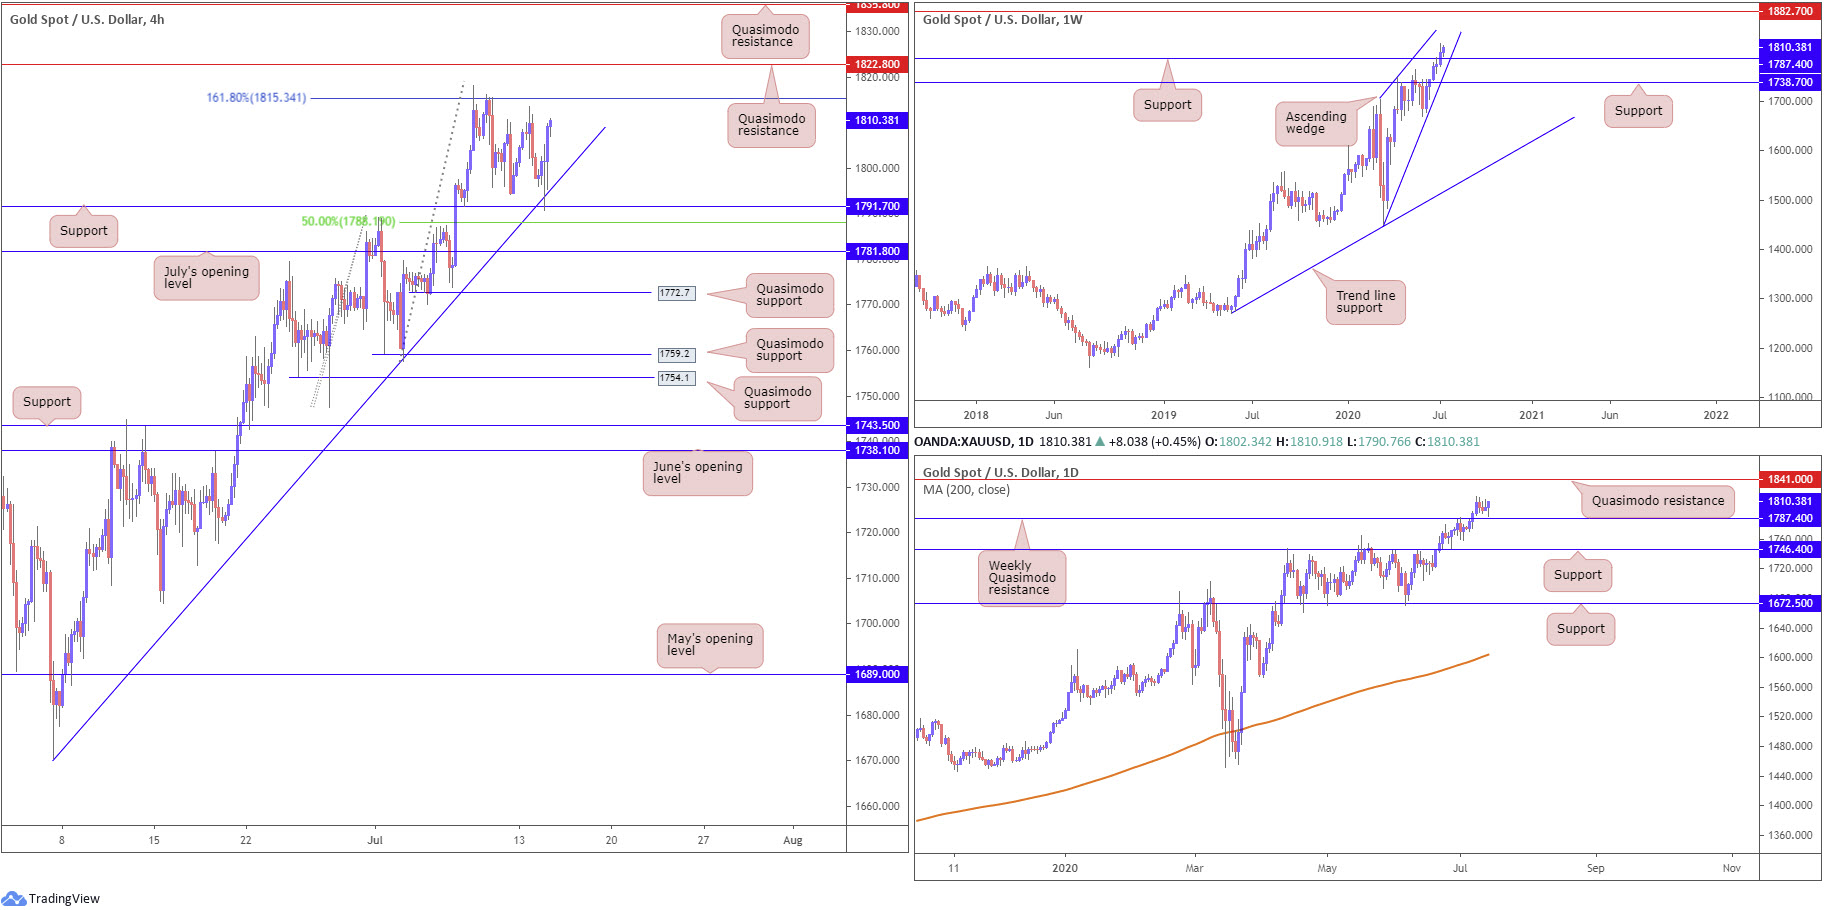
As evident from the H4 chart this morning, Tuesday had price action cross swords with support at 1791.7 and merging trendline support, extended from the low 1670.4, missing a 50.00% retracement ratio at 1788.1 by a hair before turning higher. What is appealing about the aforementioned H4 structure is its connection with weekly support at 1787.4.
Here’s where we stand on the higher timeframes (italics):
From the weekly timeframe, bulls elbowed above Quasimodo resistance at 1787.4 (now a serving support) in recent trading. In line with the underlying trend, the break higher has perhaps laid the foundation for continuation buying to resistance stationed at 1882.7. Also of interest on the weekly timeframe is a potential ascending wedge pattern, forming between 1451.4/1703.2. In addition, clearing weekly Quasimodo resistance at 1787.4 on the daily timeframe stresses a possible run to daily Quasimodo resistance at 1841.0.
Areas of consideration:
Traders long the 1791.7 retest are likely watching the 161.8% H4 Fibonacci extension point at 1815.3 as an initial take-profit zone, followed by H4 Quasimodo resistance at 1822.8. Should we reach this far north, traders are urged to pencil in the possibility of climbing to another H4 Quasimodo resistance at 1835.8. This is the point the yellow metal may begin to close in on higher timeframe resistances: 1882.7 and 1841.0.
Additional buying opportunities, therefore, might be found above 1822.8.
The accuracy, completeness and timeliness of the information contained on this site cannot be guaranteed. IC Markets does not warranty, guarantee or make any representations, or assume any liability regarding financial results based on the use of the information in the site.
News, views, opinions, recommendations and other information obtained from sources outside of www.icmarkets.com.au, used in this site are believed to be reliable, but we cannot guarantee their accuracy or completeness. All such information is subject to change at any time without notice. IC Markets assumes no responsibility for the content of any linked site.
The fact that such links may exist does not indicate approval or endorsement of any material contained on any linked site. IC Markets is not liable for any harm caused by the transmission, through accessing the services or information on this site, of a computer virus, or other computer code or programming device that might be used to access, delete, damage, disable, disrupt or otherwise impede in any manner, the operation of the site or of any user’s software, hardware, data or property.


